| Param | Original file | Final file |
|---|---|---|
| Filename | modeM0/AS1A07_065T01_9000003554_23980cztM0_level2.evt | modeM0/AS1A07_065T01_9000003554_23980cztM0_level2_quad_clean.evt |
| Size (bytes) | 679,023,360 | 60,984,000 |
| Size | 647.6 MB | 58.2 MB |
| Events in quadrant A | 3,246,855 | 414,179 |
| Events in quadrant B | 3,412,497 | 423,545 |
| Events in quadrant C | 3,372,626 | 394,934 |
| Events in quadrant D | 10,086,213 | 154,499 |
| Mode M9 | |||
|---|---|---|---|
| Quadrant | BADHDUFLAG | Total packets | Discarded packets |
| A | 0 | 15 | 0 |
| B | 0 | 16 | 0 |
| C | 0 | 16 | 0 |
| D | 0 | 16 | 0 |
| Mode M0 | |||
|---|---|---|---|
| Quadrant | BADHDUFLAG | Total packets | Discarded packets |
| A | 0 | 13613 | 2 |
| B | 0 | 14067 | 2 |
| C | 0 | 13932 | 3 |
| D | 0 | 34605 | 2 |
| Mode SS | |||
|---|---|---|---|
| Quadrant | BADHDUFLAG | Total packets | Discarded packets |
| A | 0 | 134 | 0 |
| B | 0 | 134 | 0 |
| C | 0 | 134 | 0 |
| D | 0 | 134 | 0 |
| Quadrant | Total seconds | Saturated seconds | Saturation percentage |
|---|---|---|---|
| A | 6565 | 72 | 1.096725% |
| B | 6565 | 104 | 1.584158% |
| C | 6564 | 149 | 2.269957% |
| D | 6564 | 4037 | 61.502133% |
Noise dominated data is calculated using 1-second bins in cleaned event files. If a bin has >2000 counts, and if more than 50% of those come from <1% of pixels, then it is considered to be noise-dominated and hence unusable.
| Quadrant | # 1 sec bins | Bins with >0 counts | Bins with >2000 counts | High rate bins dominated by noise | Noise dominated (total time) | Noise dominated (detector-on time) | Marked lightcurve |
|---|---|---|---|---|---|---|---|
| A | 7570 | 6565 | 0 | 0 | 0.00% | 0.00% | 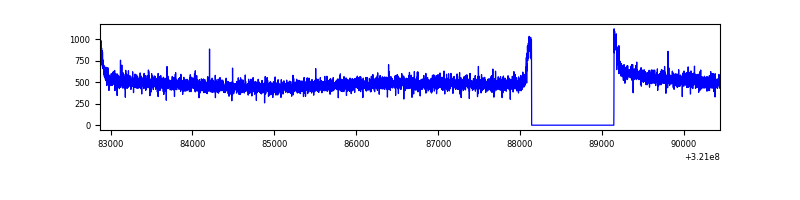 |
| B | 7570 | 6565 | 3 | 3 | 0.04% | 0.05% | 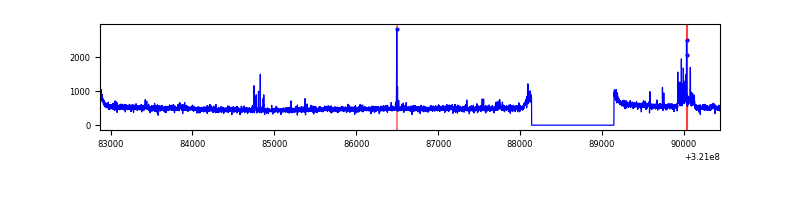 |
| C | 7569 | 6565 | 26 | 26 | 0.34% | 0.40% | 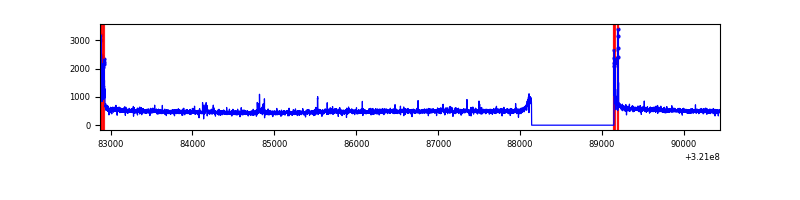 |
| D | 7569 | 6564 | 2234 | 2234 | 29.52% | 34.03% | 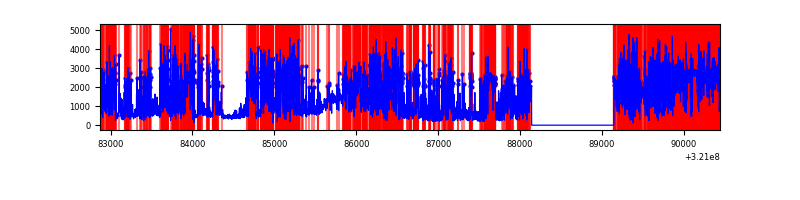 |
Top three noisy pixels from each quadrant. If the there are fewer than three noisy pixels in the level2.evt file, extra rows are filled as -1
| Pixel properties | Quadrant properties | ||||||
|---|---|---|---|---|---|---|---|
| Quadrant | DetID | PixID | Counts | Sigma | Mean | Median | Sigma |
| A | 13 | 254 | 9982 | 54.12 | 842 | 824 | 169.2 |
| A | 3 | 137 | 7420 | 38.98 | 842 | 824 | 169.2 |
| A | 0 | 226 | 7102 | 37.1 | 842 | 824 | 169.2 |
| B | 0 | 197 | 98319 | 602.7 | 838 | 817 | 161.8 |
| B | 12 | 111 | 19830 | 117.53 | 838 | 817 | 161.8 |
| B | 11 | 111 | 17978 | 106.08 | 838 | 817 | 161.8 |
| C | 0 | 10 | 149733 | 797.63 | 794 | 801 | 186.7 |
| C | 14 | 238 | 129437 | 688.93 | 794 | 801 | 186.7 |
| C | 13 | 61 | 5442 | 24.86 | 794 | 801 | 186.7 |
| D | 12 | 218 | 7629319 | 66341.37 | 466 | 451 | 115.0 |
| D | 12 | 250 | 315731 | 2741.71 | 466 | 451 | 115.0 |
| D | 1 | 52 | 133158 | 1154.03 | 466 | 451 | 115.0 |
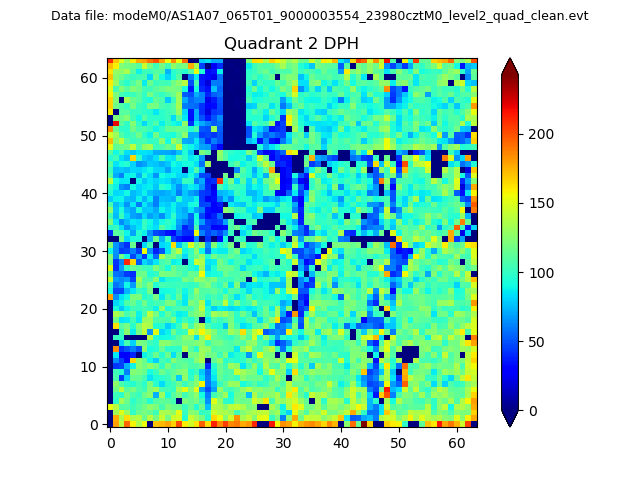
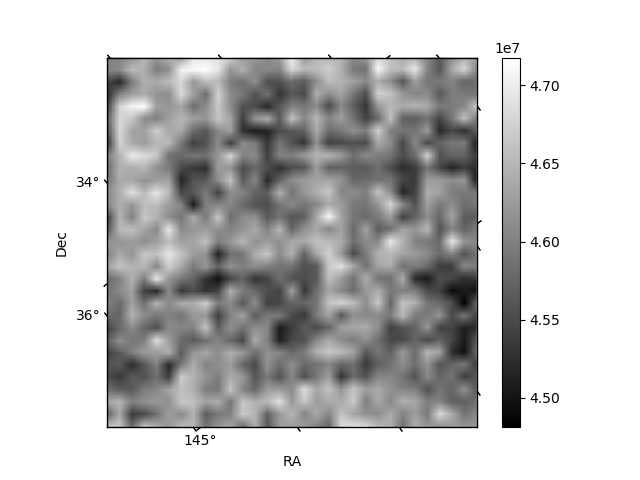
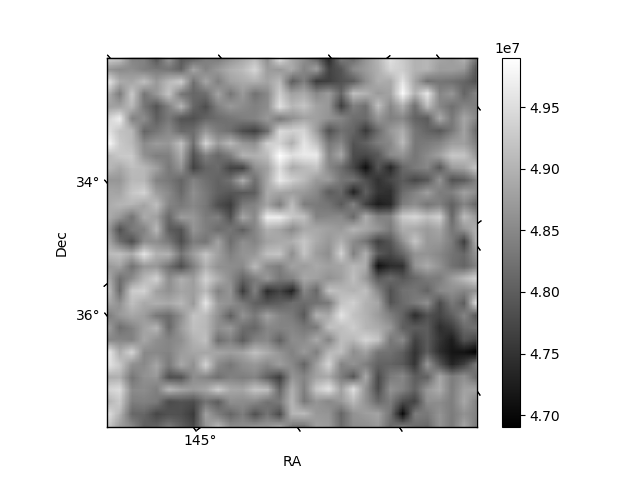
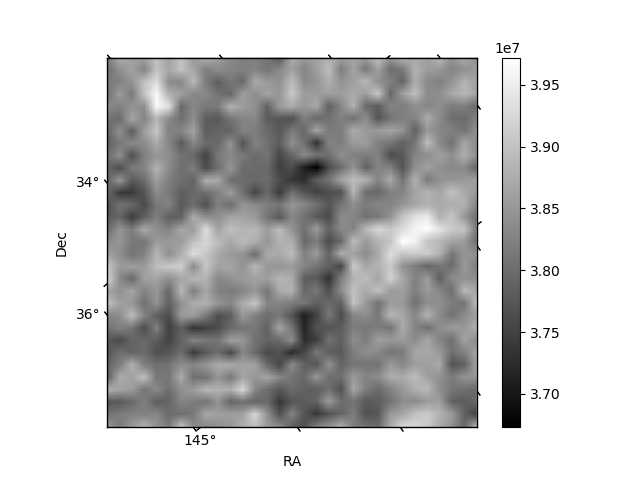
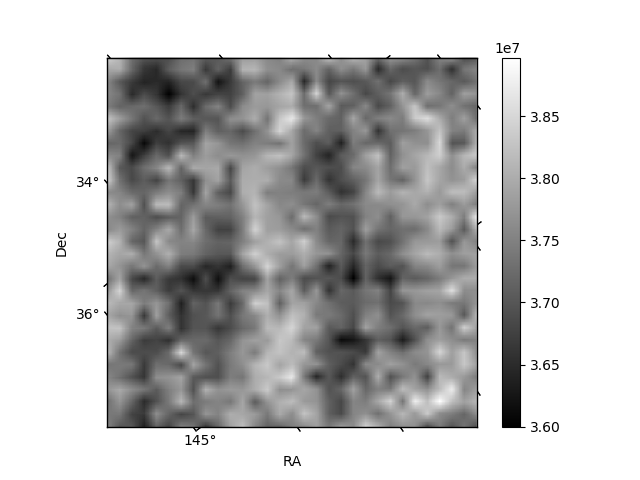
Histogram calculated using DETX and DETY for each event in the final _common_clean file
| Quadrant A | 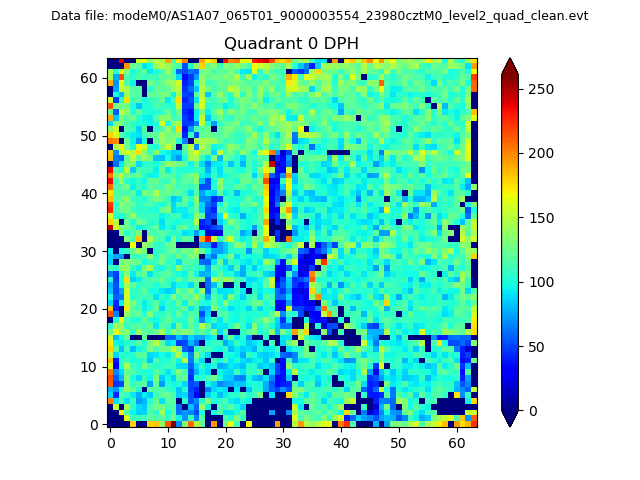 |
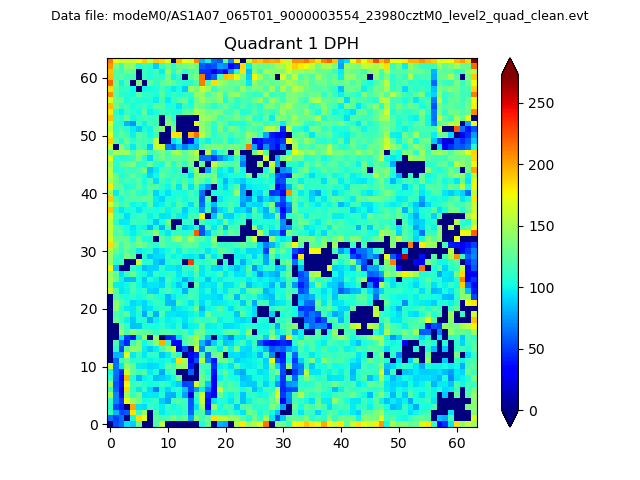 |
Quadrant B |
|---|---|---|---|
| Quadrant D | 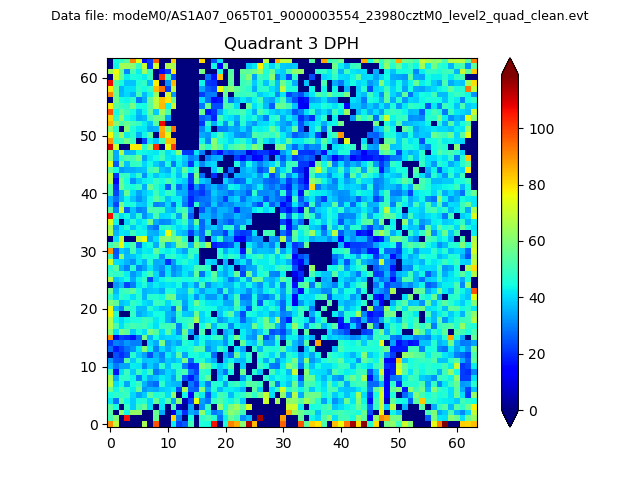 |
 |
Quadrant C |
| Plot type | Count rate plots | Images |
|---|---|---|
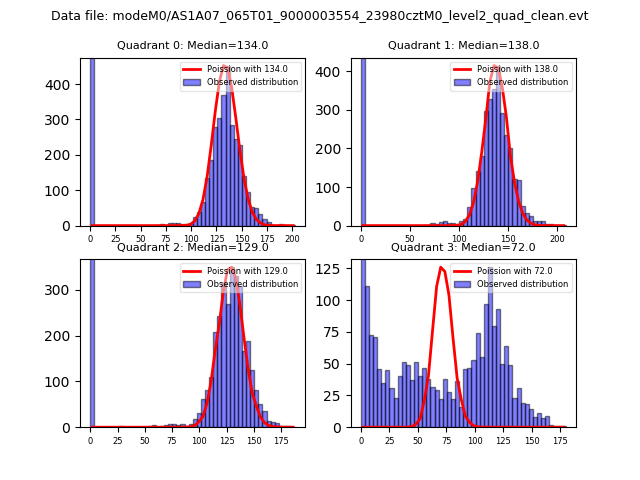
| Comparison with Poisson distribution Blue bars denote a histogram of data divided into 1 sec bins. Red curve is a Poisson curve with rate = median count rate of data. |
 |
 |
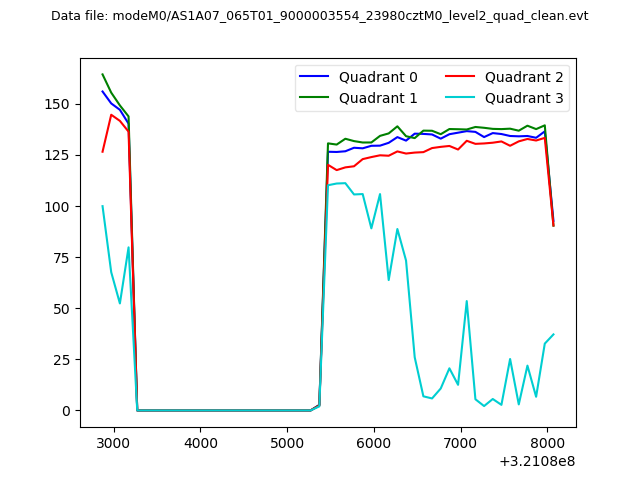
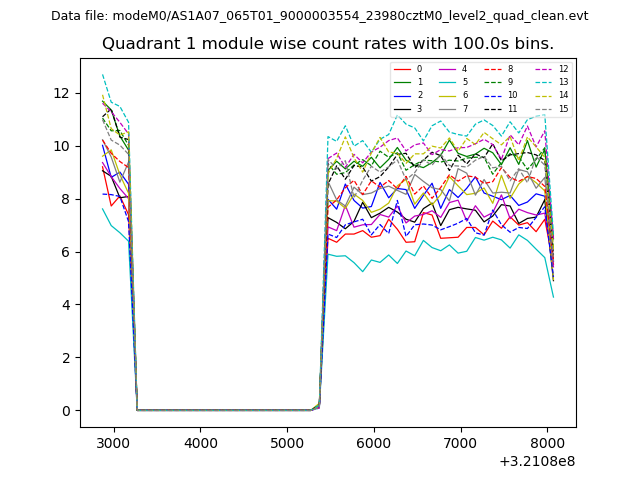
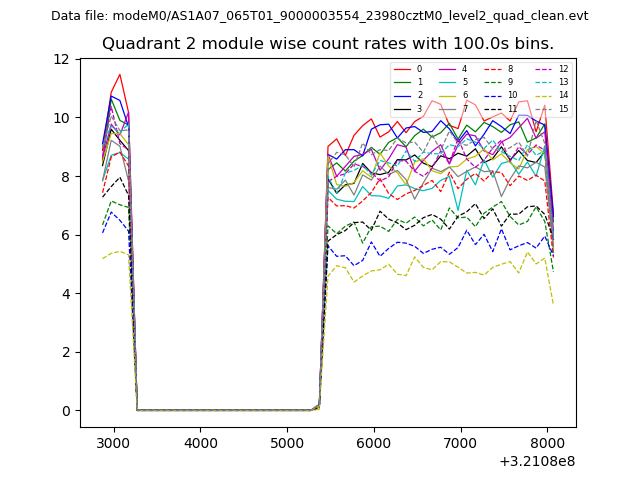
| Quadrant-wise count rates Data is divided into 100 sec bins |
 |
|
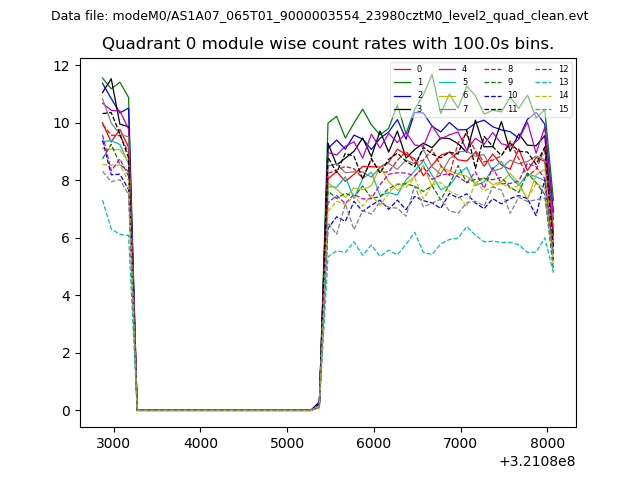
| Module-wise count rates for Quadrant A Data is divided into 100 sec bins |
 |
 |
| Module-wise count rates for Quadrant B Data is divided into 100 sec bins |
 |
 |
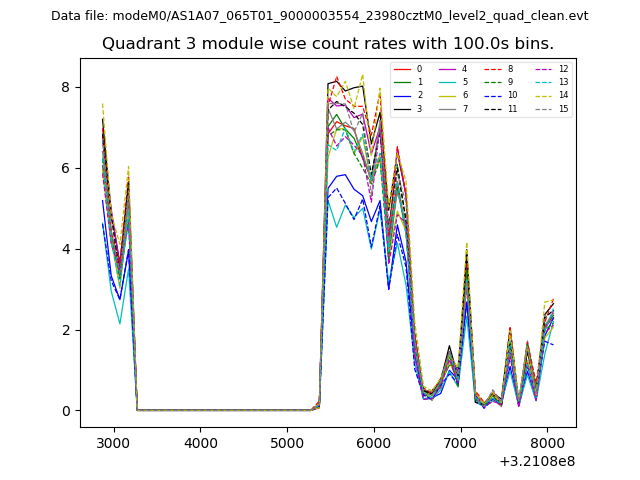
| Module-wise count rates for Quadrant C Data is divided into 100 sec bins |
 |
 |
| Module-wise count rates for Quadrant D Data is divided into 100 sec bins |
 |
 |
| Parameter | Plot |
|---|---|
| CZT HV Monitor | 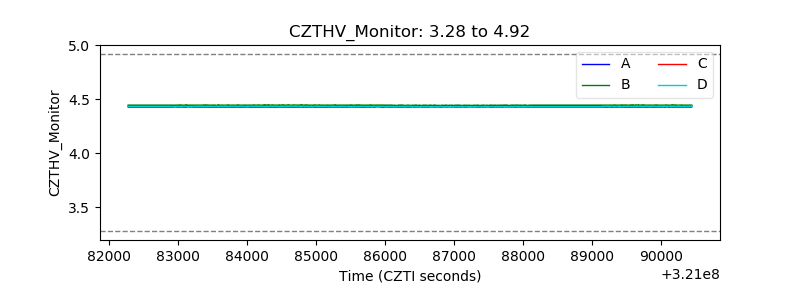 |
| D_VDD | 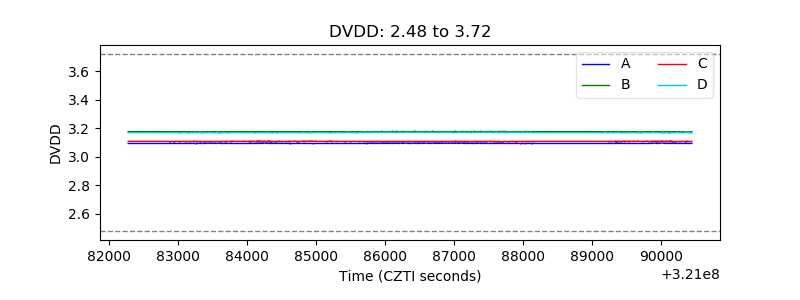 |
| Temperature 1 | 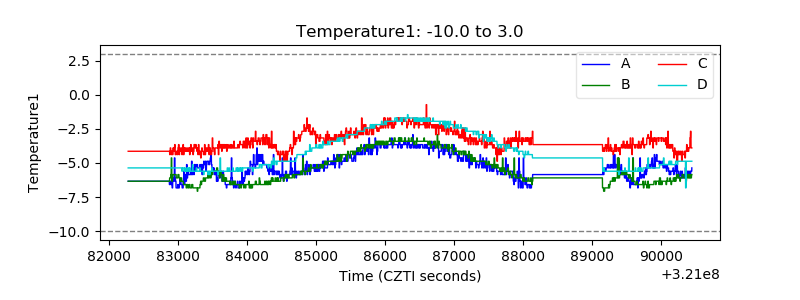 |
| Veto HV Monitor |  |
| Veto LLD | 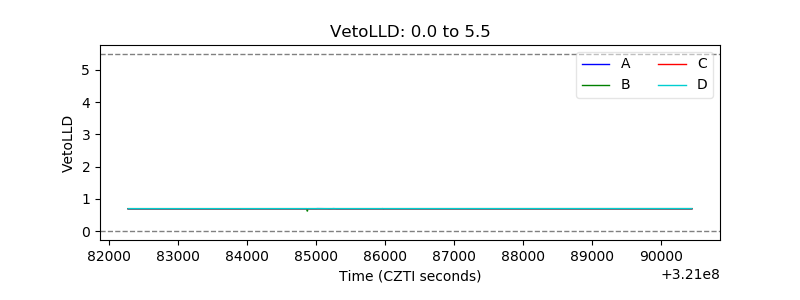 |
| Alpha Counter |  |
| _CPM_Rate | 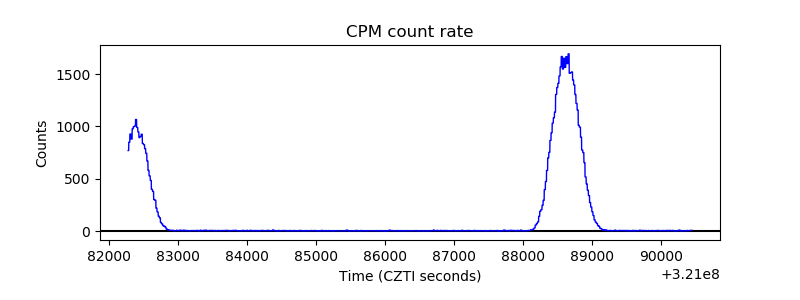 |
| CZT Counter | 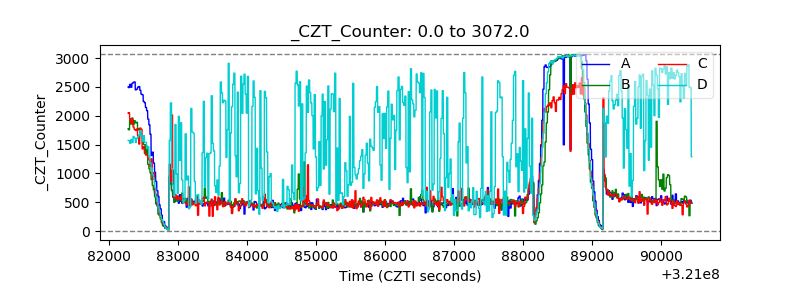 |
| +2.5 Volts monitor |  |
| +5 Volts monitor |  |
| _ROLL_ROT | 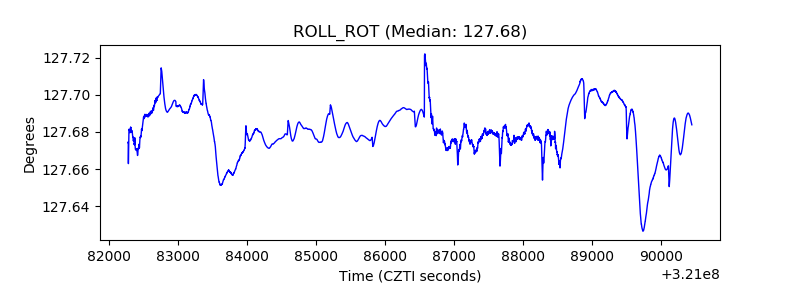 |
| _Roll_DEC | 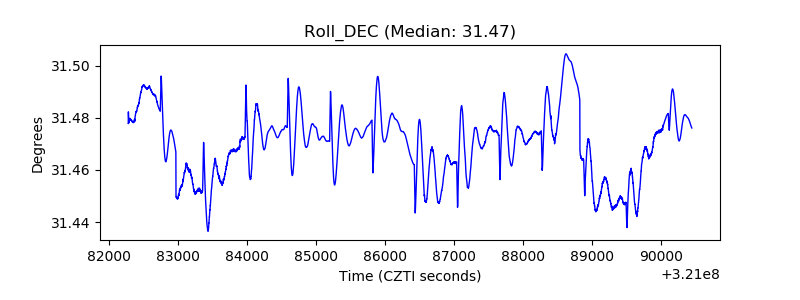 |
| _Roll_RA | 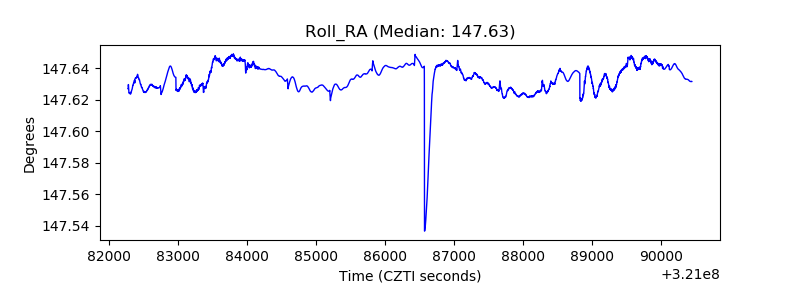 |
| Veto Counter | 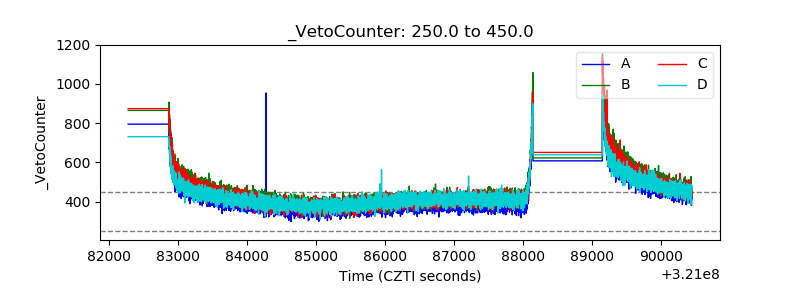 |