| Param | Original file | Final file |
|---|---|---|
| Filename | modeM0/AS1A07_065T01_9000003554_23982cztM0_level2.evt | modeM0/AS1A07_065T01_9000003554_23982cztM0_level2_quad_clean.evt |
| Size (bytes) | 760,662,720 | 62,107,200 |
| Size | 725.4 MB | 59.2 MB |
| Events in quadrant A | 3,408,253 | 409,267 |
| Events in quadrant B | 3,613,118 | 416,726 |
| Events in quadrant C | 3,431,859 | 389,416 |
| Events in quadrant D | 12,142,426 | 209,668 |
| Mode M9 | |||
|---|---|---|---|
| Quadrant | BADHDUFLAG | Total packets | Discarded packets |
| A | 0 | 16 | 0 |
| B | 0 | 17 | 0 |
| C | 0 | 17 | 0 |
| D | 0 | 17 | 0 |
| Mode M0 | |||
|---|---|---|---|
| Quadrant | BADHDUFLAG | Total packets | Discarded packets |
| A | 0 | 14063 | 2 |
| B | 0 | 14699 | 2 |
| C | 0 | 14069 | 2 |
| D | 0 | 40509 | 10 |
| Mode SS | |||
|---|---|---|---|
| Quadrant | BADHDUFLAG | Total packets | Discarded packets |
| A | 0 | 134 | 0 |
| B | 0 | 134 | 0 |
| C | 0 | 134 | 0 |
| D | 0 | 134 | 0 |
| Quadrant | Total seconds | Saturated seconds | Saturation percentage |
|---|---|---|---|
| A | 6508 | 91 | 1.398279% |
| B | 6508 | 106 | 1.628765% |
| C | 6508 | 139 | 2.135833% |
| D | 6507 | 4192 | 64.422929% |
Noise dominated data is calculated using 1-second bins in cleaned event files. If a bin has >2000 counts, and if more than 50% of those come from <1% of pixels, then it is considered to be noise-dominated and hence unusable.
| Quadrant | # 1 sec bins | Bins with >0 counts | Bins with >2000 counts | High rate bins dominated by noise | Noise dominated (total time) | Noise dominated (detector-on time) | Marked lightcurve |
|---|---|---|---|---|---|---|---|
| A | 7653 | 6508 | 0 | 0 | 0.00% | 0.00% | 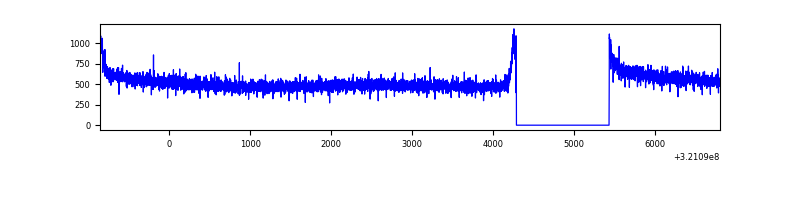 |
| B | 7653 | 6509 | 2 | 2 | 0.03% | 0.03% | 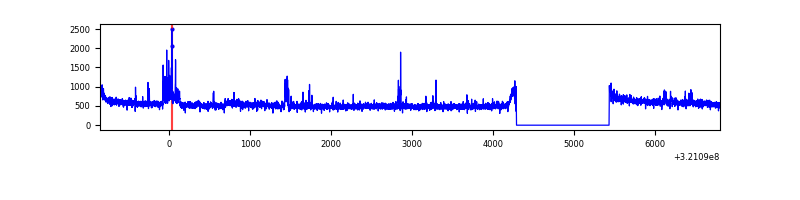 |
| C | 7653 | 6509 | 17 | 17 | 0.22% | 0.26% | 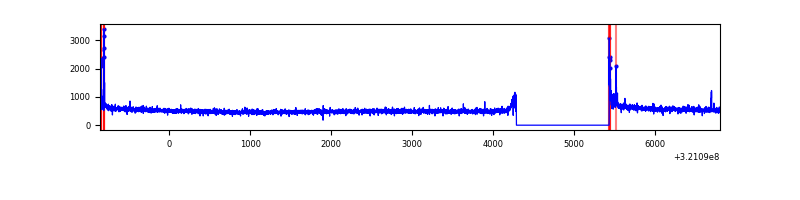 |
| D | 7652 | 6507 | 3143 | 3143 | 41.07% | 48.30% | 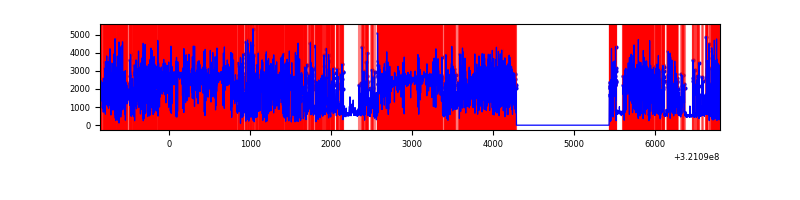 |
Top three noisy pixels from each quadrant. If the there are fewer than three noisy pixels in the level2.evt file, extra rows are filled as -1
| Pixel properties | Quadrant properties | ||||||
|---|---|---|---|---|---|---|---|
| Quadrant | DetID | PixID | Counts | Sigma | Mean | Median | Sigma |
| A | 13 | 254 | 9220 | 47.31 | 885 | 869 | 176.5 |
| A | 0 | 226 | 7653 | 38.43 | 885 | 869 | 176.5 |
| A | 3 | 137 | 7501 | 37.57 | 885 | 869 | 176.5 |
| B | 0 | 197 | 159939 | 969.04 | 874 | 852 | 164.2 |
| B | 12 | 111 | 20211 | 117.92 | 874 | 852 | 164.2 |
| B | 11 | 111 | 18207 | 105.71 | 874 | 852 | 164.2 |
| C | 14 | 238 | 134702 | 701.68 | 824 | 830 | 190.8 |
| C | 0 | 10 | 85013 | 441.24 | 824 | 830 | 190.8 |
| C | 13 | 61 | 5549 | 24.73 | 824 | 830 | 190.8 |
| D | 12 | 218 | 9118609 | 70533.75 | 529 | 513 | 129.3 |
| D | 12 | 250 | 485852 | 3754.38 | 529 | 513 | 129.3 |
| D | 12 | 202 | 174550 | 1346.28 | 529 | 513 | 129.3 |
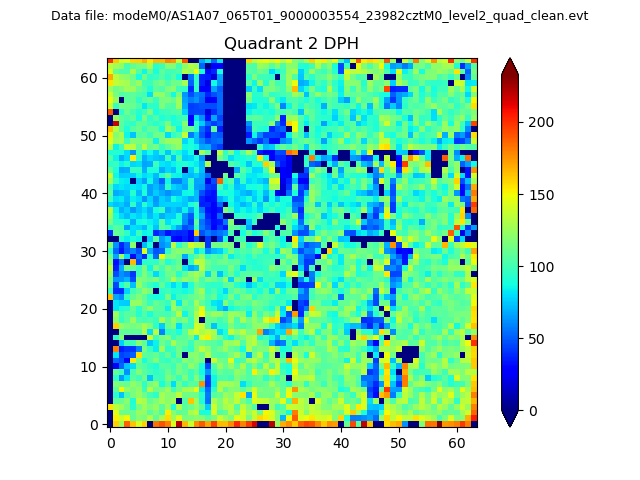
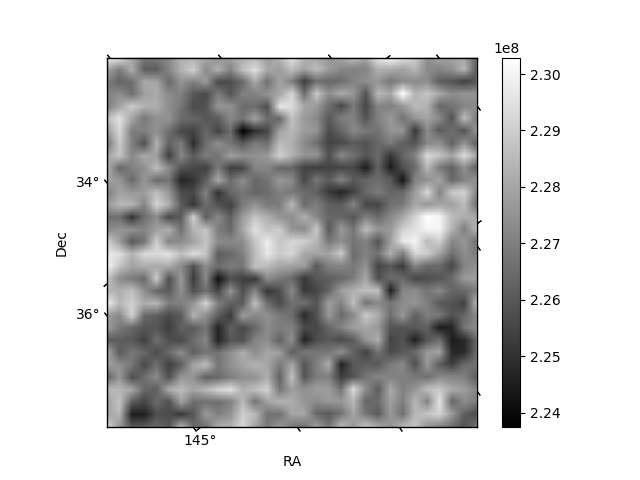
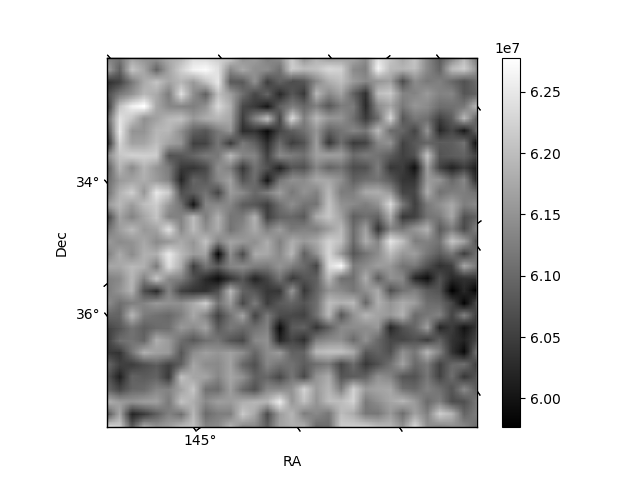
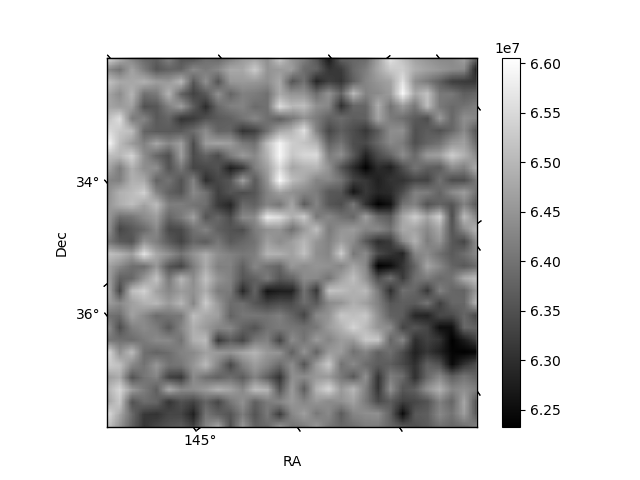
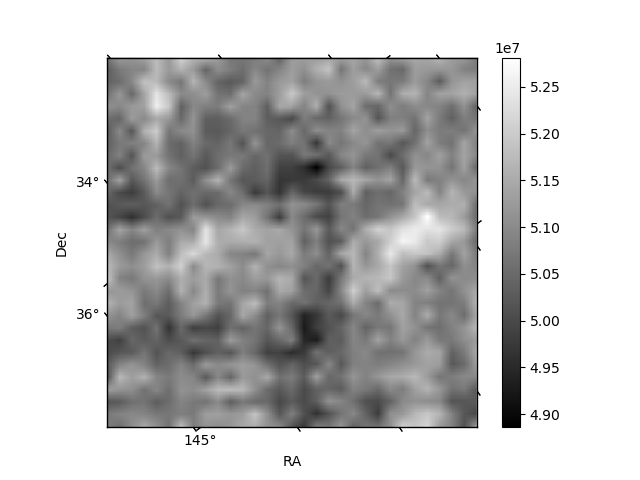
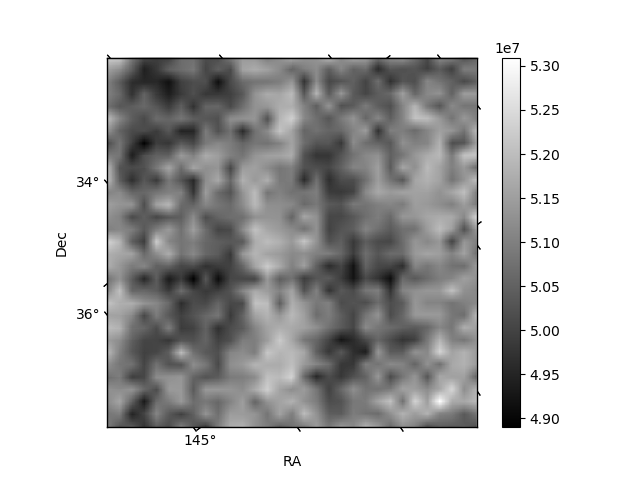
Histogram calculated using DETX and DETY for each event in the final _common_clean file
| Quadrant A | 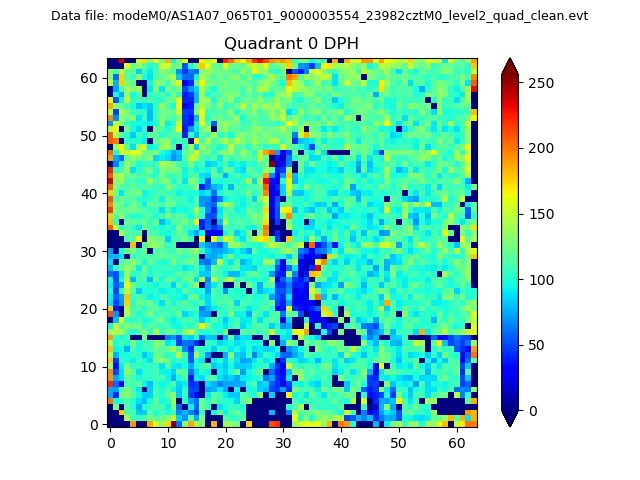 |
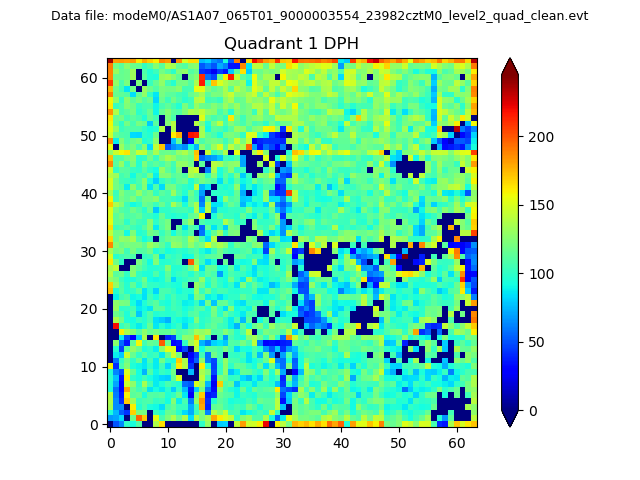 |
Quadrant B |
|---|---|---|---|
| Quadrant D | 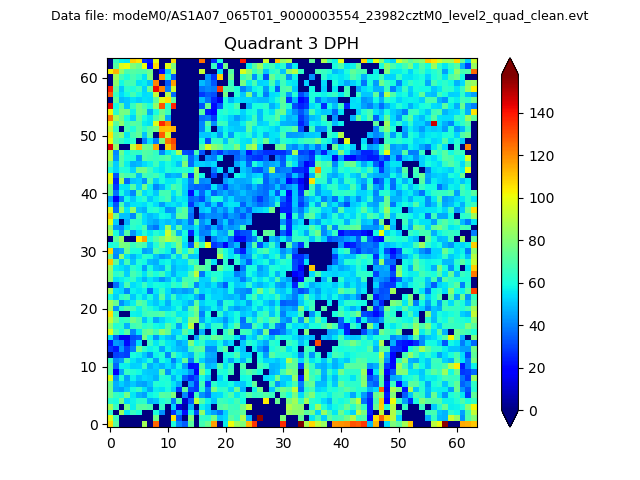 |
 |
Quadrant C |
| Plot type | Count rate plots | Images |
|---|---|---|
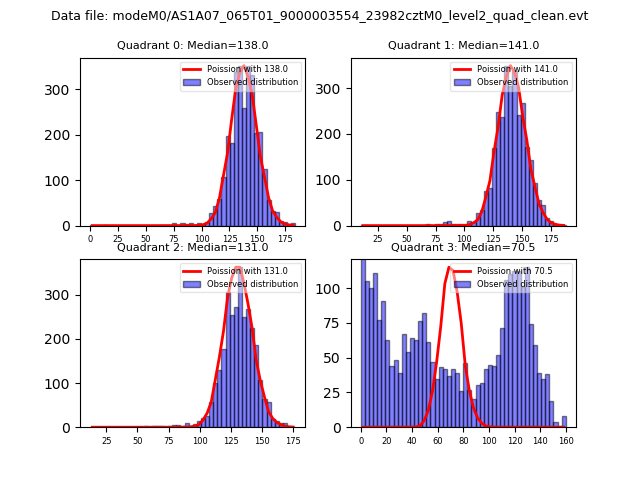
| Comparison with Poisson distribution Blue bars denote a histogram of data divided into 1 sec bins. Red curve is a Poisson curve with rate = median count rate of data. |
 |
 |
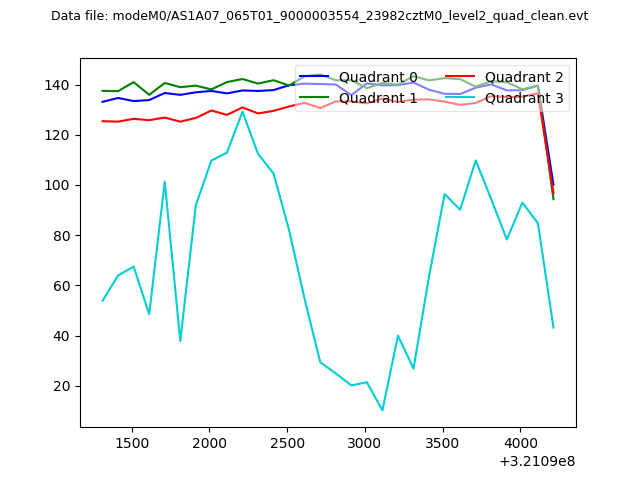
| Quadrant-wise count rates Data is divided into 100 sec bins |
 |
|
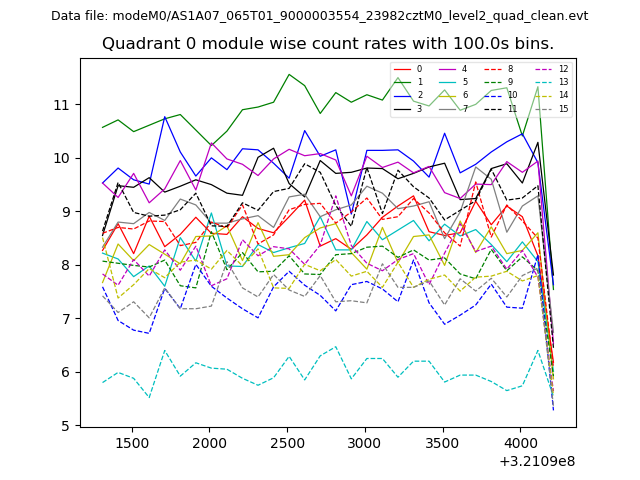
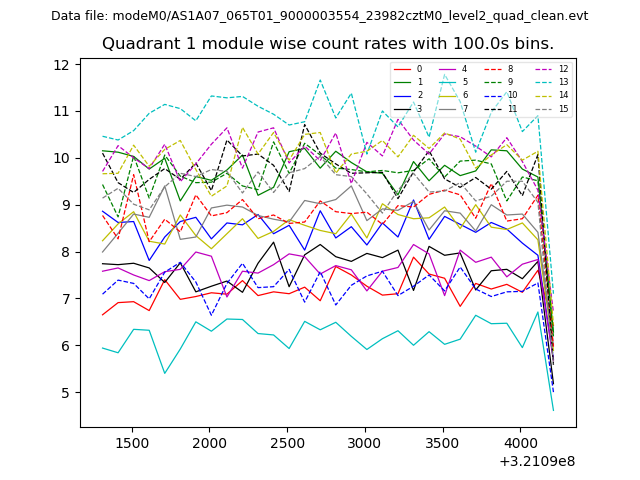
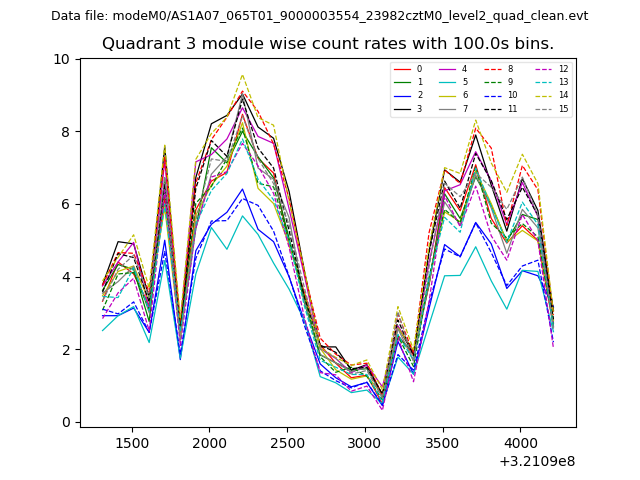
| Module-wise count rates for Quadrant A Data is divided into 100 sec bins |
 |
 |
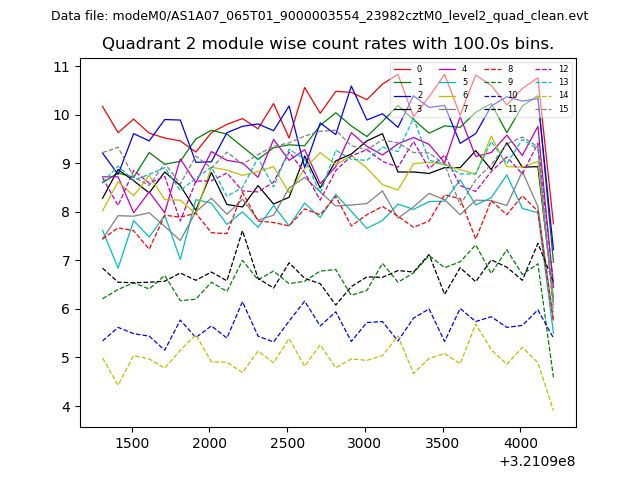
| Module-wise count rates for Quadrant B Data is divided into 100 sec bins |
 |
 |
| Module-wise count rates for Quadrant C Data is divided into 100 sec bins |
 |
 |
| Module-wise count rates for Quadrant D Data is divided into 100 sec bins |
 |
 |
| Parameter | Plot |
|---|---|
| CZT HV Monitor | 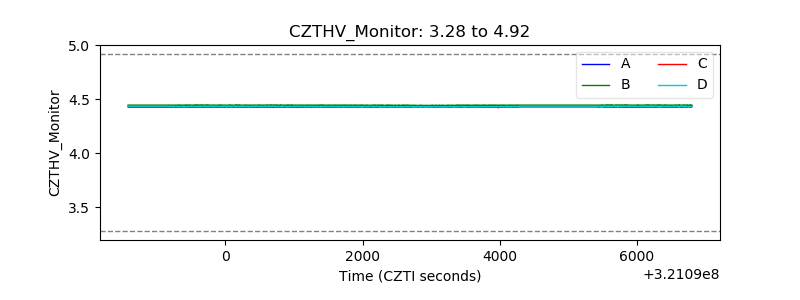 |
| D_VDD | 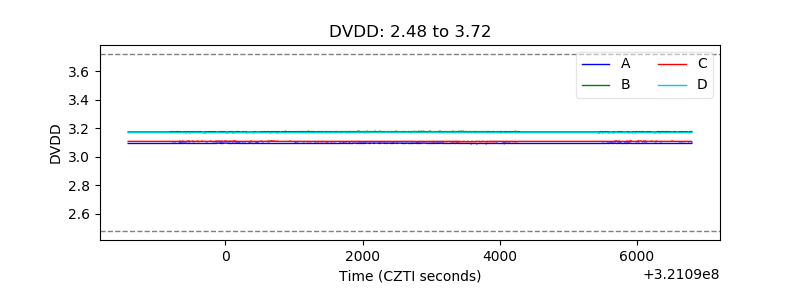 |
| Temperature 1 | 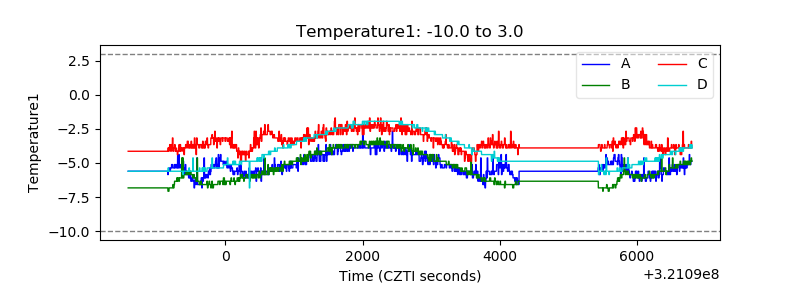 |
| Veto HV Monitor | 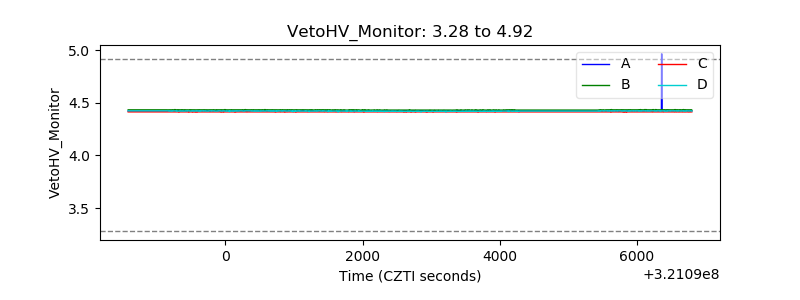 |
| Veto LLD | 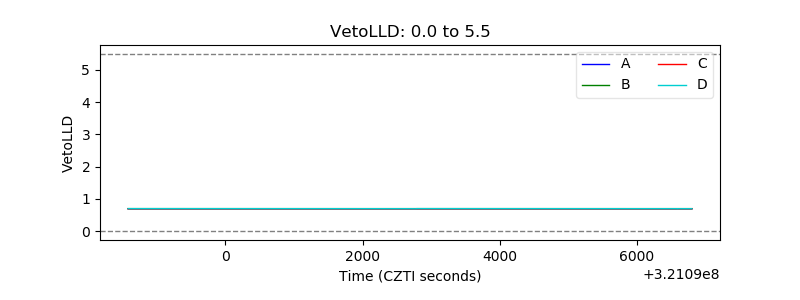 |
| Alpha Counter | 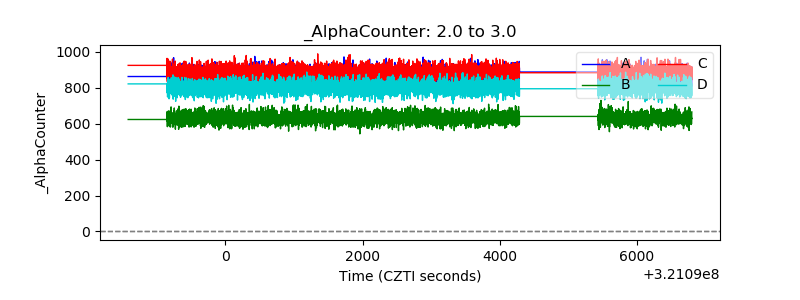 |
| _CPM_Rate | 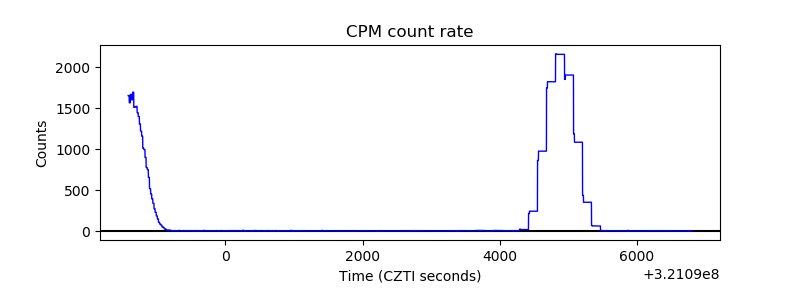 |
| CZT Counter | 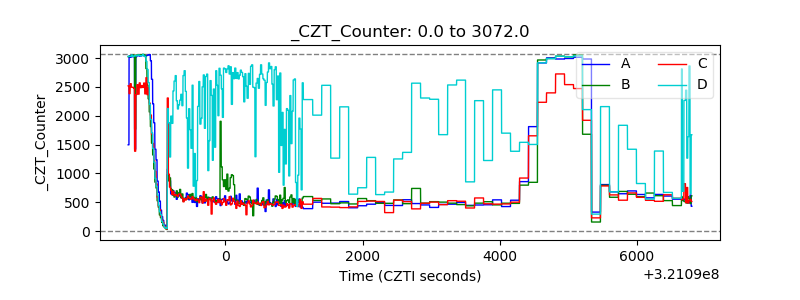 |
| +2.5 Volts monitor | 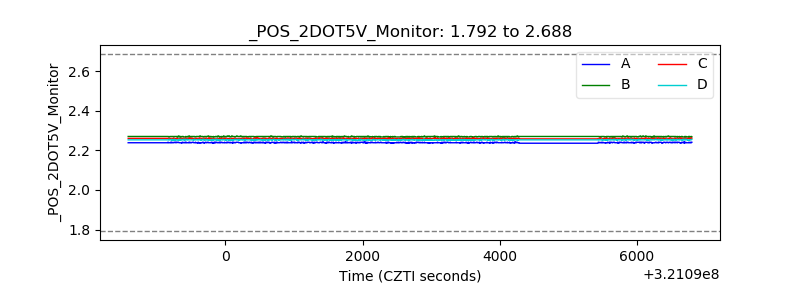 |
| +5 Volts monitor |  |
| _ROLL_ROT | 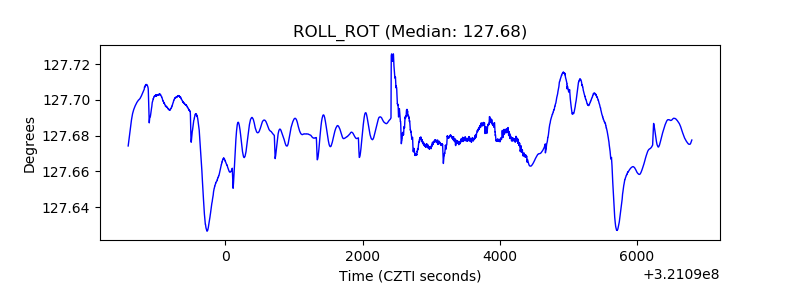 |
| _Roll_DEC | 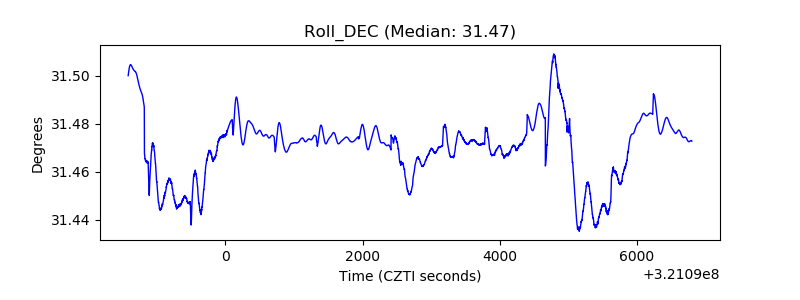 |
| _Roll_RA | 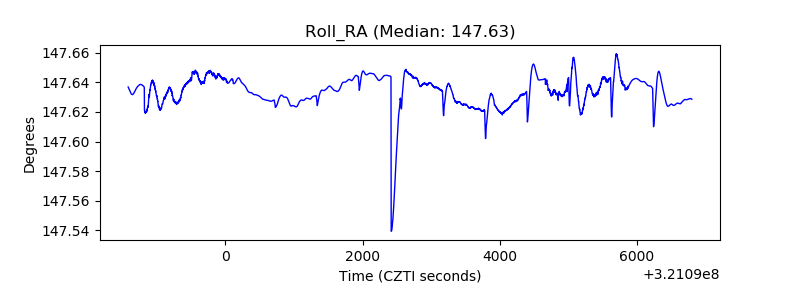 |
| Veto Counter | 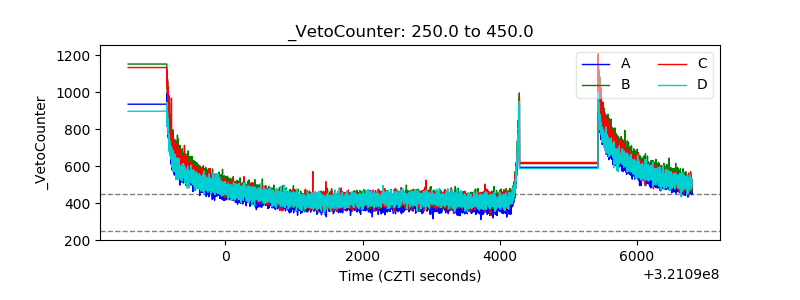 |