| Param | Original file | Final file |
|---|---|---|
| Filename | modeM0/AS1A07_065T01_9000003554_23983cztM0_level2.evt | modeM0/AS1A07_065T01_9000003554_23983cztM0_level2_quad_clean.evt |
| Size (bytes) | 340,574,400 | 42,359,040 |
| Size | 324.8 MB | 40.4 MB |
| Events in quadrant A | 1,933,279 | 269,779 |
| Events in quadrant B | 1,978,089 | 276,194 |
| Events in quadrant C | 1,993,150 | 252,302 |
| Events in quadrant D | 4,164,524 | 229,375 |
| Mode M9 | |||
|---|---|---|---|
| Quadrant | BADHDUFLAG | Total packets | Discarded packets |
| A | 0 | 11 | 0 |
| B | 0 | 11 | 0 |
| C | 0 | 11 | 0 |
| D | 0 | 11 | 0 |
| Mode M0 | |||
|---|---|---|---|
| Quadrant | BADHDUFLAG | Total packets | Discarded packets |
| A | 0 | 7838 | 1 |
| B | 0 | 8060 | 1 |
| C | 0 | 7995 | 1 |
| D | 0 | 14812 | 1 |
| Mode SS | |||
|---|---|---|---|
| Quadrant | BADHDUFLAG | Total packets | Discarded packets |
| A | 0 | 76 | 0 |
| B | 0 | 76 | 0 |
| C | 0 | 76 | 0 |
| D | 0 | 76 | 0 |
| Quadrant | Total seconds | Saturated seconds | Saturation percentage |
|---|---|---|---|
| A | 3586 | 39 | 1.087563% |
| B | 3586 | 35 | 0.976018% |
| C | 3587 | 58 | 1.616950% |
| D | 3587 | 939 | 26.177865% |
Noise dominated data is calculated using 1-second bins in cleaned event files. If a bin has >2000 counts, and if more than 50% of those come from <1% of pixels, then it is considered to be noise-dominated and hence unusable.
| Quadrant | # 1 sec bins | Bins with >0 counts | Bins with >2000 counts | High rate bins dominated by noise | Noise dominated (total time) | Noise dominated (detector-on time) | Marked lightcurve |
|---|---|---|---|---|---|---|---|
| A | 4731 | 3586 | 0 | 0 | 0.00% | 0.00% | 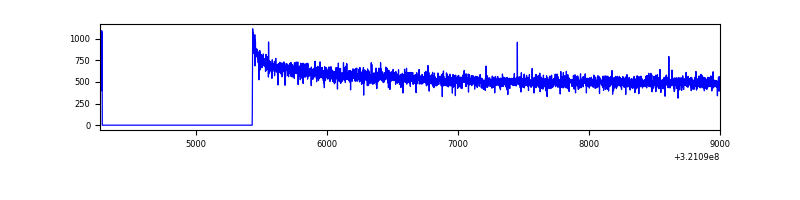 |
| B | 4731 | 3587 | 0 | 0 | 0.00% | 0.00% | 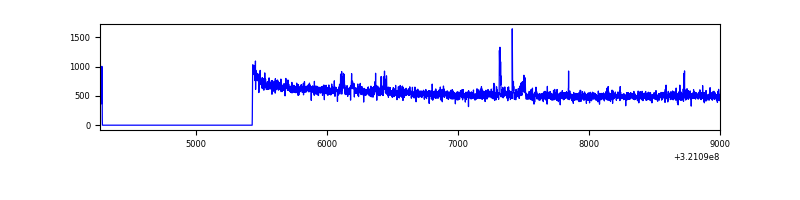 |
| C | 4732 | 3588 | 6 | 6 | 0.13% | 0.17% | 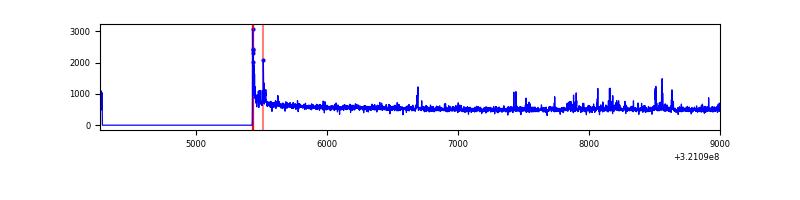 |
| D | 4732 | 3587 | 603 | 603 | 12.74% | 16.81% | 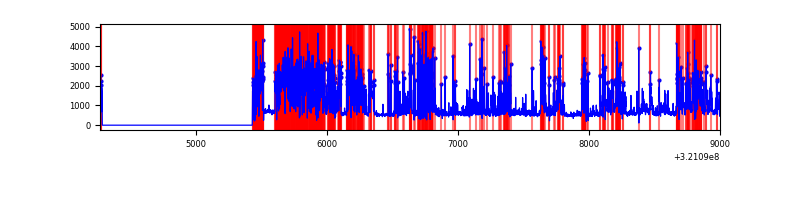 |
Top three noisy pixels from each quadrant. If the there are fewer than three noisy pixels in the level2.evt file, extra rows are filled as -1
| Pixel properties | Quadrant properties | ||||||
|---|---|---|---|---|---|---|---|
| Quadrant | DetID | PixID | Counts | Sigma | Mean | Median | Sigma |
| A | 13 | 254 | 4611 | 41.18 | 501 | 493 | 100.0 |
| A | 0 | 226 | 4414 | 39.21 | 501 | 493 | 100.0 |
| A | 3 | 137 | 3965 | 34.72 | 501 | 493 | 100.0 |
| B | 0 | 197 | 21755 | 228.05 | 493 | 482 | 93.3 |
| B | 0 | 230 | 13237 | 136.73 | 493 | 482 | 93.3 |
| B | 10 | 247 | 10772 | 110.31 | 493 | 482 | 93.3 |
| C | 0 | 10 | 110856 | 1028.87 | 463 | 467 | 107.3 |
| C | 14 | 238 | 76558 | 709.2 | 463 | 467 | 107.3 |
| C | 13 | 61 | 3193 | 25.41 | 463 | 467 | 107.3 |
| D | 12 | 218 | 2064866 | 20215.74 | 412 | 400 | 102.1 |
| D | 8 | 195 | 133777 | 1306.06 | 412 | 400 | 102.1 |
| D | 12 | 250 | 127587 | 1245.45 | 412 | 400 | 102.1 |
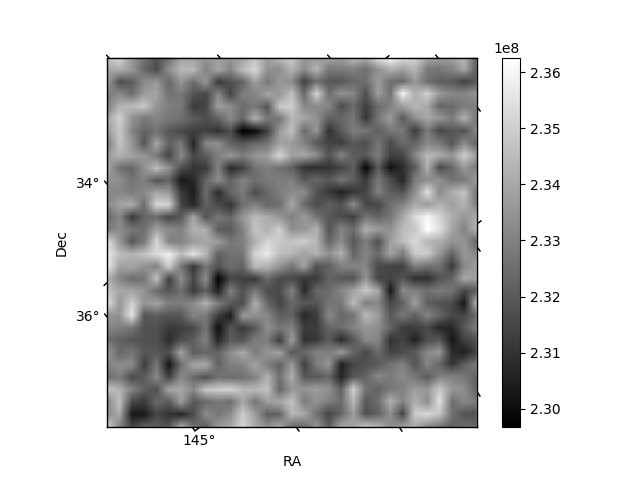
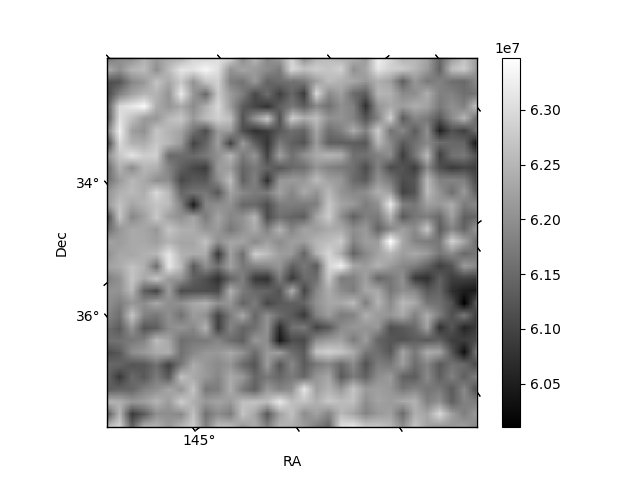
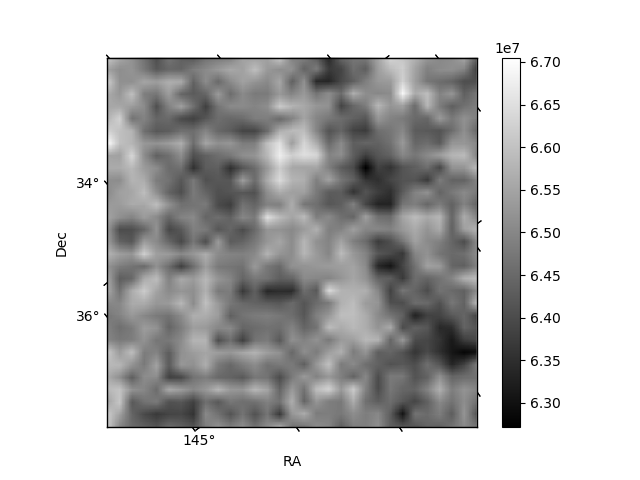
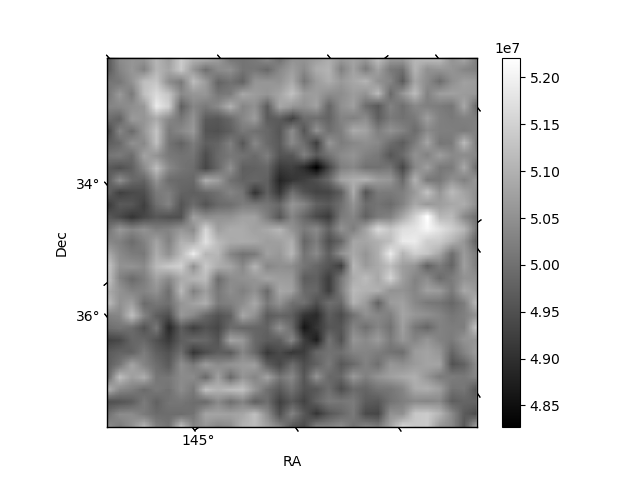
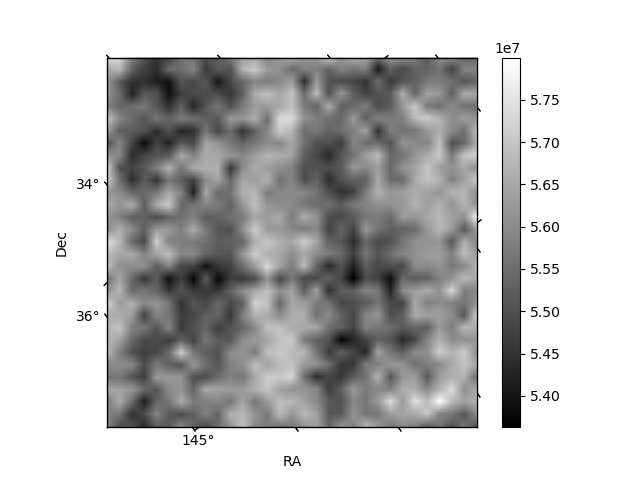
Histogram calculated using DETX and DETY for each event in the final _common_clean file
| Quadrant A | 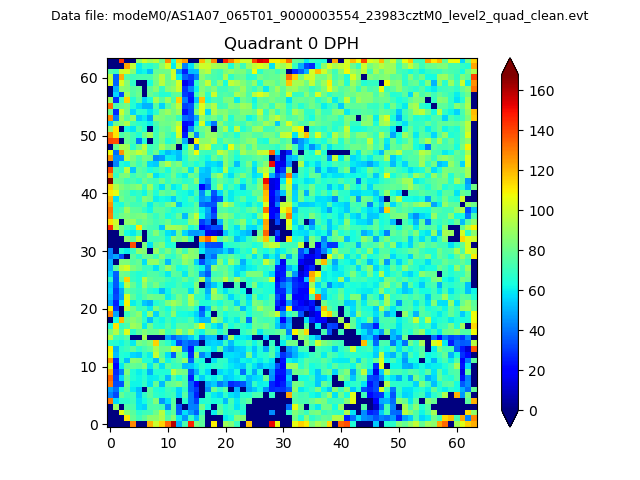 |
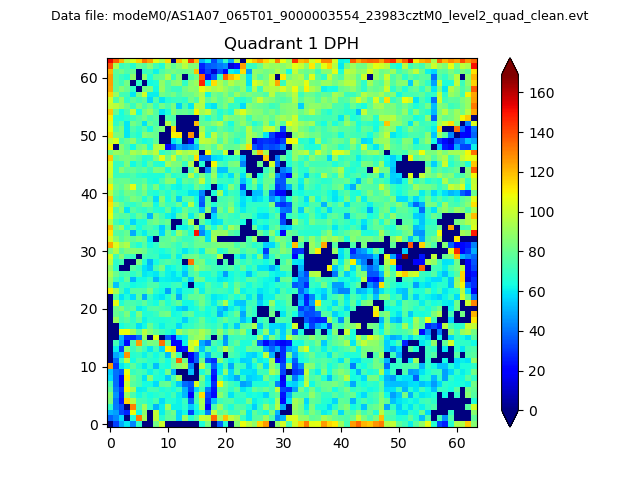 |
Quadrant B |
|---|---|---|---|
| Quadrant D | 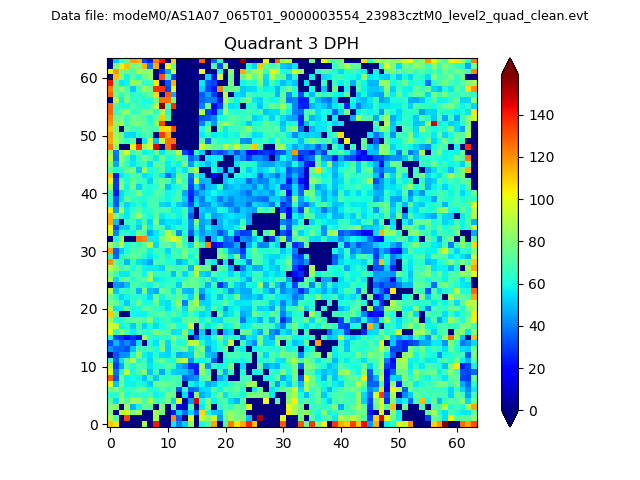 |
 |
Quadrant C |
| Plot type | Count rate plots | Images |
|---|---|---|
| Comparison with Poisson distribution Blue bars denote a histogram of data divided into 1 sec bins. Red curve is a Poisson curve with rate = median count rate of data. |
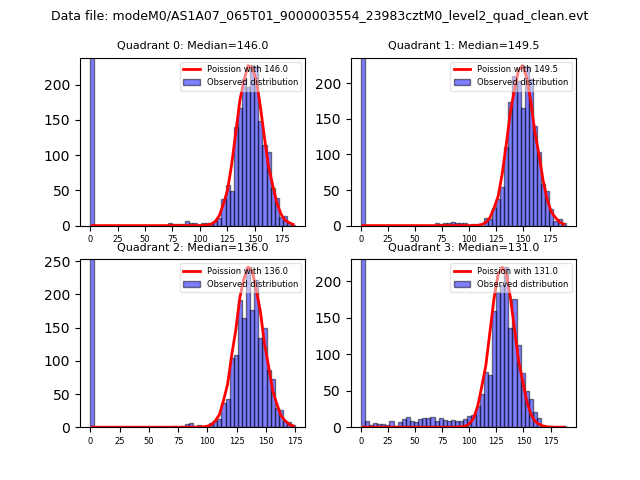 |
 |
| Quadrant-wise count rates Data is divided into 100 sec bins |
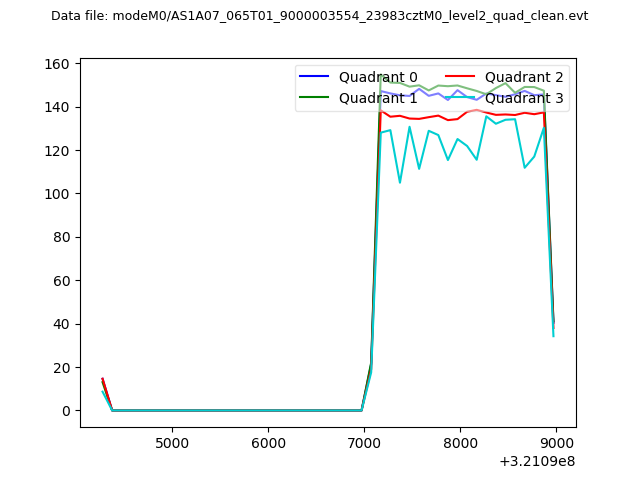 |
|
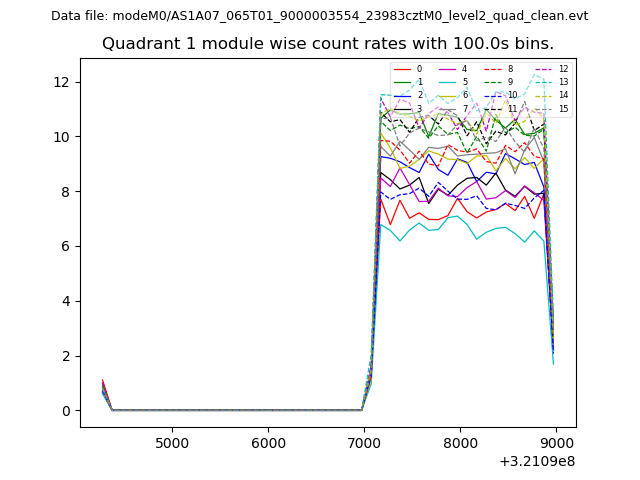
| Module-wise count rates for Quadrant A Data is divided into 100 sec bins |
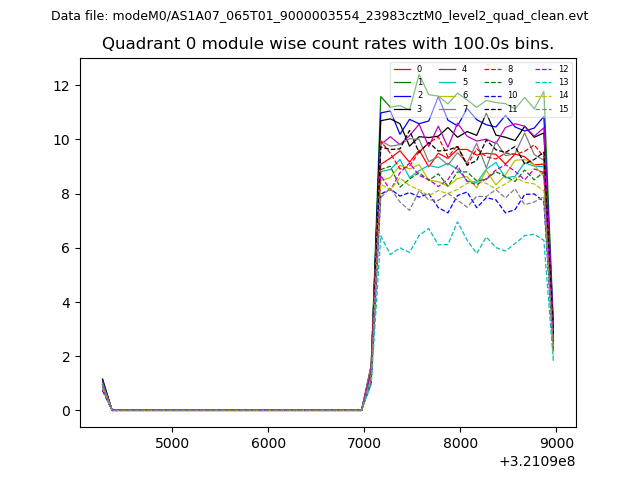 |
 |
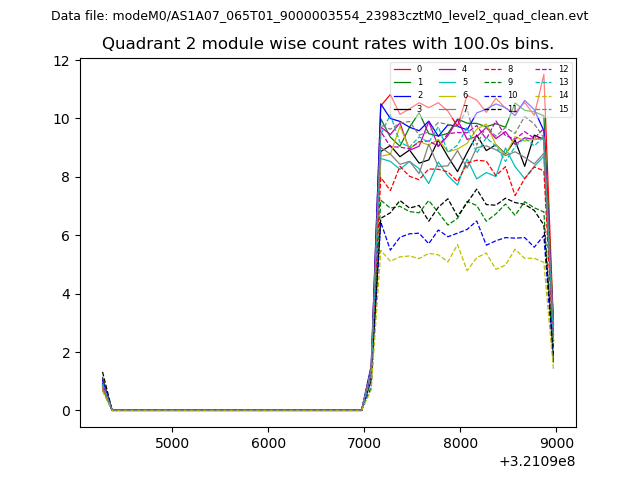
| Module-wise count rates for Quadrant B Data is divided into 100 sec bins |
 |
 |
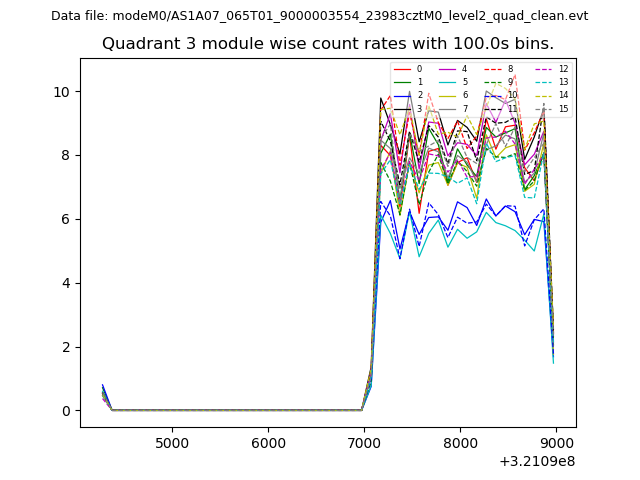
| Module-wise count rates for Quadrant C Data is divided into 100 sec bins |
 |
 |
| Module-wise count rates for Quadrant D Data is divided into 100 sec bins |
 |
 |
| Parameter | Plot |
|---|---|
| CZT HV Monitor | 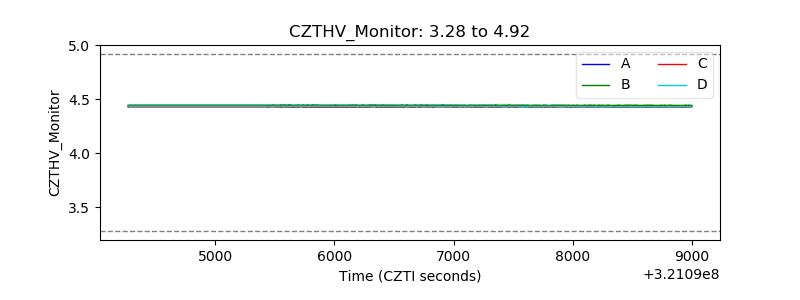 |
| D_VDD | 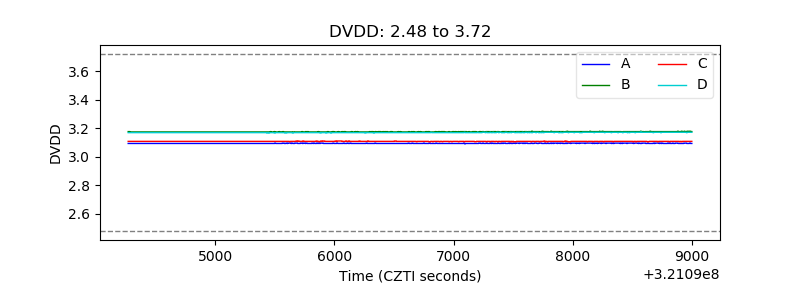 |
| Temperature 1 | 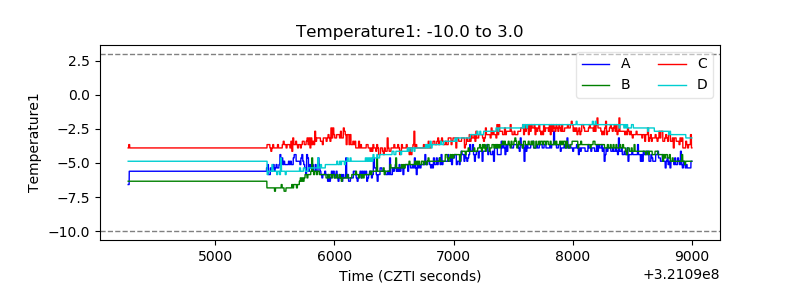 |
| Veto HV Monitor | 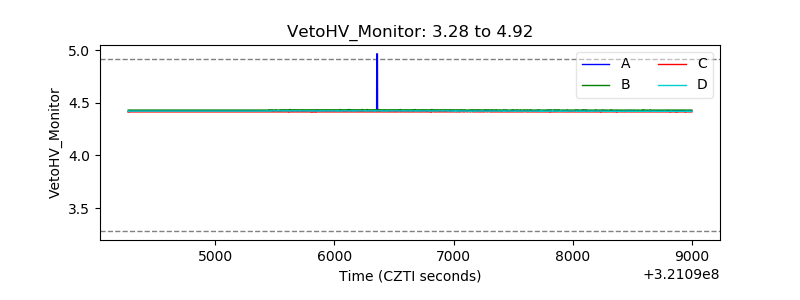 |
| Veto LLD | 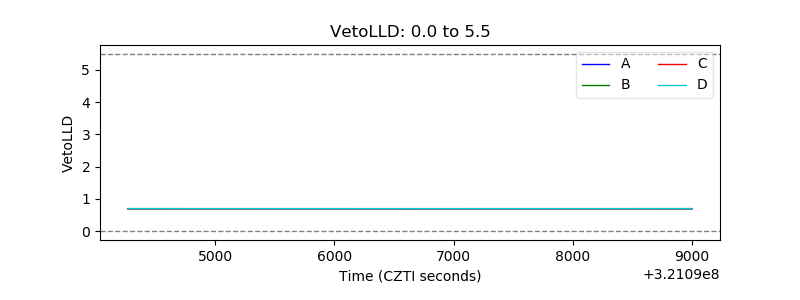 |
| Alpha Counter | 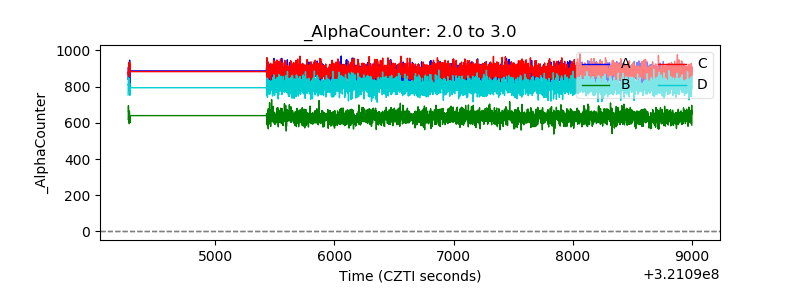 |
| _CPM_Rate | 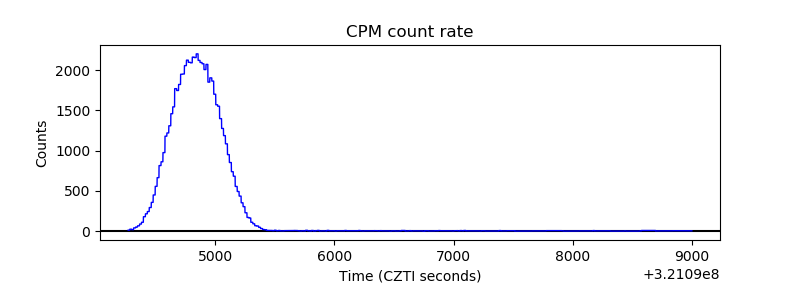 |
| CZT Counter | 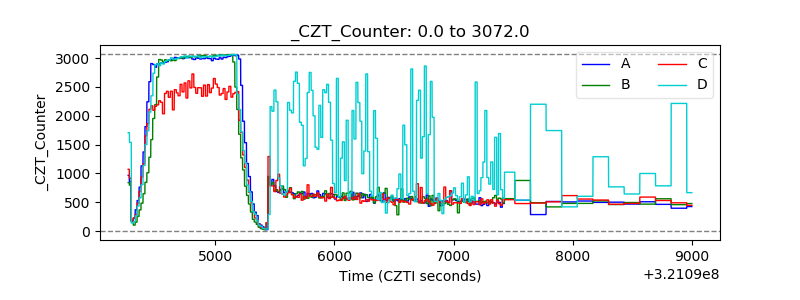 |
| +2.5 Volts monitor |  |
| +5 Volts monitor | 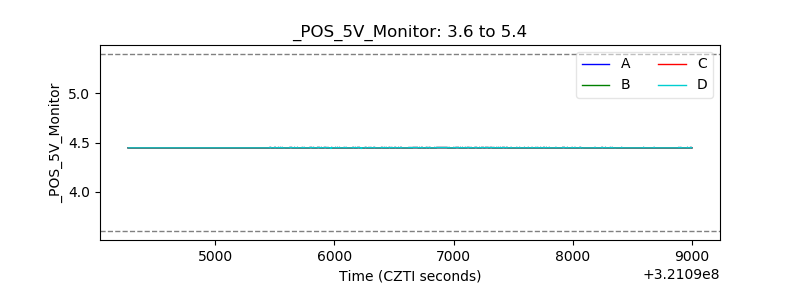 |
| _ROLL_ROT | 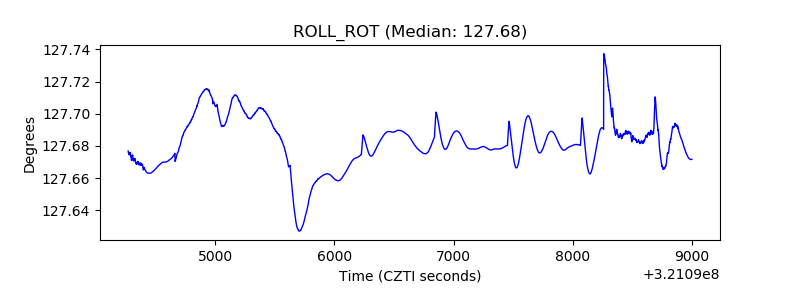 |
| _Roll_DEC | 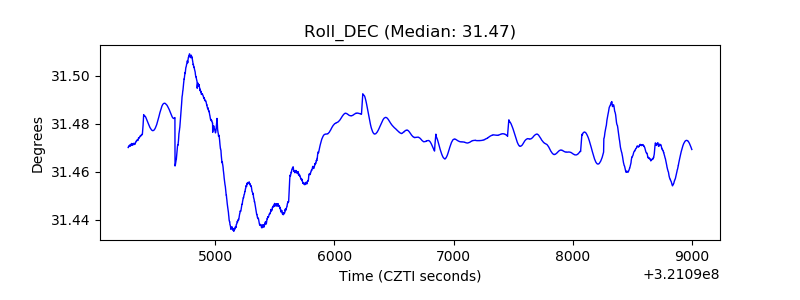 |
| _Roll_RA | 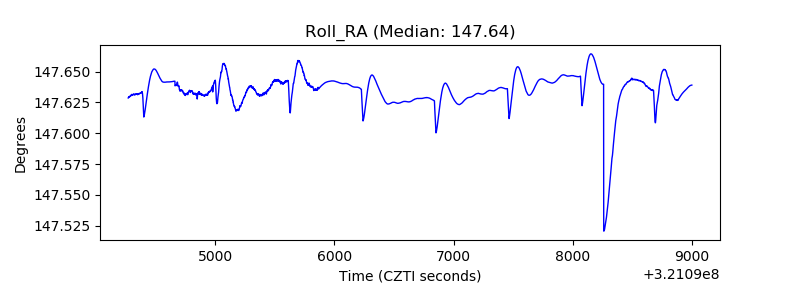 |
| Veto Counter | 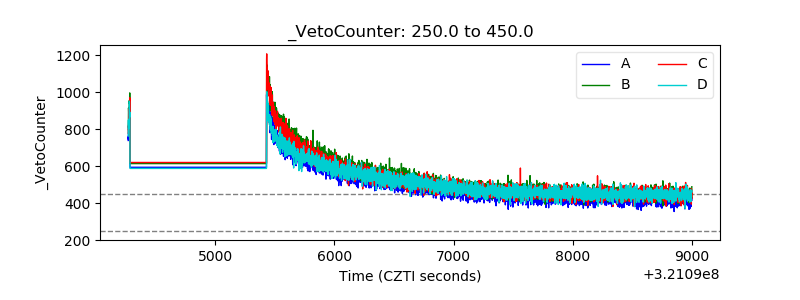 |