| Param | Original file | Final file |
|---|---|---|
| Filename | modeM0/AS1A07_165T01_9000003558cztM0_level2.fits | modeM0/AS1A07_165T01_9000003558cztM0_level2_quad_clean.evt |
| Size (bytes) | 4,746,404,160 | 5,998,273,920 |
| Size | 4.4 GB | 5.6 GB |
| Events in quadrant A | 29,816,476 | 39,372,860 |
| Events in quadrant B | 28,317,480 | 39,500,262 |
| Events in quadrant C | 28,615,428 | 37,355,624 |
| Events in quadrant D | 24,368,812 | 32,835,867 |
| Mode M9 | |||
|---|---|---|---|
| Quadrant | BADHDUFLAG | Total packets | Discarded packets |
| A | 0 | 766 | 0 |
| B | 0 | 766 | 0 |
| C | 0 | 766 | 0 |
| D | 0 | 766 | 0 |
| Mode M0 | |||
|---|---|---|---|
| Quadrant | BADHDUFLAG | Total packets | Discarded packets |
| A | 0 | 993321 | 0 |
| B | 0 | 1030436 | 0 |
| C | 0 | 1036386 | 0 |
| D | 0 | 1391527 | 0 |
| Mode SS | |||
|---|---|---|---|
| Quadrant | BADHDUFLAG | Total packets | Discarded packets |
| A | 0 | 9616 | 0 |
| B | 0 | 9616 | 0 |
| C | 0 | 9616 | 0 |
| D | 0 | 9616 | 0 |
| Quadrant | Total seconds | Saturated seconds | Saturation percentage |
|---|---|---|---|
| A | 476635 | 4415 | 0.926285% |
| B | 476635 | 6195 | 1.299737% |
| C | 476635 | 9037 | 1.896000% |
| D | 476635 | 32191 | 6.753805% |
Noise dominated data is calculated using 1-second bins in cleaned event files. If a bin has >2000 counts, and if more than 50% of those come from <1% of pixels, then it is considered to be noise-dominated and hence unusable.
| Quadrant | # 1 sec bins | Bins with >0 counts | Bins with >2000 counts | High rate bins dominated by noise | Noise dominated (total time) | Noise dominated (detector-on time) | Marked lightcurve |
|---|---|---|---|---|---|---|---|
| A | 553034 | 476627 | 0 | 0 | 0.00% | 0.00% |  |
| B | 553034 | 476622 | 0 | 0 | 0.00% | 0.00% |  |
| C | 553034 | 476611 | 0 | 0 | 0.00% | 0.00% | 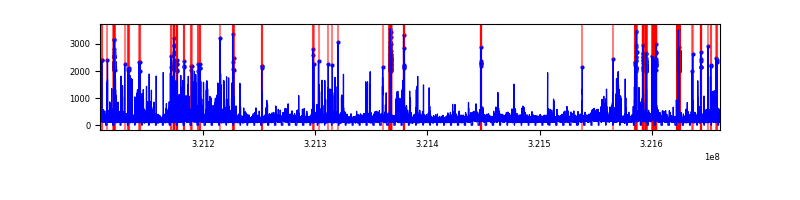 |
| D | 553034 | 475793 | 0 | 0 | 0.00% | 0.00% |  |
Top three noisy pixels from each quadrant. If the there are fewer than three noisy pixels in the level2.evt file, extra rows are filled as -1
| Pixel properties | Quadrant properties | ||||||
|---|---|---|---|---|---|---|---|
| Quadrant | DetID | PixID | Counts | Sigma | Mean | Median | Sigma |
| A | 0 | 29 | 28343 | 11.13 | 7774 | 7334 | 1887.5 |
| A | 7 | 110 | 23969 | 8.81 | 7774 | 7334 | 1887.5 |
| A | 9 | 19 | 22288 | 7.92 | 7774 | 7334 | 1887.5 |
| B | 2 | 9 | 22570 | 10.76 | 7508 | 7221 | 1426.5 |
| B | 2 | 8 | 18988 | 8.25 | 7508 | 7221 | 1426.5 |
| B | 3 | 80 | 18916 | 8.2 | 7508 | 7221 | 1426.5 |
| C | 12 | 241 | 19953 | 6.76 | 7569 | 7138 | 1895.4 |
| C | 3 | 126 | 19327 | 6.43 | 7569 | 7138 | 1895.4 |
| C | 3 | 187 | 18793 | 6.15 | 7569 | 7138 | 1895.4 |
| D | 3 | 14 | 17758 | 6.24 | 6978 | 6377 | 1823.9 |
| D | 15 | 46 | 17724 | 6.22 | 6978 | 6377 | 1823.9 |
| D | 10 | 189 | 17269 | 5.97 | 6978 | 6377 | 1823.9 |
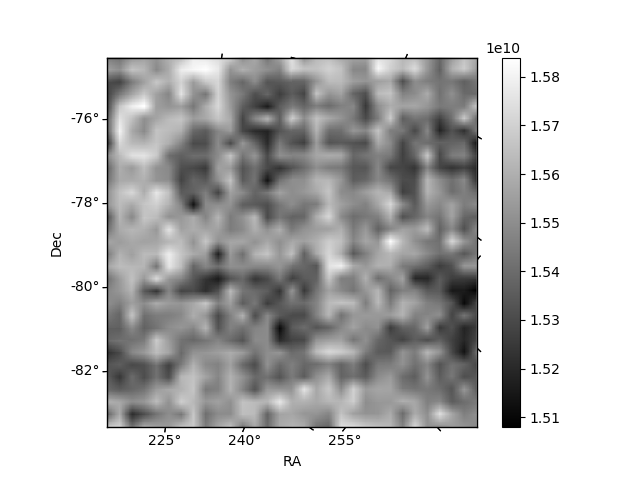
Histogram calculated using DETX and DETY for each event in the final _common_clean file
| Quadrant A | 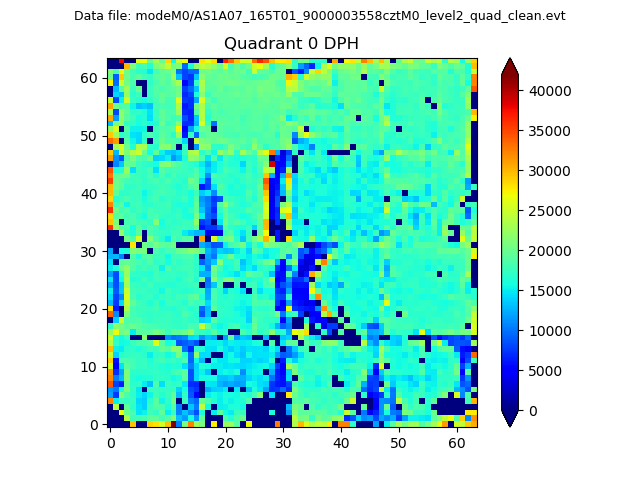 |
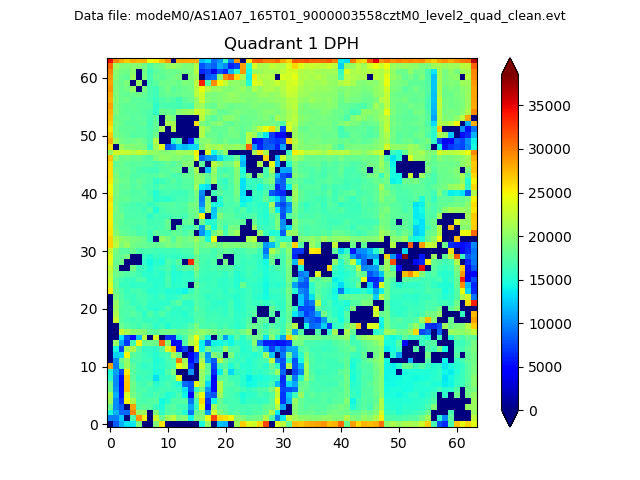 |
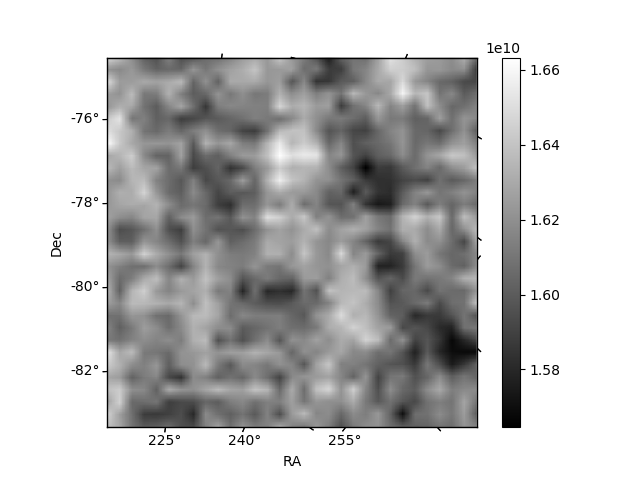
Quadrant B |
|---|---|---|---|
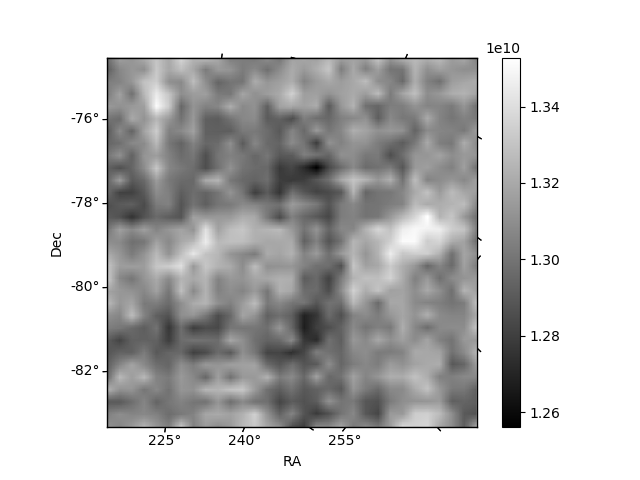
| Quadrant D | 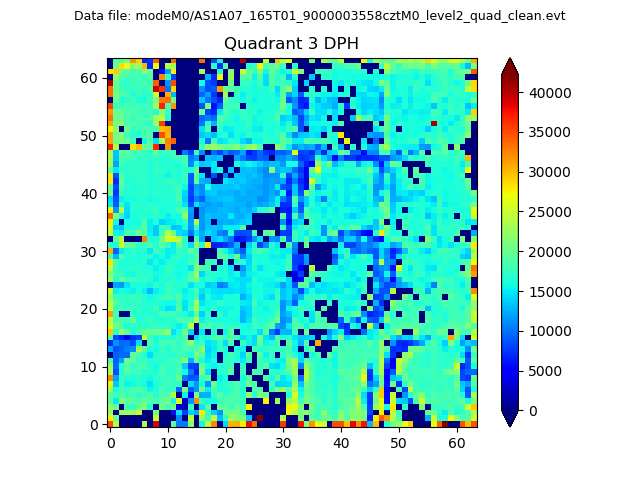 |
 |
Quadrant C |
| Plot type | Count rate plots | Images |
|---|---|---|
| Comparison with Poisson distribution Blue bars denote a histogram of data divided into 1 sec bins. Red curve is a Poisson curve with rate = median count rate of data. |
 |
 |
| Quadrant-wise count rates Data is divided into 100 sec bins |
 |
|
| Module-wise count rates for Quadrant A Data is divided into 100 sec bins |
 |
 |
| Module-wise count rates for Quadrant B Data is divided into 100 sec bins |
 |
 |
| Module-wise count rates for Quadrant C Data is divided into 100 sec bins |
 |
 |
| Module-wise count rates for Quadrant D Data is divided into 100 sec bins |
 |
 |
| Parameter | Plot |
|---|---|
| CZT HV Monitor | 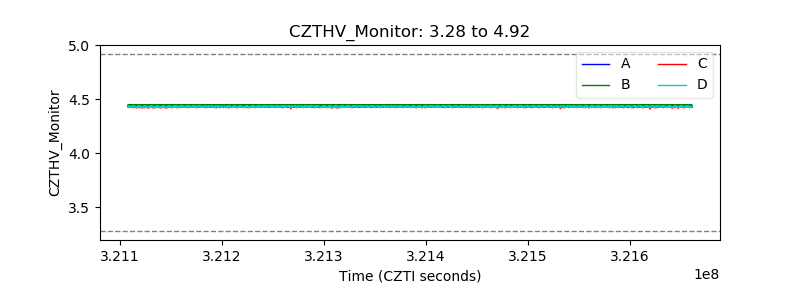 |
| D_VDD | 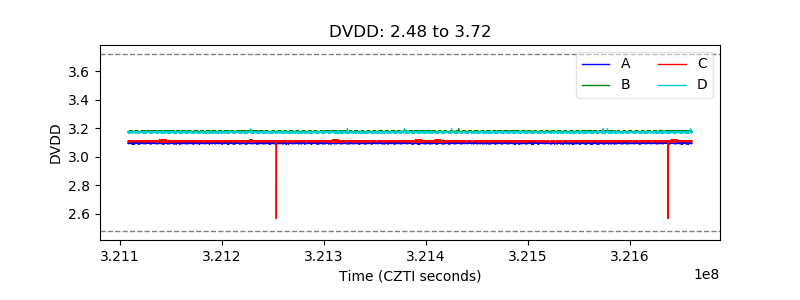 |
| Temperature 1 |  |
| Veto HV Monitor |  |
| Veto LLD | 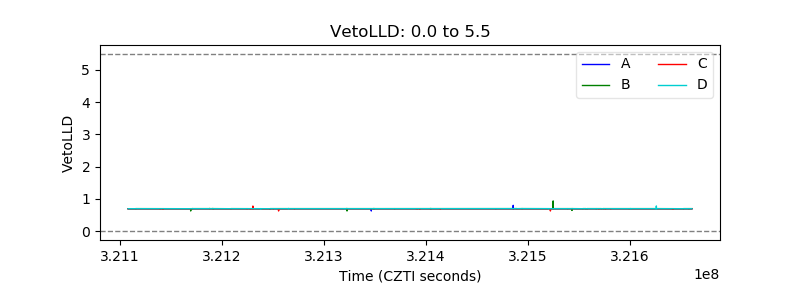 |
| Alpha Counter | 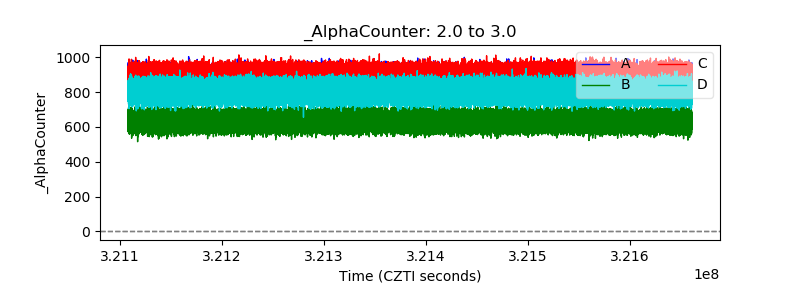 |
| _CPM_Rate |  |
| CZT Counter |  |
| +2.5 Volts monitor |  |
| +5 Volts monitor |  |
| _ROLL_ROT |  |
| _Roll_DEC | 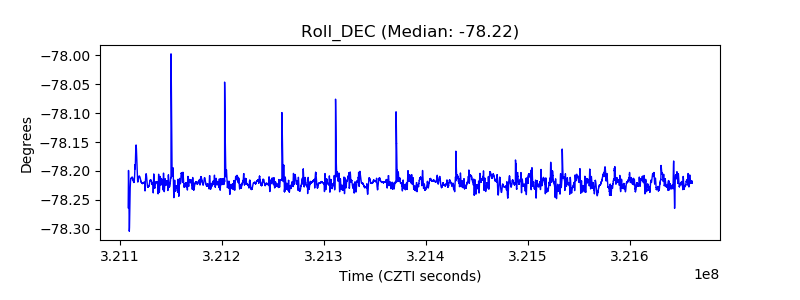 |
| _Roll_RA |  |
| Veto Counter |  |