| Param | Original file | Final file |
|---|---|---|
| Filename | modeM0/AS1A07_165T01_9000003558_23984cztM0_level2.evt | modeM0/AS1A07_165T01_9000003558_23984cztM0_level2_quad_clean.evt |
| Size (bytes) | 204,120,000 | 37,765,440 |
| Size | 194.7 MB | 36.0 MB |
| Events in quadrant A | 959,147 | 290,457 |
| Events in quadrant B | 1,011,467 | 294,544 |
| Events in quadrant C | 984,680 | 278,356 |
| Events in quadrant D | 3,115,928 | 161,913 |
| Mode M9 | |||
|---|---|---|---|
| Quadrant | BADHDUFLAG | Total packets | Discarded packets |
| A | 0 | 1 | 0 |
| B | 0 | 1 | 0 |
| C | 0 | 1 | 0 |
| D | 0 | 1 | 0 |
| Mode M0 | |||
|---|---|---|---|
| Quadrant | BADHDUFLAG | Total packets | Discarded packets |
| A | 0 | 3931 | 1 |
| B | 0 | 4128 | 1 |
| C | 0 | 3974 | 1 |
| D | 0 | 10380 | 1 |
| Mode SS | |||
|---|---|---|---|
| Quadrant | BADHDUFLAG | Total packets | Discarded packets |
| A | 0 | 32 | 0 |
| B | 0 | 32 | 0 |
| C | 0 | 32 | 0 |
| D | 0 | 32 | 0 |
| Quadrant | Total seconds | Saturated seconds | Saturation percentage |
|---|---|---|---|
| A | 1593 | 18 | 1.129944% |
| B | 1593 | 32 | 2.008788% |
| C | 1593 | 47 | 2.950408% |
| D | 1592 | 1118 | 70.226131% |
Noise dominated data is calculated using 1-second bins in cleaned event files. If a bin has >2000 counts, and if more than 50% of those come from <1% of pixels, then it is considered to be noise-dominated and hence unusable.
| Quadrant | # 1 sec bins | Bins with >0 counts | Bins with >2000 counts | High rate bins dominated by noise | Noise dominated (total time) | Noise dominated (detector-on time) | Marked lightcurve |
|---|---|---|---|---|---|---|---|
| A | 1593 | 1593 | 0 | 0 | 0.00% | 0.00% | 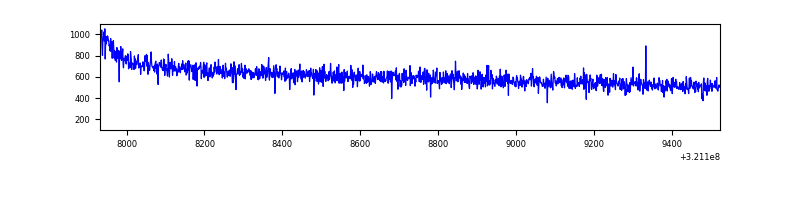 |
| B | 1593 | 1593 | 4 | 4 | 0.25% | 0.25% | 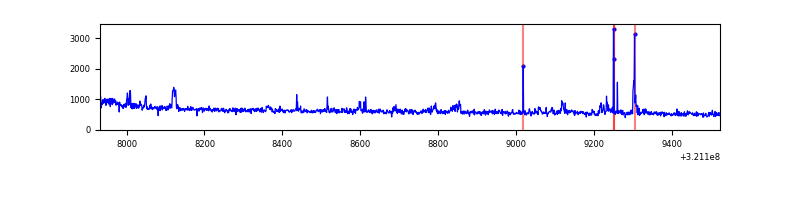 |
| C | 1593 | 1593 | 7 | 7 | 0.44% | 0.44% | 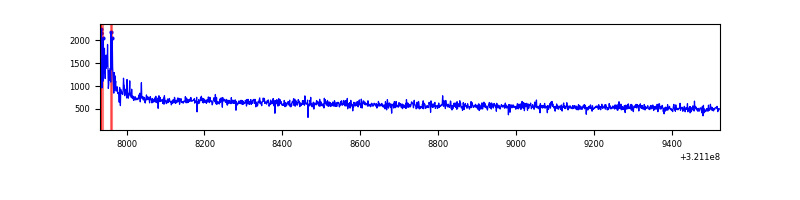 |
| D | 1592 | 1592 | 791 | 791 | 49.69% | 49.69% | 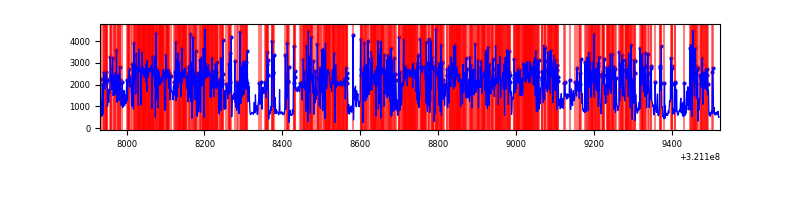 |
Top three noisy pixels from each quadrant. If the there are fewer than three noisy pixels in the level2.evt file, extra rows are filled as -1
| Pixel properties | Quadrant properties | ||||||
|---|---|---|---|---|---|---|---|
| Quadrant | DetID | PixID | Counts | Sigma | Mean | Median | Sigma |
| A | 13 | 254 | 2729 | 49.44 | 248 | 244 | 50.3 |
| A | 0 | 226 | 2237 | 39.66 | 248 | 244 | 50.3 |
| A | 12 | 194 | 1836 | 31.68 | 248 | 244 | 50.3 |
| B | 0 | 197 | 41465 | 910.18 | 242 | 238 | 45.3 |
| B | 0 | 190 | 9795 | 210.99 | 242 | 238 | 45.3 |
| B | 0 | 228 | 9252 | 199.01 | 242 | 238 | 45.3 |
| C | 0 | 10 | 42177 | 785.35 | 231 | 234 | 53.4 |
| C | 14 | 238 | 38684 | 719.95 | 231 | 234 | 53.4 |
| C | 0 | 239 | 2383 | 40.24 | 231 | 234 | 53.4 |
| D | 12 | 218 | 1810454 | 46703.97 | 154 | 150 | 38.8 |
| D | 12 | 233 | 445153 | 11480.62 | 154 | 150 | 38.8 |
| D | 12 | 250 | 107420 | 2767.46 | 154 | 150 | 38.8 |
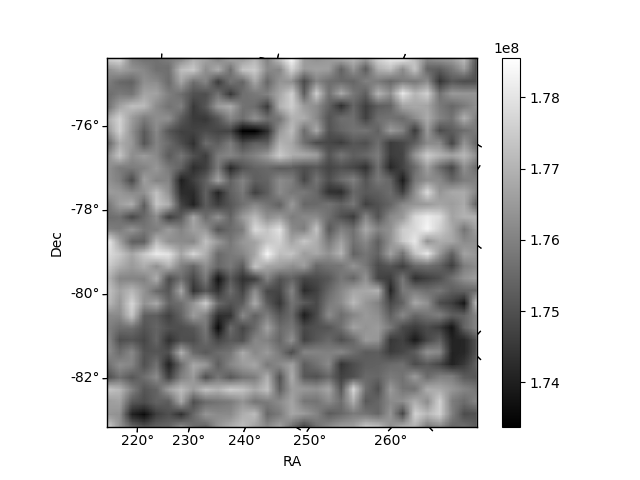
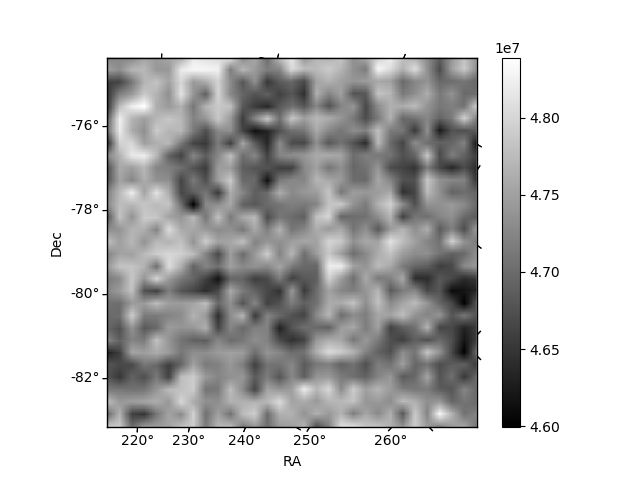
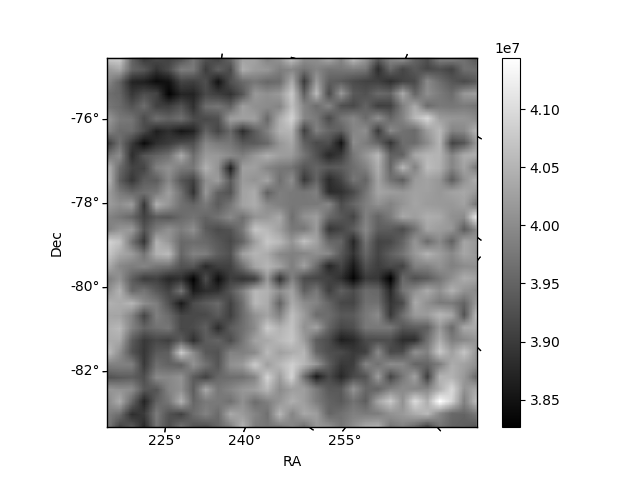
Histogram calculated using DETX and DETY for each event in the final _common_clean file
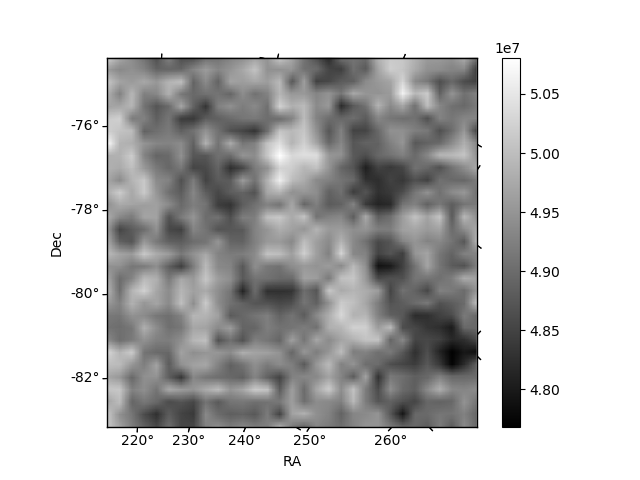
| Quadrant A | 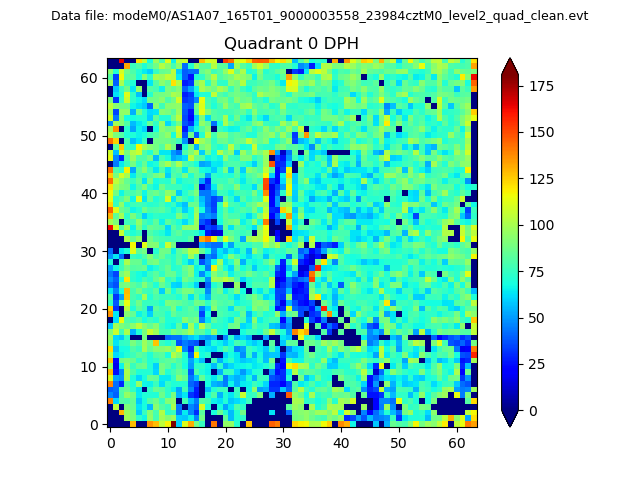 |
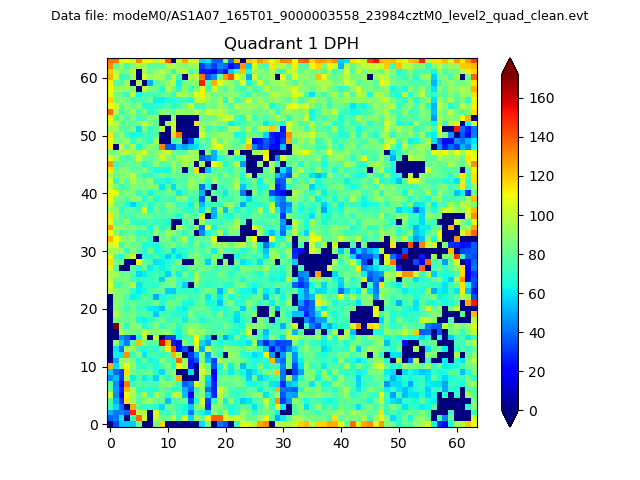 |
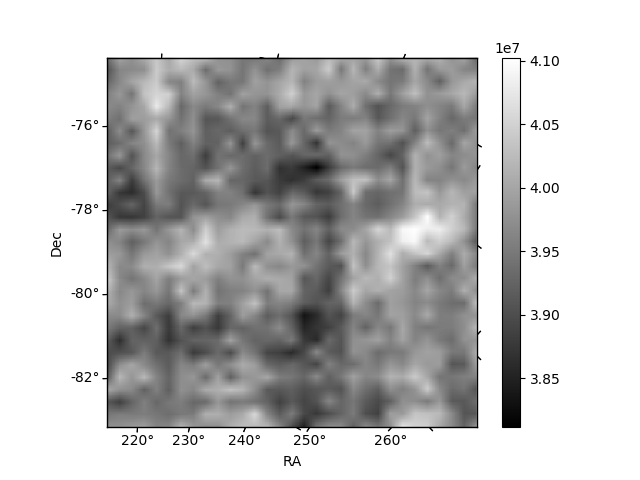
Quadrant B |
|---|---|---|---|
| Quadrant D | 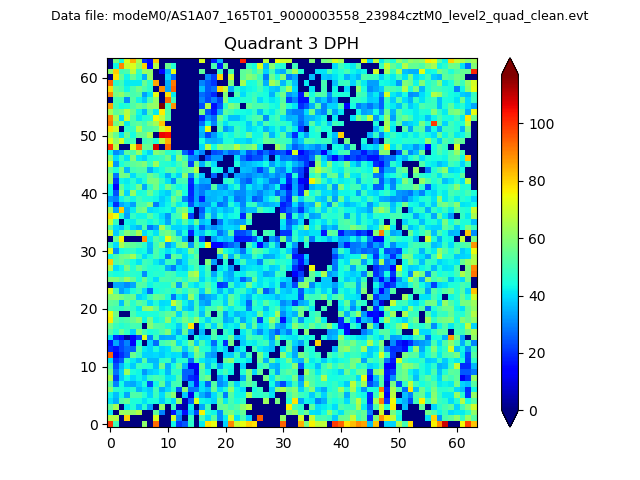 |
 |
Quadrant C |
| Plot type | Count rate plots | Images |
|---|---|---|
| Comparison with Poisson distribution Blue bars denote a histogram of data divided into 1 sec bins. Red curve is a Poisson curve with rate = median count rate of data. |
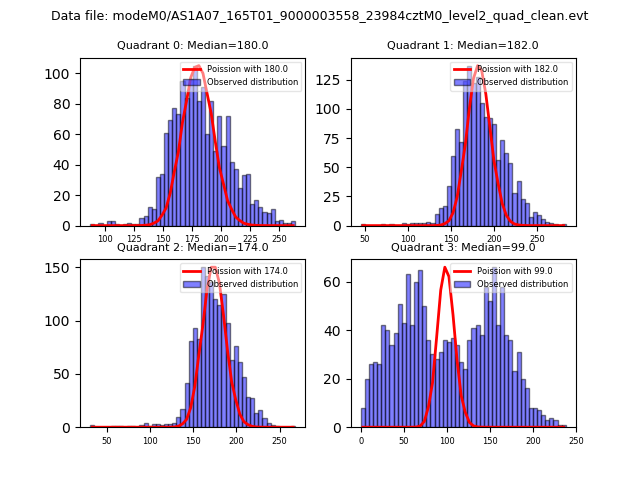 |
 |
| Quadrant-wise count rates Data is divided into 100 sec bins |
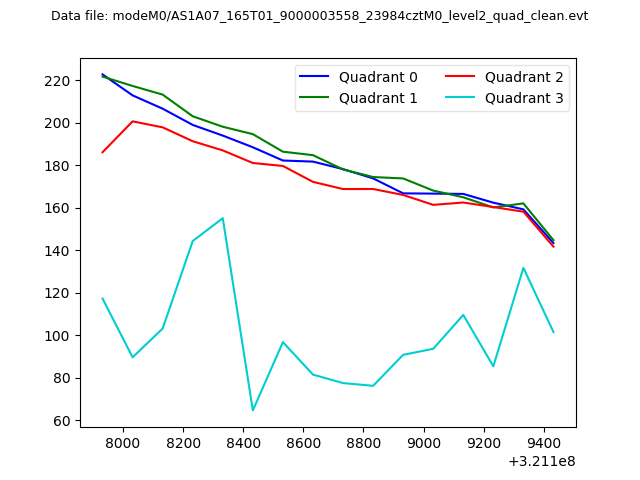 |
|
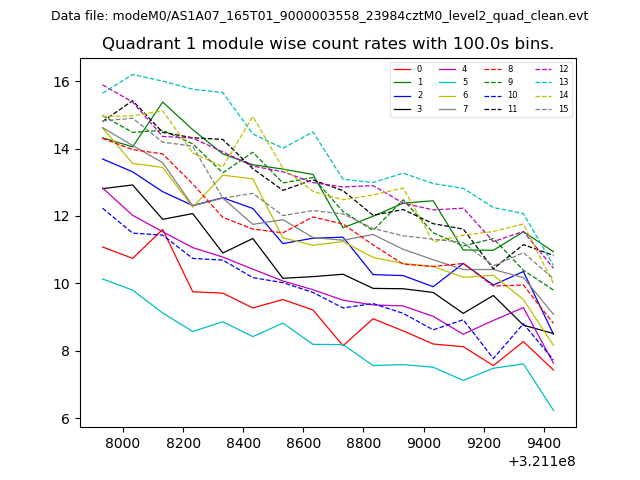
| Module-wise count rates for Quadrant A Data is divided into 100 sec bins |
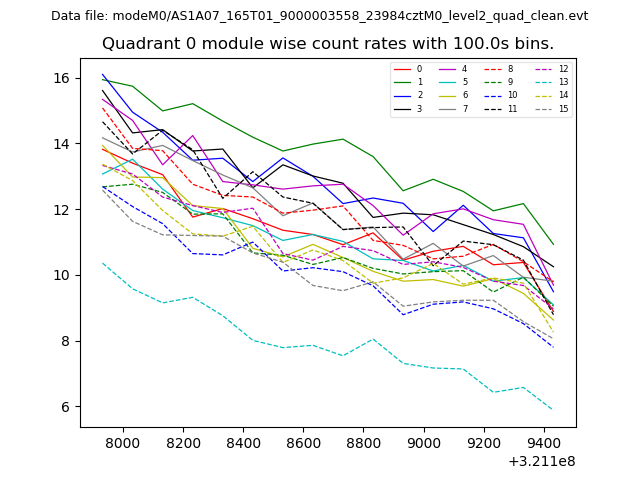 |
 |
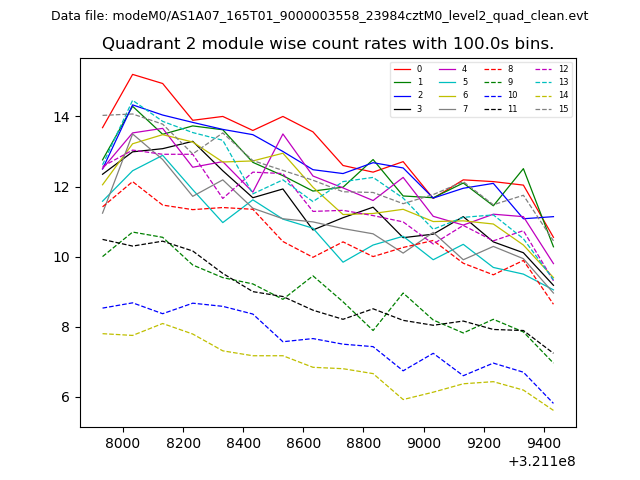
| Module-wise count rates for Quadrant B Data is divided into 100 sec bins |
 |
 |
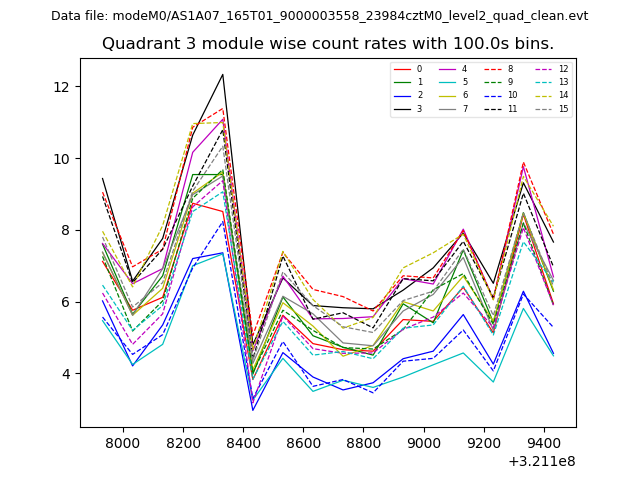
| Module-wise count rates for Quadrant C Data is divided into 100 sec bins |
 |
 |
| Module-wise count rates for Quadrant D Data is divided into 100 sec bins |
 |
 |
| Parameter | Plot |
|---|---|
| CZT HV Monitor | 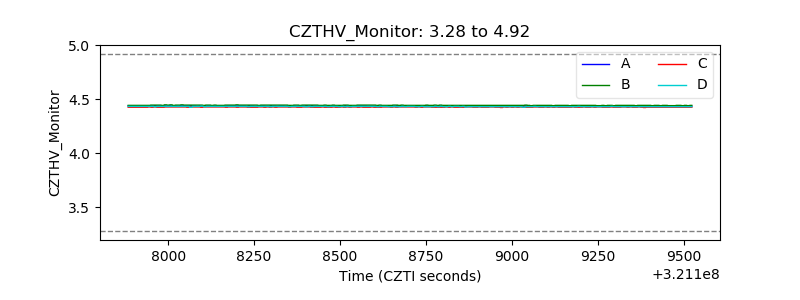 |
| D_VDD | 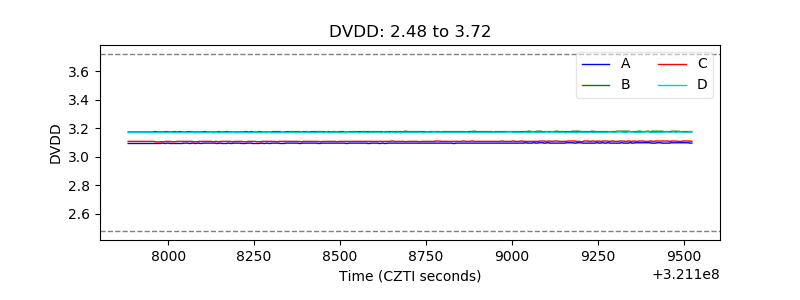 |
| Temperature 1 | 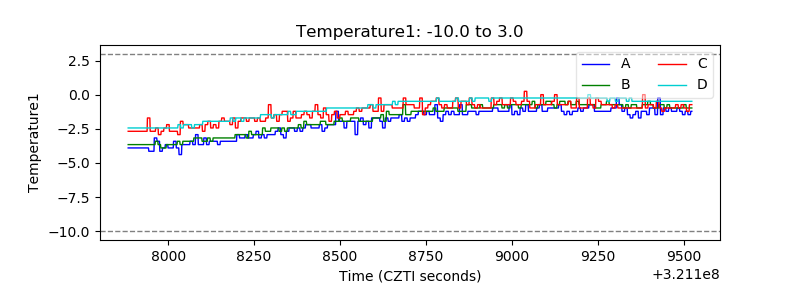 |
| Veto HV Monitor | 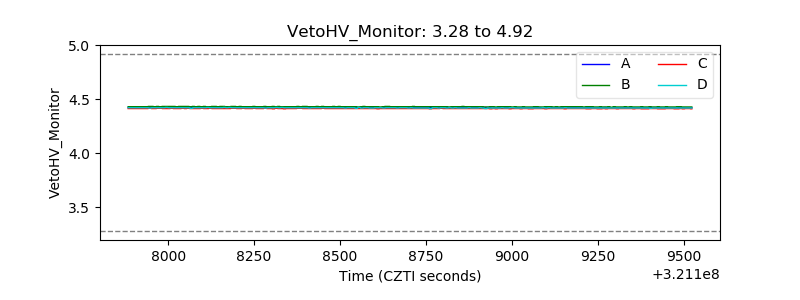 |
| Veto LLD | 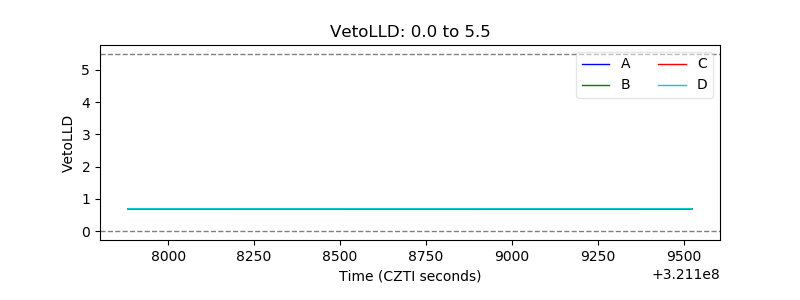 |
| Alpha Counter | 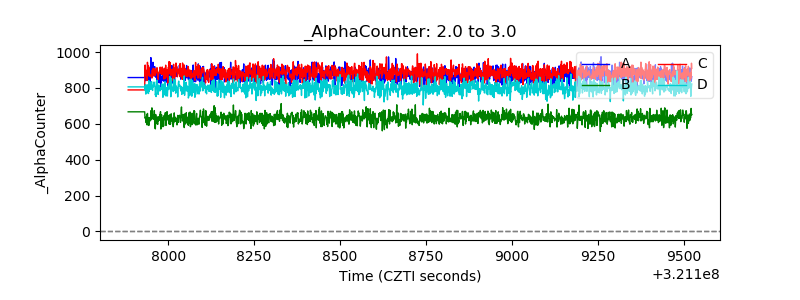 |
| _CPM_Rate |  |
| CZT Counter | 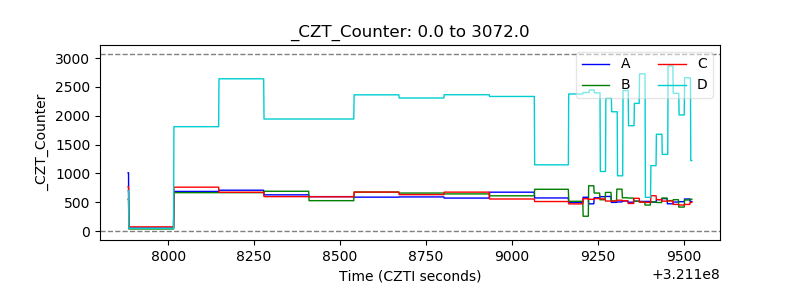 |
| +2.5 Volts monitor | 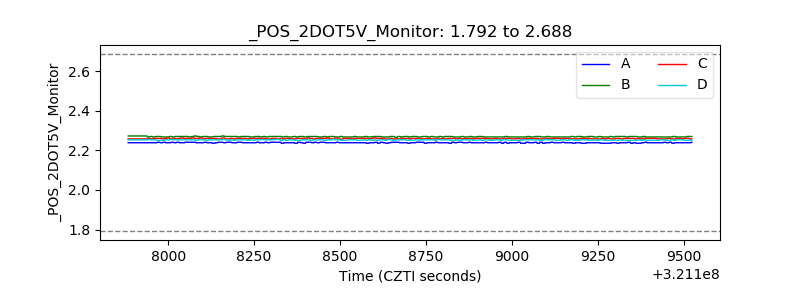 |
| +5 Volts monitor |  |
| _ROLL_ROT | 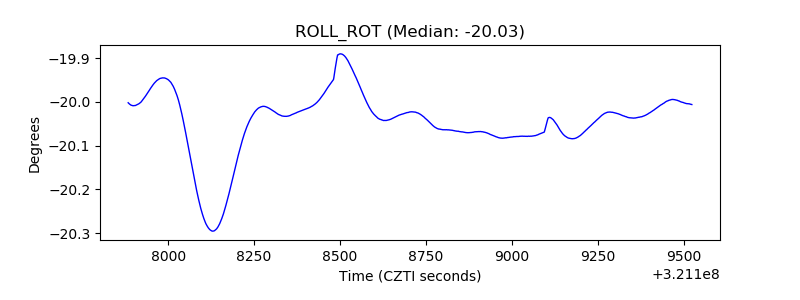 |
| _Roll_DEC |  |
| _Roll_RA | 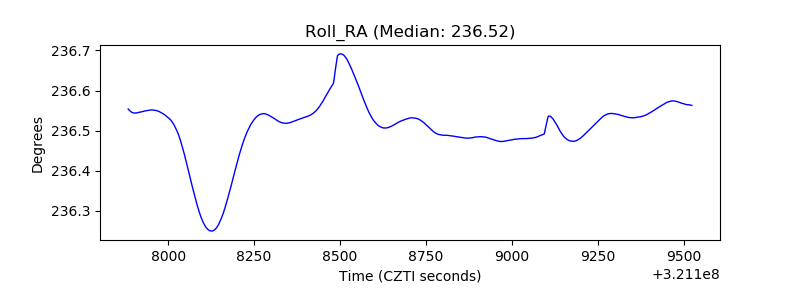 |
| Veto Counter | 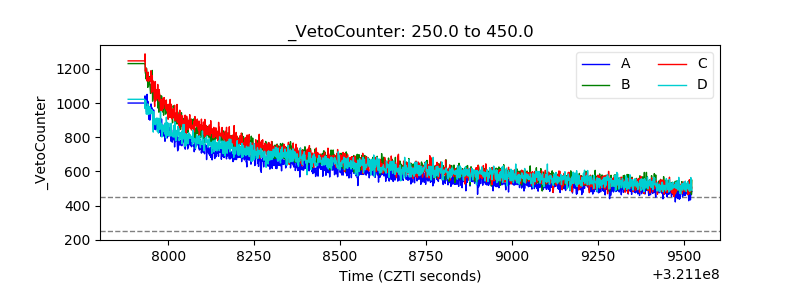 |