| Param | Original file | Final file |
|---|---|---|
| Filename | modeM0/AS1A07_165T01_9000003558_23985cztM0_level2.evt | modeM0/AS1A07_165T01_9000003558_23985cztM0_level2_quad_clean.evt |
| Size (bytes) | 583,689,600 | 138,153,600 |
| Size | 556.6 MB | 131.8 MB |
| Events in quadrant A | 3,255,447 | 994,873 |
| Events in quadrant B | 3,371,173 | 1,004,290 |
| Events in quadrant C | 3,335,499 | 951,886 |
| Events in quadrant D | 7,292,979 | 798,323 |
| Mode M9 | |||
|---|---|---|---|
| Quadrant | BADHDUFLAG | Total packets | Discarded packets |
| A | 0 | 14 | 0 |
| B | 0 | 14 | 0 |
| C | 0 | 14 | 0 |
| D | 0 | 14 | 0 |
| Mode M0 | |||
|---|---|---|---|
| Quadrant | BADHDUFLAG | Total packets | Discarded packets |
| A | 0 | 13510 | 1 |
| B | 0 | 13873 | 1 |
| C | 0 | 13720 | 1 |
| D | 0 | 25989 | 1 |
| Mode SS | |||
|---|---|---|---|
| Quadrant | BADHDUFLAG | Total packets | Discarded packets |
| A | 0 | 124 | 0 |
| B | 0 | 124 | 0 |
| C | 0 | 124 | 0 |
| D | 0 | 124 | 0 |
| Quadrant | Total seconds | Saturated seconds | Saturation percentage |
|---|---|---|---|
| A | 6234 | 62 | 0.994546% |
| B | 6234 | 72 | 1.154957% |
| C | 6234 | 121 | 1.940969% |
| D | 6235 | 1543 | 24.747394% |
Noise dominated data is calculated using 1-second bins in cleaned event files. If a bin has >2000 counts, and if more than 50% of those come from <1% of pixels, then it is considered to be noise-dominated and hence unusable.
| Quadrant | # 1 sec bins | Bins with >0 counts | Bins with >2000 counts | High rate bins dominated by noise | Noise dominated (total time) | Noise dominated (detector-on time) | Marked lightcurve |
|---|---|---|---|---|---|---|---|
| A | 7554 | 6235 | 0 | 0 | 0.00% | 0.00% | 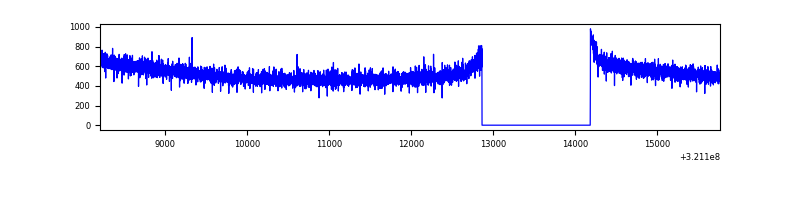 |
| B | 7554 | 6235 | 7 | 7 | 0.09% | 0.11% | 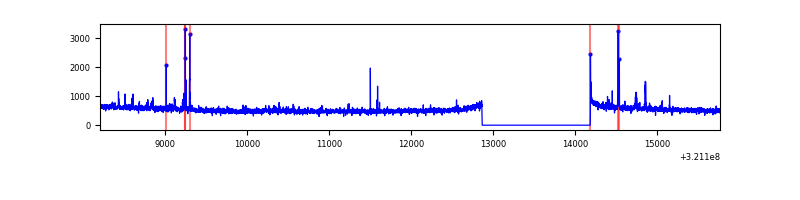 |
| C | 7554 | 6235 | 7 | 7 | 0.09% | 0.11% | 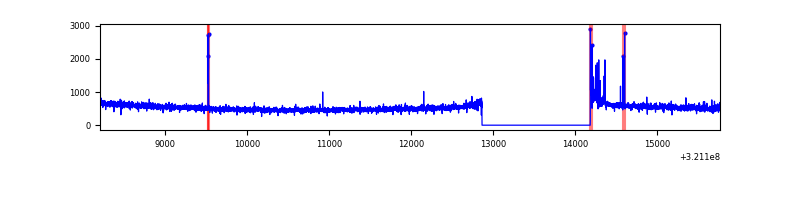 |
| D | 7555 | 6236 | 1037 | 1037 | 13.73% | 16.63% | 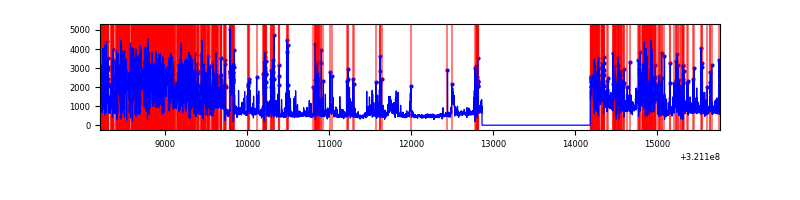 |
Top three noisy pixels from each quadrant. If the there are fewer than three noisy pixels in the level2.evt file, extra rows are filled as -1
| Pixel properties | Quadrant properties | ||||||
|---|---|---|---|---|---|---|---|
| Quadrant | DetID | PixID | Counts | Sigma | Mean | Median | Sigma |
| A | 13 | 254 | 11296 | 62.72 | 844 | 830 | 166.9 |
| A | 0 | 226 | 7548 | 40.26 | 844 | 830 | 166.9 |
| A | 3 | 137 | 6351 | 33.09 | 844 | 830 | 166.9 |
| B | 0 | 197 | 51820 | 338.27 | 833 | 818 | 150.8 |
| B | 0 | 190 | 27500 | 176.97 | 833 | 818 | 150.8 |
| B | 12 | 111 | 16833 | 106.22 | 833 | 818 | 150.8 |
| C | 14 | 238 | 132977 | 738.67 | 794 | 802 | 178.9 |
| C | 0 | 10 | 83107 | 459.97 | 794 | 802 | 178.9 |
| C | 0 | 239 | 16567 | 88.1 | 794 | 802 | 178.9 |
| D | 12 | 218 | 3053978 | 17817.06 | 714 | 694 | 171.4 |
| D | 12 | 233 | 577092 | 3363.5 | 714 | 694 | 171.4 |
| D | 1 | 52 | 304128 | 1770.65 | 714 | 694 | 171.4 |
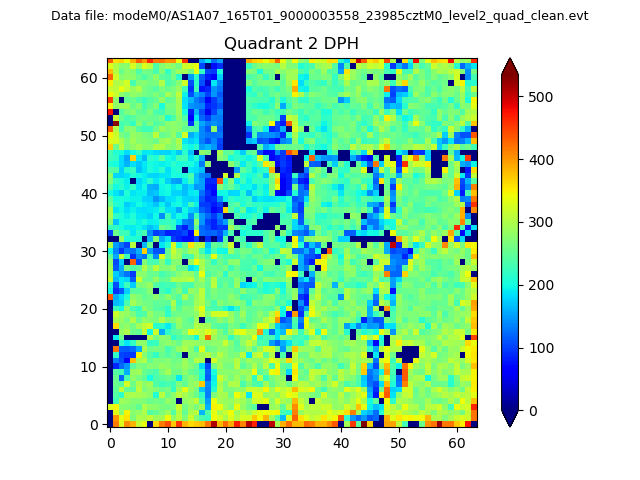
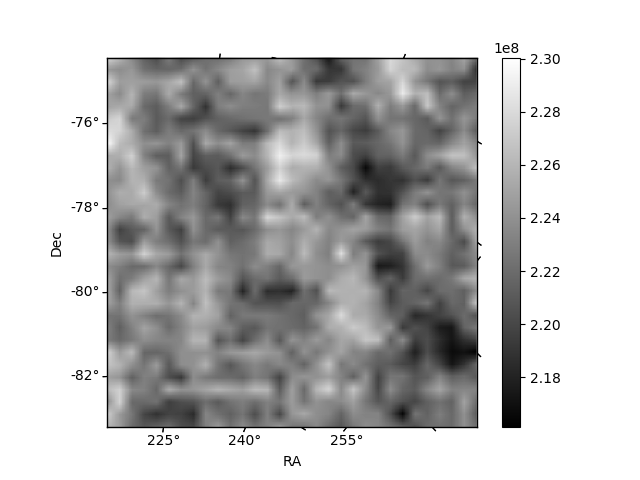
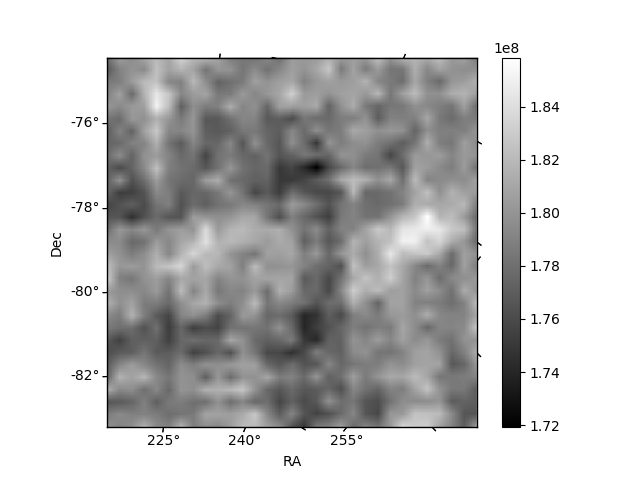
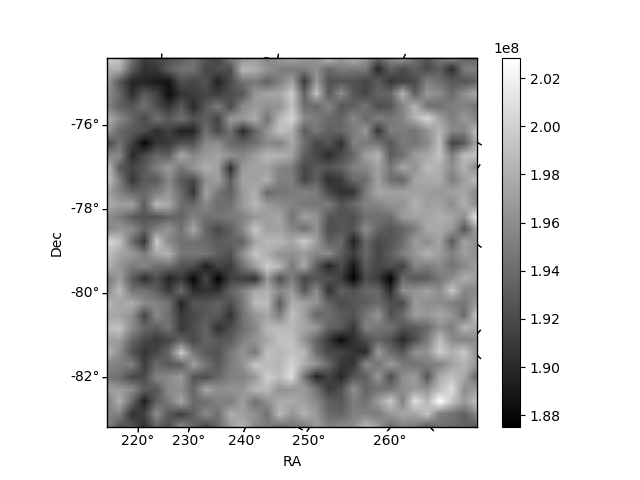
Histogram calculated using DETX and DETY for each event in the final _common_clean file
| Quadrant A | 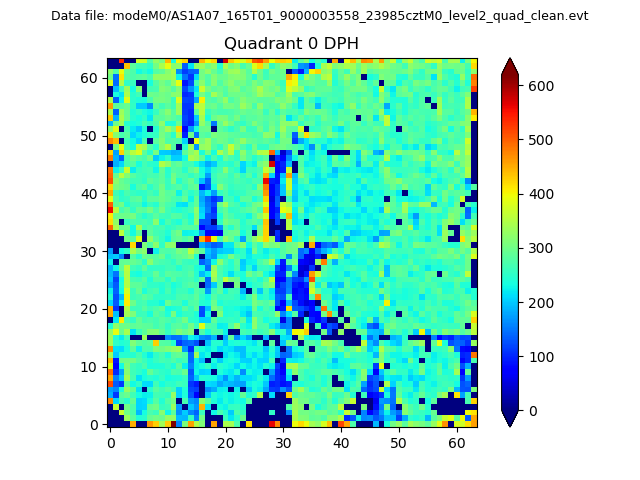 |
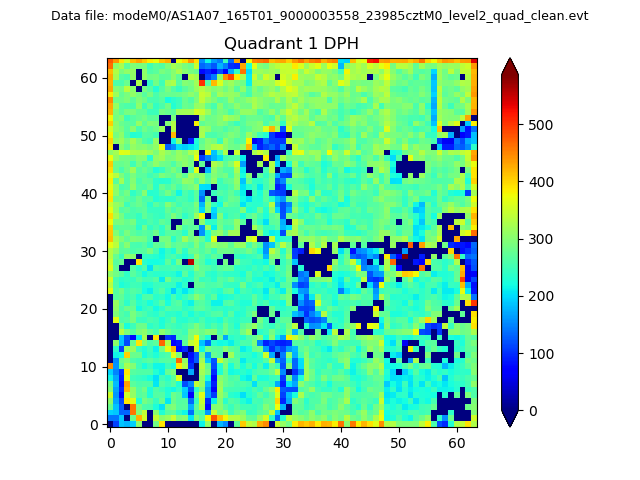 |
Quadrant B |
|---|---|---|---|
| Quadrant D | 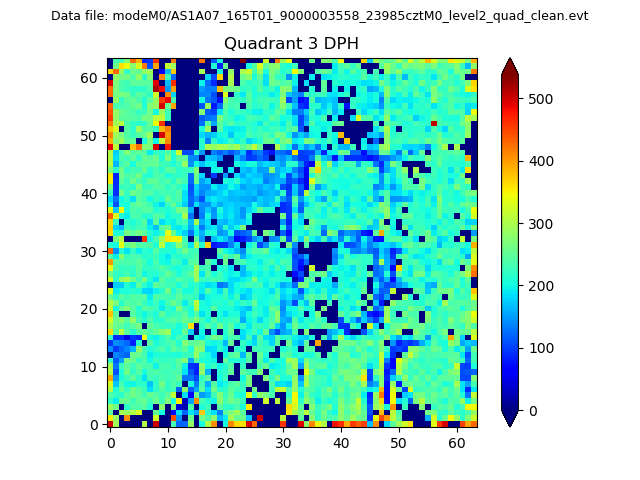 |
 |
Quadrant C |
| Plot type | Count rate plots | Images |
|---|---|---|
| Comparison with Poisson distribution Blue bars denote a histogram of data divided into 1 sec bins. Red curve is a Poisson curve with rate = median count rate of data. |
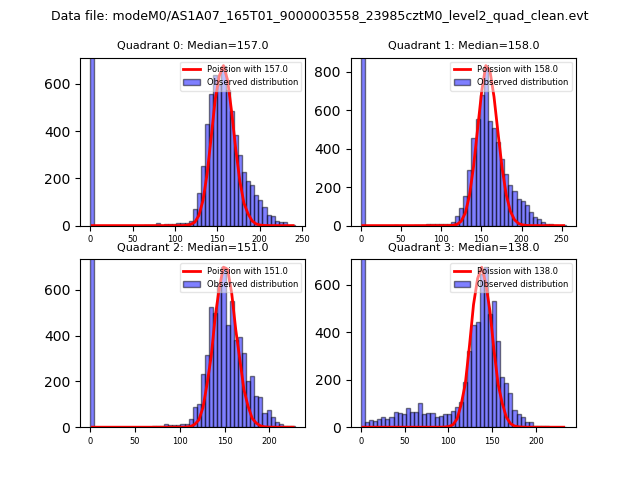 |
 |
| Quadrant-wise count rates Data is divided into 100 sec bins |
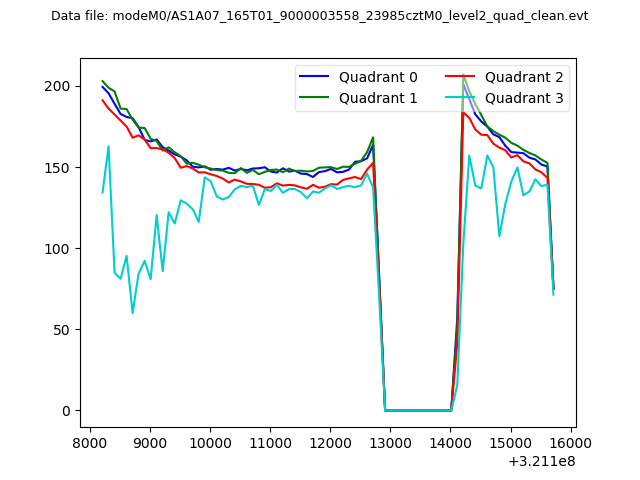 |
|
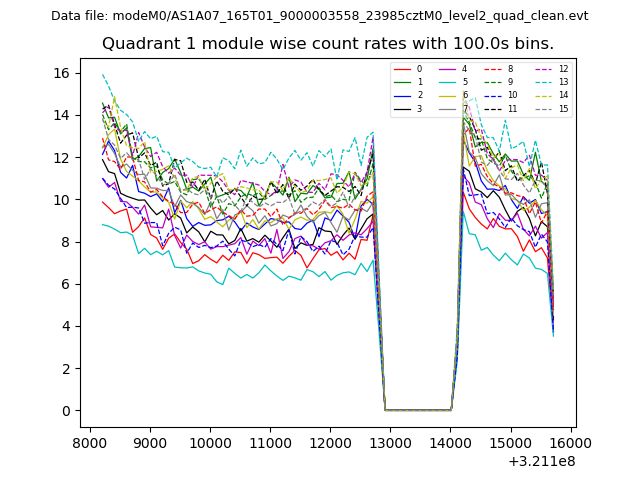
| Module-wise count rates for Quadrant A Data is divided into 100 sec bins |
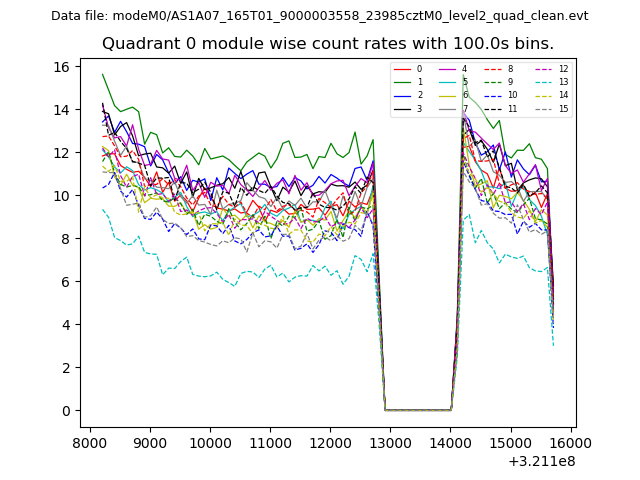 |
 |
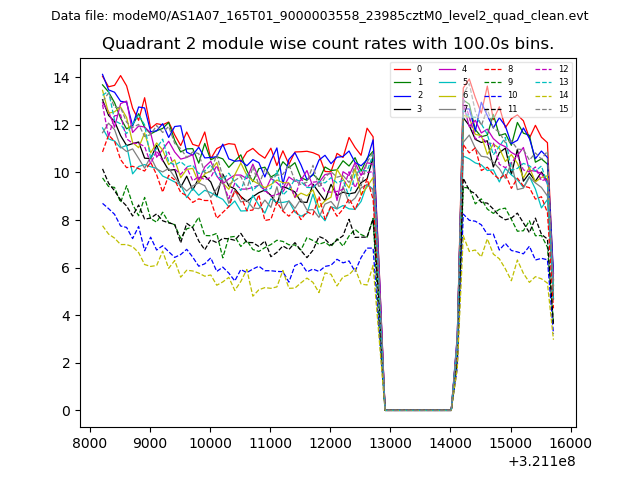
| Module-wise count rates for Quadrant B Data is divided into 100 sec bins |
 |
 |
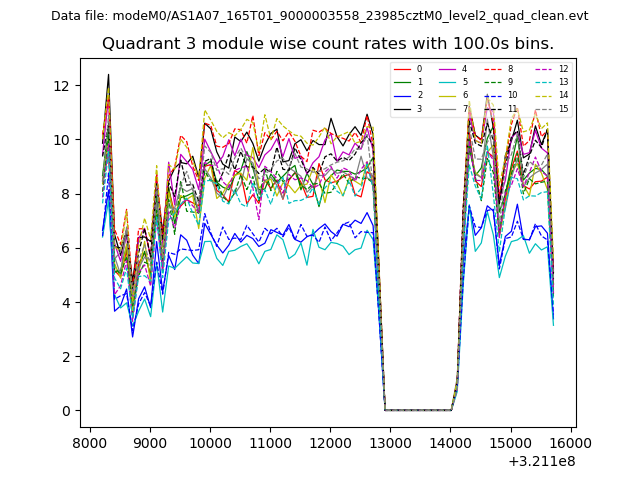
| Module-wise count rates for Quadrant C Data is divided into 100 sec bins |
 |
 |
| Module-wise count rates for Quadrant D Data is divided into 100 sec bins |
 |
 |
| Parameter | Plot |
|---|---|
| CZT HV Monitor | 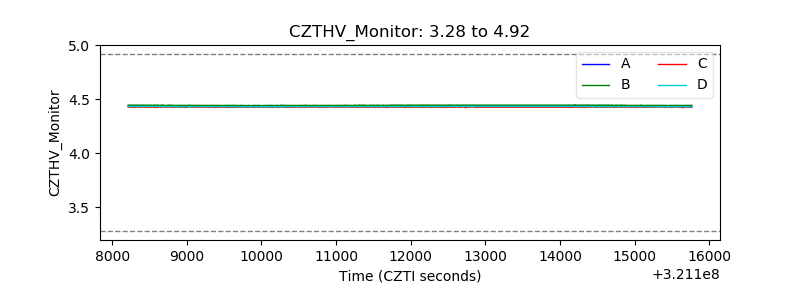 |
| D_VDD | 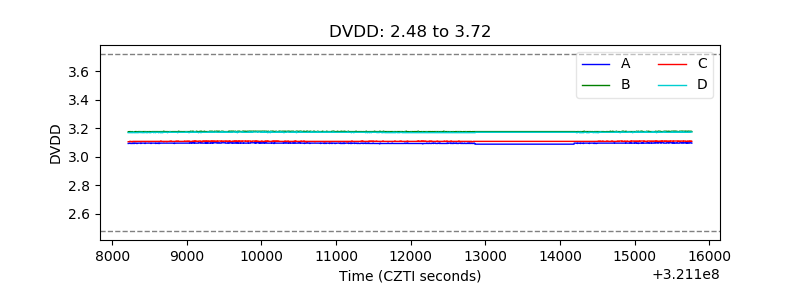 |
| Temperature 1 | 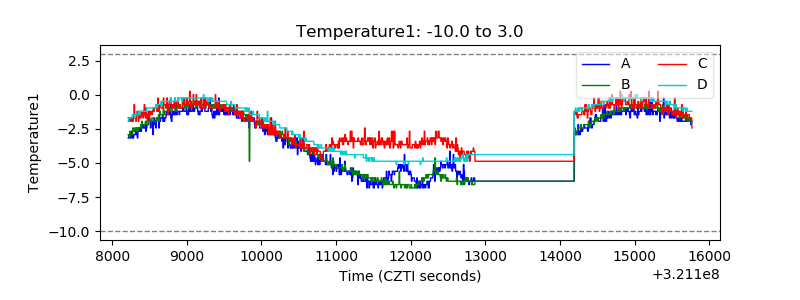 |
| Veto HV Monitor | 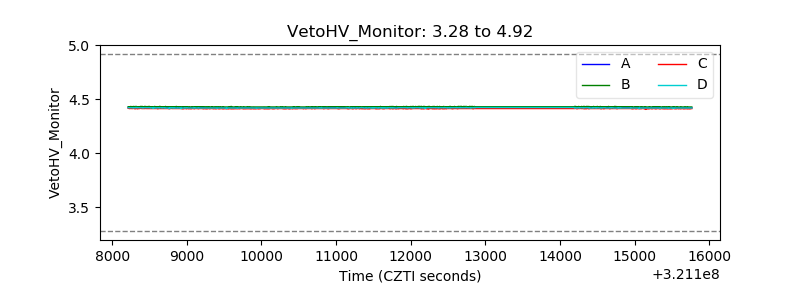 |
| Veto LLD | 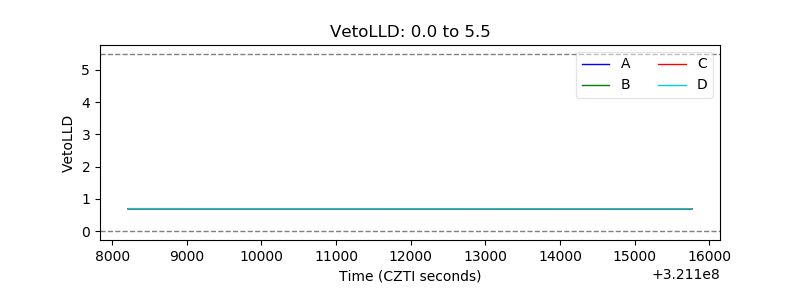 |
| Alpha Counter | 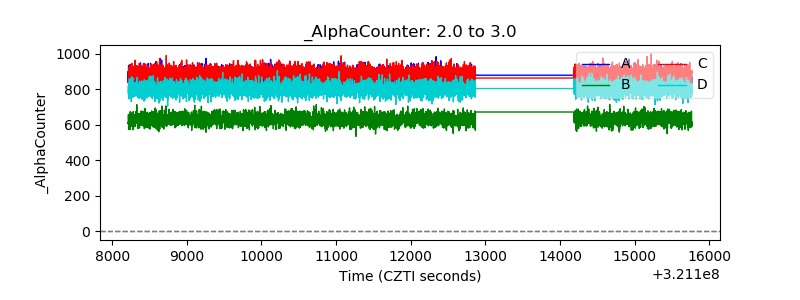 |
| _CPM_Rate | 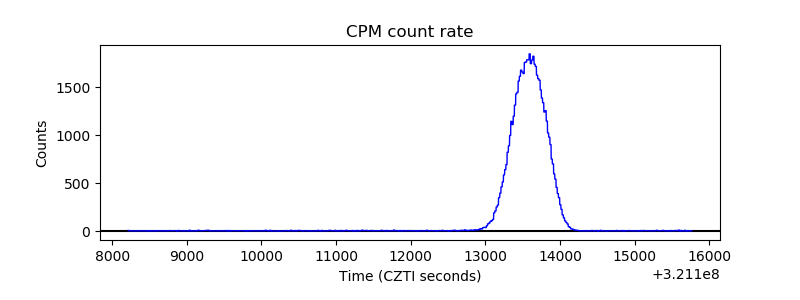 |
| CZT Counter |  |
| +2.5 Volts monitor |  |
| +5 Volts monitor |  |
| _ROLL_ROT |  |
| _Roll_DEC | 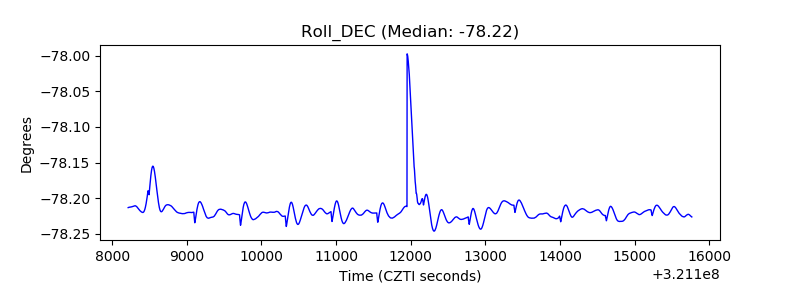 |
| _Roll_RA | 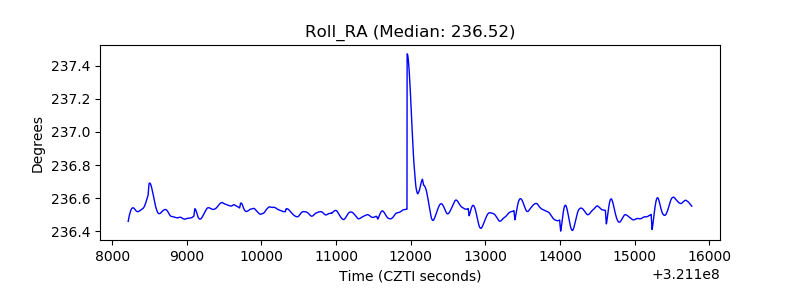 |
| Veto Counter | 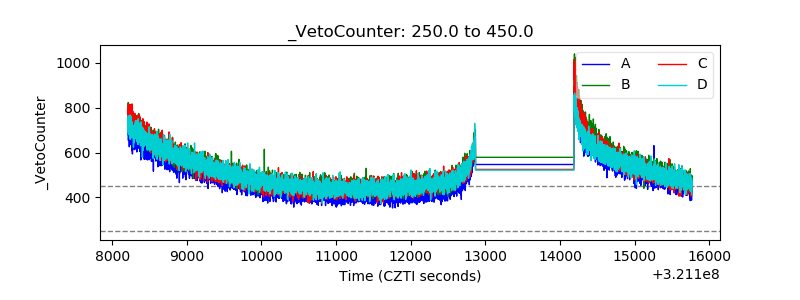 |