| Param | Original file | Final file |
|---|---|---|
| Filename | modeM0/AS1A07_165T01_9000003558_23986cztM0_level2.evt | modeM0/AS1A07_165T01_9000003558_23986cztM0_level2_quad_clean.evt |
| Size (bytes) | 554,667,840 | 121,397,760 |
| Size | 529.0 MB | 115.8 MB |
| Events in quadrant A | 2,927,792 | 874,499 |
| Events in quadrant B | 2,981,867 | 883,800 |
| Events in quadrant C | 3,390,380 | 820,395 |
| Events in quadrant D | 7,095,717 | 683,222 |
| Mode M9 | |||
|---|---|---|---|
| Quadrant | BADHDUFLAG | Total packets | Discarded packets |
| A | 0 | 12 | 0 |
| B | 0 | 12 | 0 |
| C | 0 | 12 | 0 |
| D | 0 | 12 | 0 |
| Mode M0 | |||
|---|---|---|---|
| Quadrant | BADHDUFLAG | Total packets | Discarded packets |
| A | 0 | 12302 | 1 |
| B | 0 | 12404 | 1 |
| C | 0 | 13720 | 1 |
| D | 0 | 25162 | 1 |
| Mode SS | |||
|---|---|---|---|
| Quadrant | BADHDUFLAG | Total packets | Discarded packets |
| A | 0 | 122 | 0 |
| B | 0 | 122 | 0 |
| C | 0 | 122 | 0 |
| D | 0 | 122 | 0 |
| Quadrant | Total seconds | Saturated seconds | Saturation percentage |
|---|---|---|---|
| A | 5924 | 101 | 1.704929% |
| B | 5925 | 108 | 1.822785% |
| C | 5925 | 276 | 4.658228% |
| D | 5924 | 1719 | 29.017556% |
Noise dominated data is calculated using 1-second bins in cleaned event files. If a bin has >2000 counts, and if more than 50% of those come from <1% of pixels, then it is considered to be noise-dominated and hence unusable.
| Quadrant | # 1 sec bins | Bins with >0 counts | Bins with >2000 counts | High rate bins dominated by noise | Noise dominated (total time) | Noise dominated (detector-on time) | Marked lightcurve |
|---|---|---|---|---|---|---|---|
| A | 7114 | 5925 | 0 | 0 | 0.00% | 0.00% | 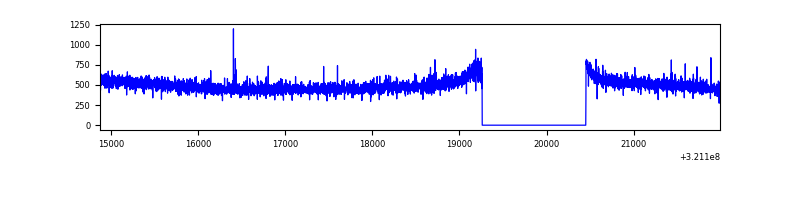 |
| B | 7115 | 5926 | 1 | 1 | 0.01% | 0.02% | 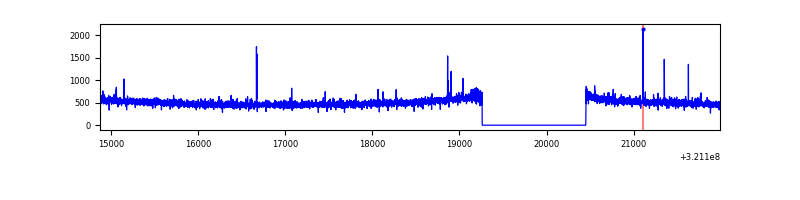 |
| C | 7115 | 5926 | 93 | 93 | 1.31% | 1.57% | 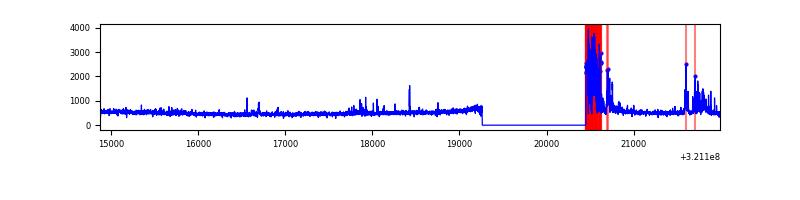 |
| D | 7114 | 5925 | 1054 | 1054 | 14.82% | 17.79% | 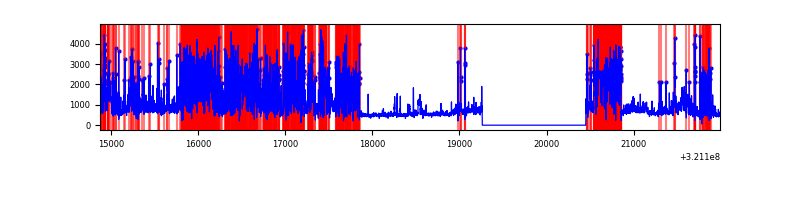 |
Top three noisy pixels from each quadrant. If the there are fewer than three noisy pixels in the level2.evt file, extra rows are filled as -1
| Pixel properties | Quadrant properties | ||||||
|---|---|---|---|---|---|---|---|
| Quadrant | DetID | PixID | Counts | Sigma | Mean | Median | Sigma |
| A | 13 | 254 | 10439 | 64.97 | 757 | 744 | 149.2 |
| A | 2 | 79 | 9008 | 55.38 | 757 | 744 | 149.2 |
| A | 0 | 226 | 6669 | 39.71 | 757 | 744 | 149.2 |
| B | 0 | 197 | 21404 | 150.87 | 752 | 737 | 137.0 |
| B | 12 | 111 | 15533 | 108.01 | 752 | 737 | 137.0 |
| B | 11 | 111 | 13343 | 92.03 | 752 | 737 | 137.0 |
| C | 0 | 10 | 484487 | 2999.62 | 703 | 708 | 161.3 |
| C | 14 | 238 | 115290 | 710.45 | 703 | 708 | 161.3 |
| C | 0 | 239 | 26708 | 161.21 | 703 | 708 | 161.3 |
| D | 12 | 218 | 2989615 | 19768.73 | 624 | 605 | 151.2 |
| D | 12 | 233 | 687419 | 4542.45 | 624 | 605 | 151.2 |
| D | 8 | 195 | 310053 | 2046.63 | 624 | 605 | 151.2 |
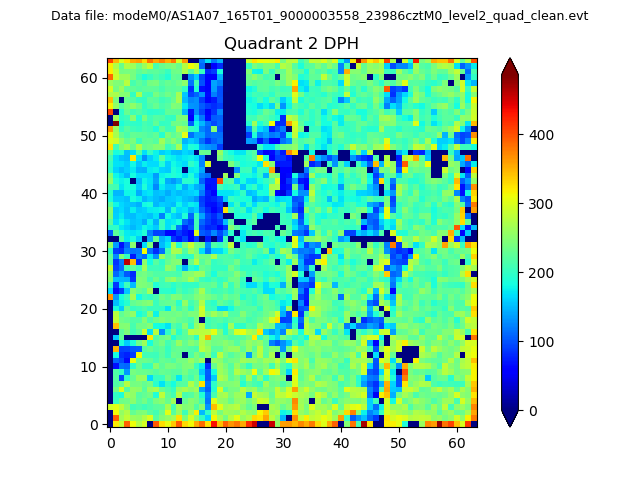
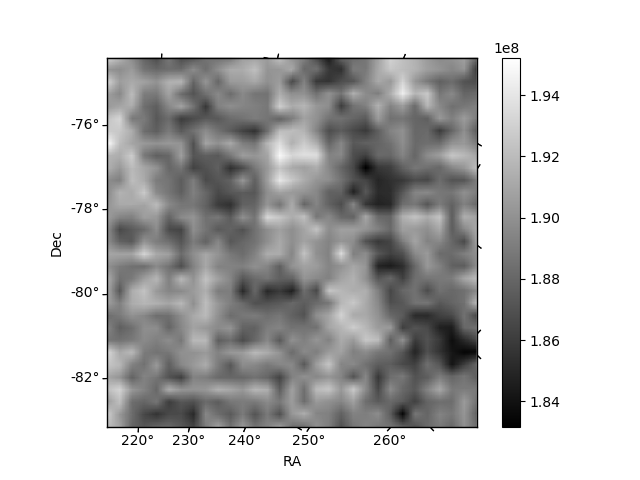
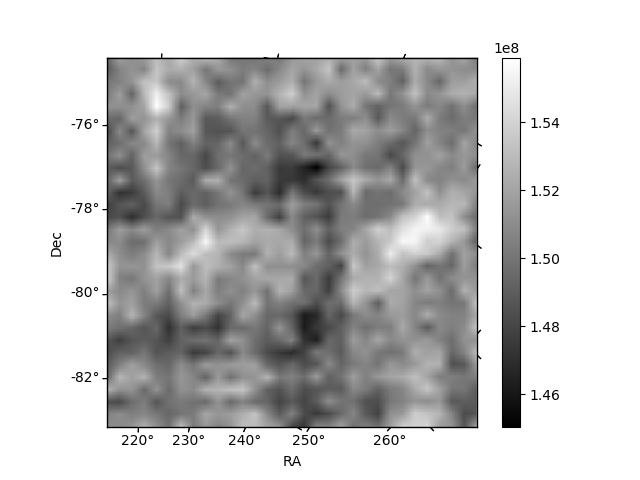
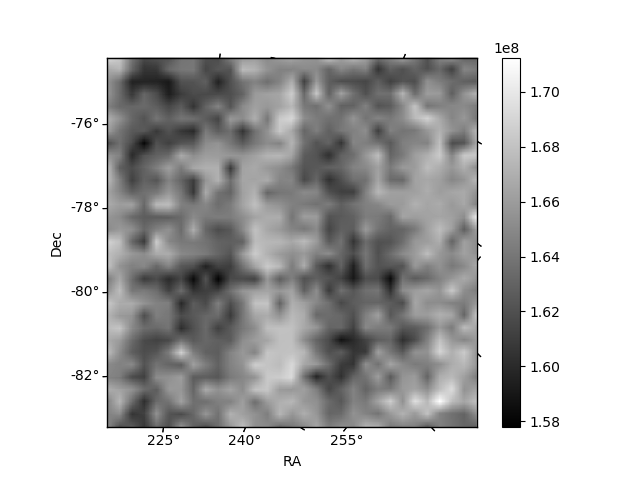
Histogram calculated using DETX and DETY for each event in the final _common_clean file
| Quadrant A | 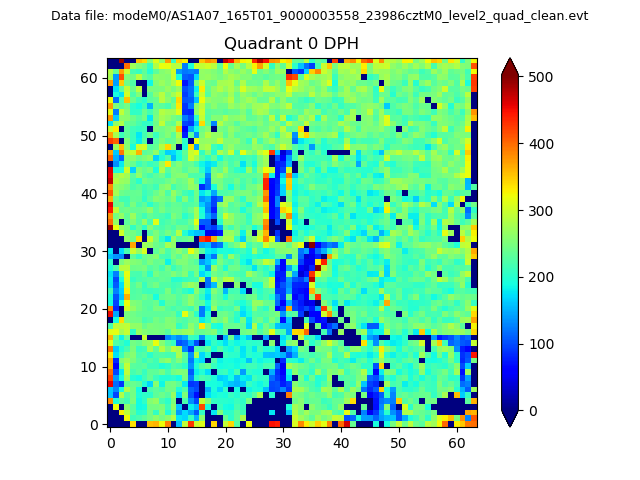 |
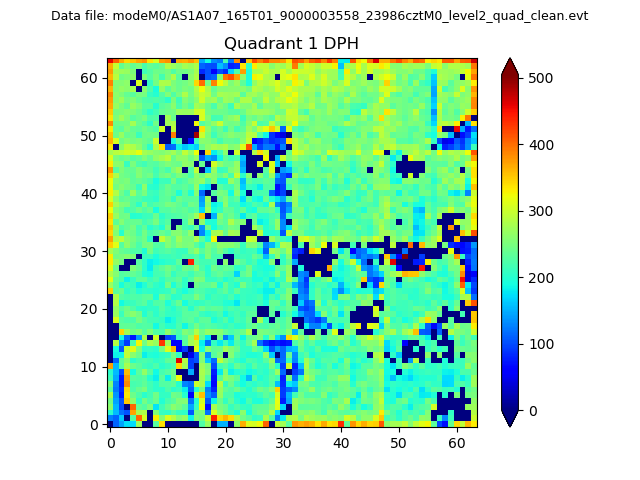 |
Quadrant B |
|---|---|---|---|
| Quadrant D | 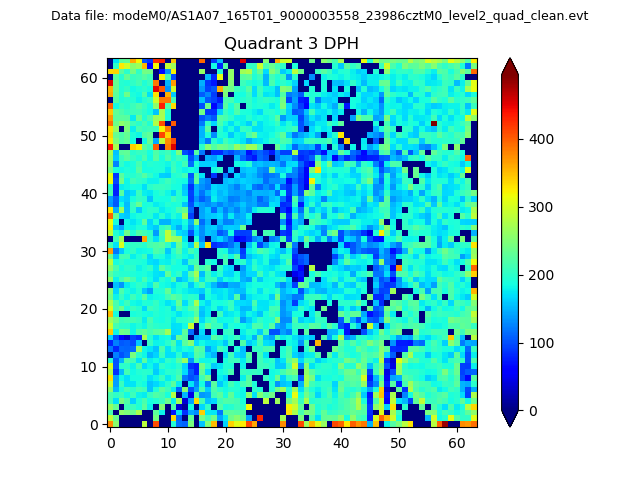 |
 |
Quadrant C |
| Plot type | Count rate plots | Images |
|---|---|---|
| Comparison with Poisson distribution Blue bars denote a histogram of data divided into 1 sec bins. Red curve is a Poisson curve with rate = median count rate of data. |
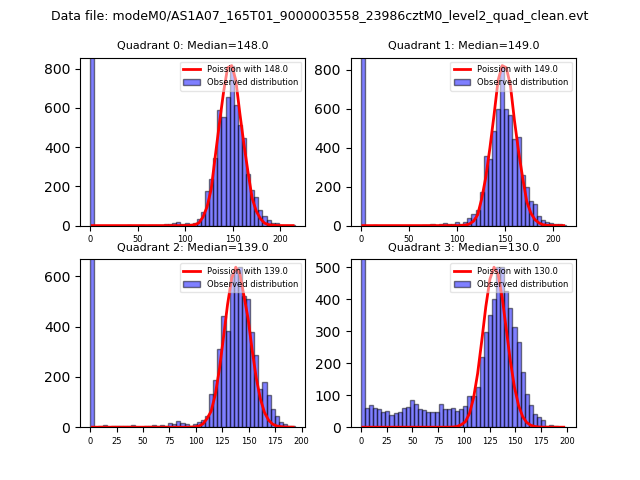 |
 |
| Quadrant-wise count rates Data is divided into 100 sec bins |
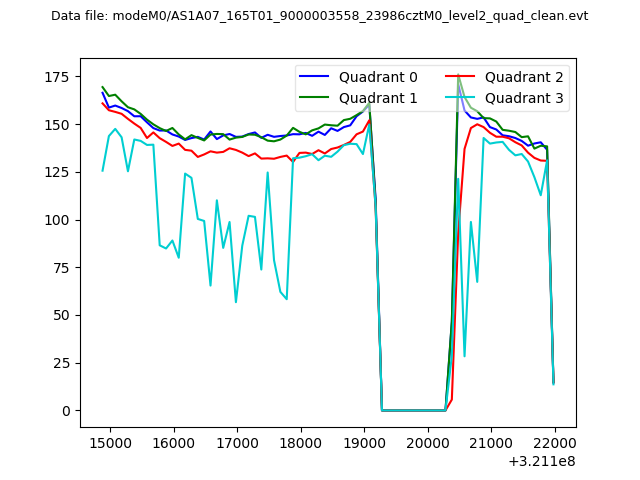 |
|
| Module-wise count rates for Quadrant A Data is divided into 100 sec bins |
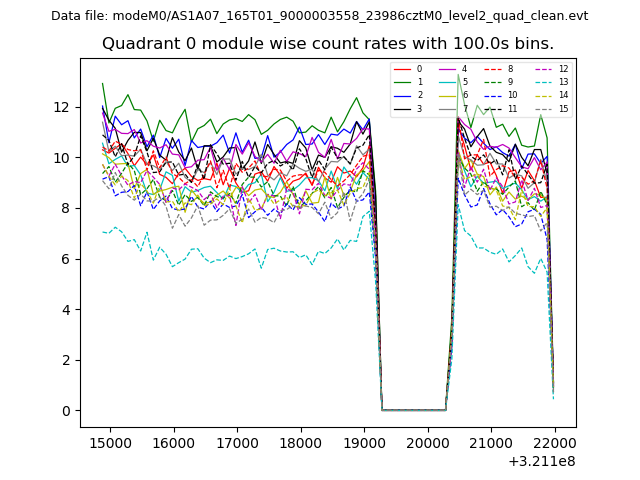 |
 |
| Module-wise count rates for Quadrant B Data is divided into 100 sec bins |
 |
 |
| Module-wise count rates for Quadrant C Data is divided into 100 sec bins |
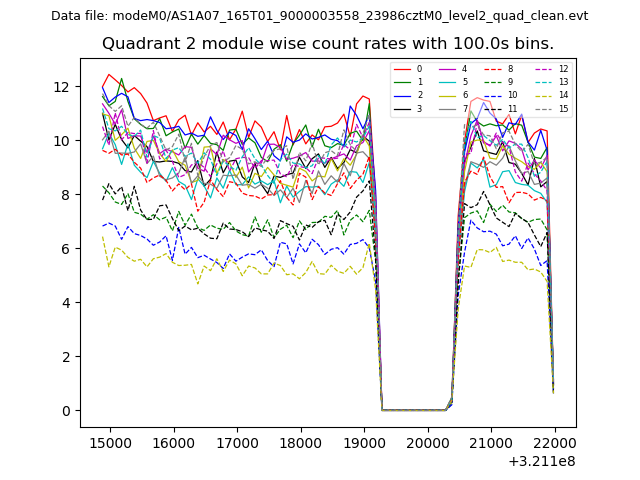 |
 |
| Module-wise count rates for Quadrant D Data is divided into 100 sec bins |
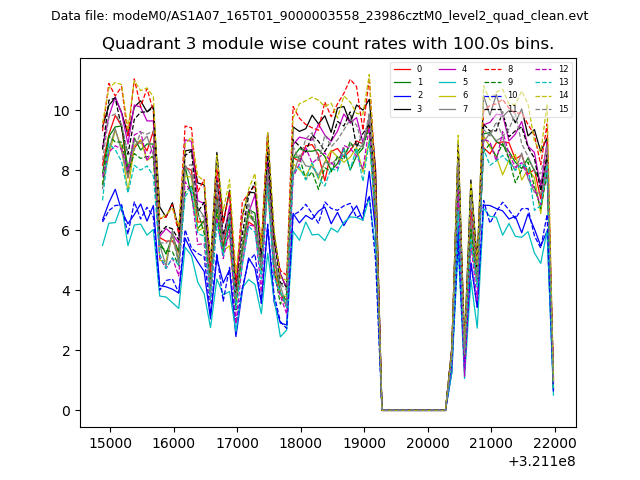 |
 |
| Parameter | Plot |
|---|---|
| CZT HV Monitor | 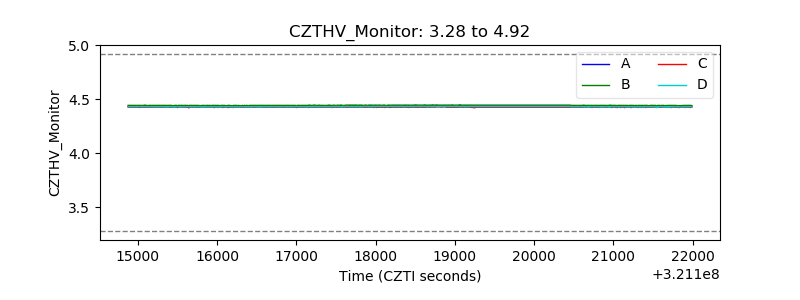 |
| D_VDD | 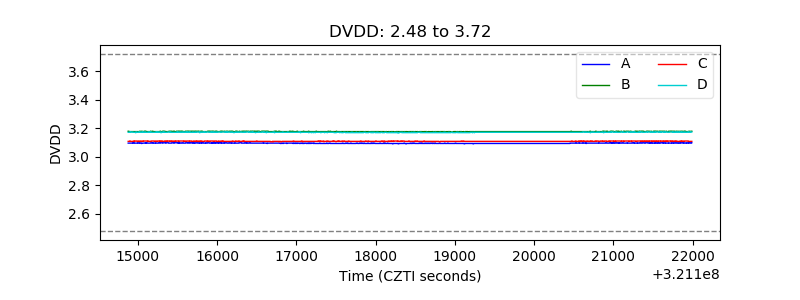 |
| Temperature 1 | 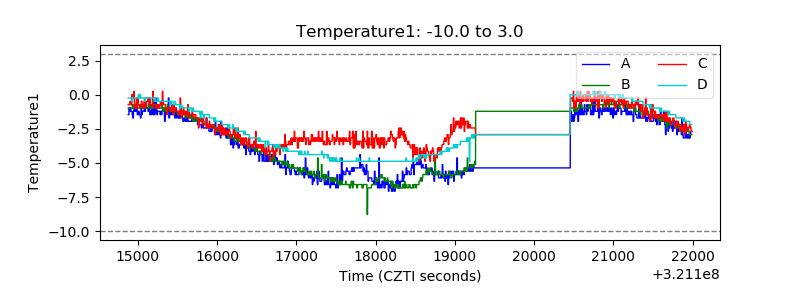 |
| Veto HV Monitor | 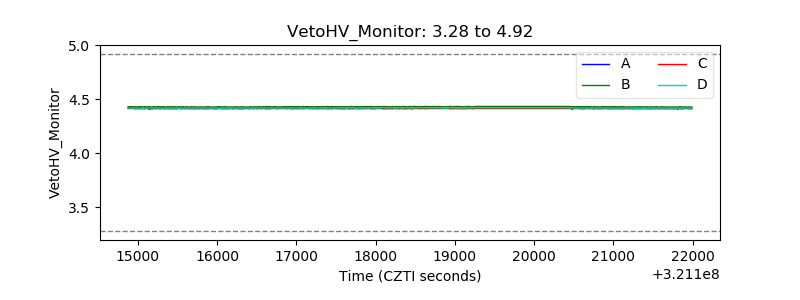 |
| Veto LLD | 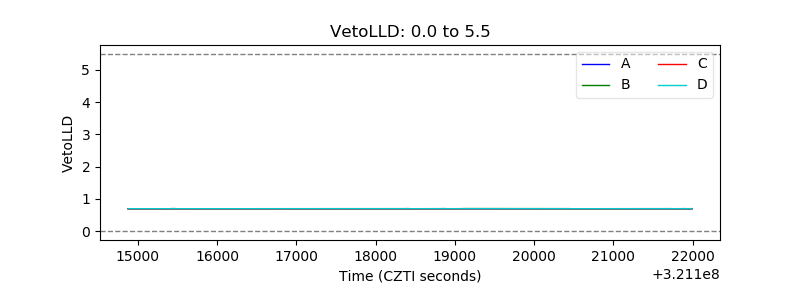 |
| Alpha Counter | 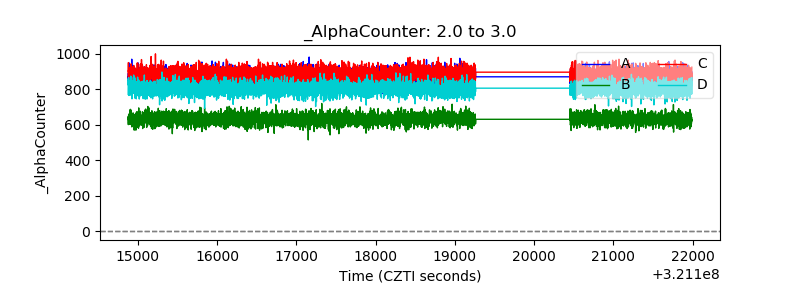 |
| _CPM_Rate | 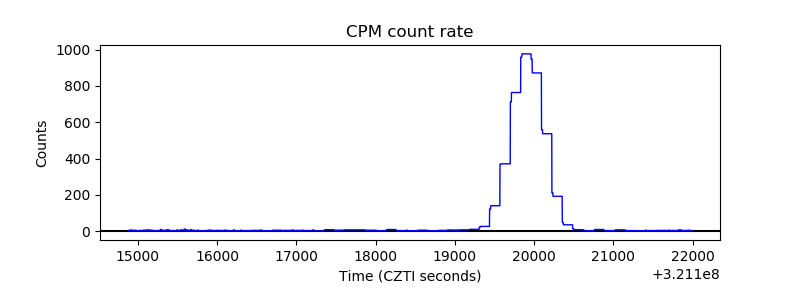 |
| CZT Counter |  |
| +2.5 Volts monitor |  |
| +5 Volts monitor |  |
| _ROLL_ROT |  |
| _Roll_DEC |  |
| _Roll_RA | 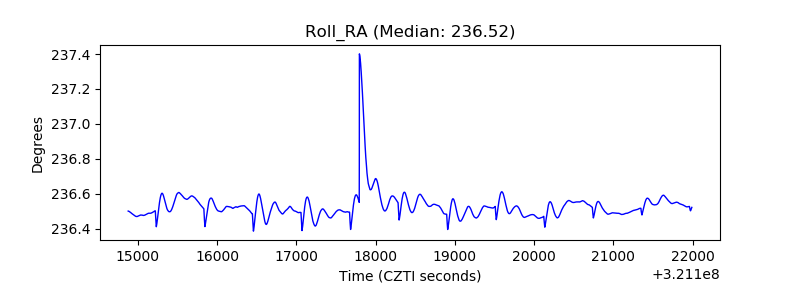 |
| Veto Counter | 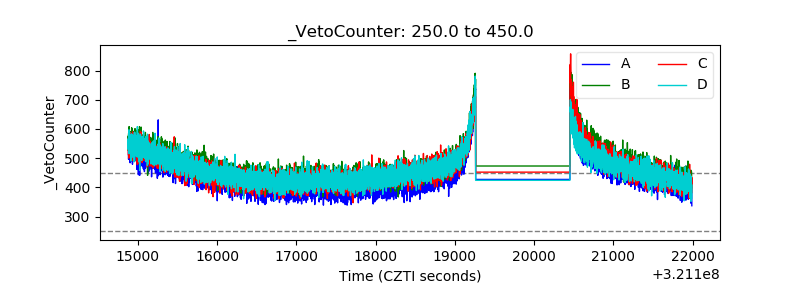 |