| Param | Original file | Final file |
|---|---|---|
| Filename | modeM0/AS1A07_165T01_9000003558_23987cztM0_level2.evt | modeM0/AS1A07_165T01_9000003558_23987cztM0_level2_quad_clean.evt |
| Size (bytes) | 602,988,480 | 129,245,760 |
| Size | 575.1 MB | 123.3 MB |
| Events in quadrant A | 3,123,030 | 910,587 |
| Events in quadrant B | 3,196,979 | 922,836 |
| Events in quadrant C | 3,487,808 | 865,355 |
| Events in quadrant D | 8,010,104 | 758,731 |
| Mode M9 | |||
|---|---|---|---|
| Quadrant | BADHDUFLAG | Total packets | Discarded packets |
| A | 0 | 9 | 0 |
| B | 0 | 9 | 0 |
| C | 0 | 9 | 0 |
| D | 0 | 9 | 0 |
| Mode M0 | |||
|---|---|---|---|
| Quadrant | BADHDUFLAG | Total packets | Discarded packets |
| A | 0 | 13407 | 1 |
| B | 0 | 13535 | 1 |
| C | 0 | 14511 | 1 |
| D | 0 | 28309 | 1 |
| Mode SS | |||
|---|---|---|---|
| Quadrant | BADHDUFLAG | Total packets | Discarded packets |
| A | 0 | 134 | 0 |
| B | 0 | 134 | 0 |
| C | 0 | 134 | 0 |
| D | 0 | 134 | 0 |
| Quadrant | Total seconds | Saturated seconds | Saturation percentage |
|---|---|---|---|
| A | 6541 | 72 | 1.100749% |
| B | 6541 | 84 | 1.284207% |
| C | 6541 | 163 | 2.491974% |
| D | 6542 | 1552 | 23.723632% |
Noise dominated data is calculated using 1-second bins in cleaned event files. If a bin has >2000 counts, and if more than 50% of those come from <1% of pixels, then it is considered to be noise-dominated and hence unusable.
| Quadrant | # 1 sec bins | Bins with >0 counts | Bins with >2000 counts | High rate bins dominated by noise | Noise dominated (total time) | Noise dominated (detector-on time) | Marked lightcurve |
|---|---|---|---|---|---|---|---|
| A | 7461 | 6542 | 0 | 0 | 0.00% | 0.00% | 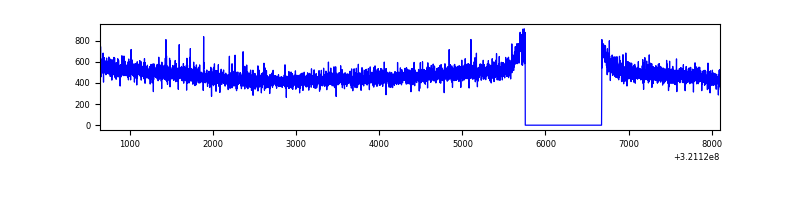 |
| B | 7461 | 6542 | 1 | 1 | 0.01% | 0.02% | 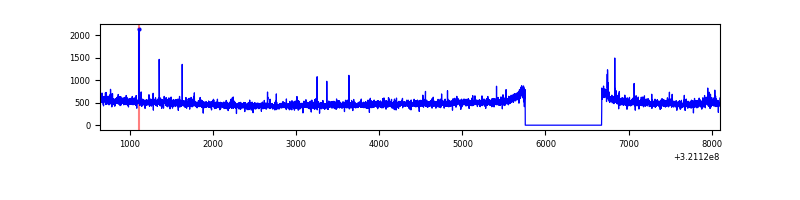 |
| C | 7461 | 6542 | 46 | 46 | 0.62% | 0.70% | 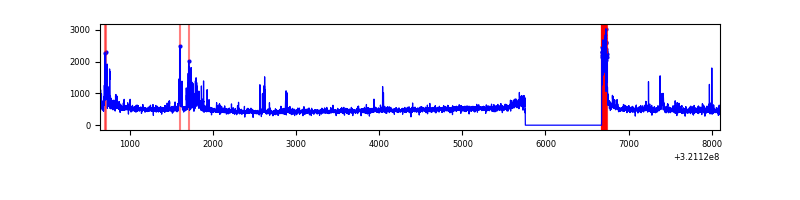 |
| D | 7462 | 6543 | 1177 | 1177 | 15.77% | 17.99% | 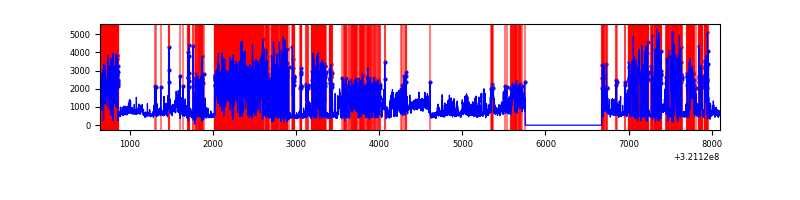 |
Top three noisy pixels from each quadrant. If the there are fewer than three noisy pixels in the level2.evt file, extra rows are filled as -1
| Pixel properties | Quadrant properties | ||||||
|---|---|---|---|---|---|---|---|
| Quadrant | DetID | PixID | Counts | Sigma | Mean | Median | Sigma |
| A | 13 | 254 | 11147 | 64.35 | 809 | 794 | 160.9 |
| A | 0 | 226 | 7067 | 38.99 | 809 | 794 | 160.9 |
| A | 3 | 137 | 6655 | 36.43 | 809 | 794 | 160.9 |
| B | 0 | 197 | 23941 | 156.67 | 804 | 787 | 147.8 |
| B | 12 | 111 | 16736 | 107.92 | 804 | 787 | 147.8 |
| B | 11 | 111 | 14721 | 94.28 | 804 | 787 | 147.8 |
| C | 0 | 10 | 335519 | 1924.02 | 758 | 763 | 174.0 |
| C | 14 | 238 | 121872 | 696.08 | 758 | 763 | 174.0 |
| C | 0 | 239 | 54060 | 306.33 | 758 | 763 | 174.0 |
| D | 12 | 218 | 3625277 | 21148.45 | 707 | 685 | 171.4 |
| D | 12 | 233 | 436546 | 2543.12 | 707 | 685 | 171.4 |
| D | 12 | 250 | 366767 | 2135.98 | 707 | 685 | 171.4 |
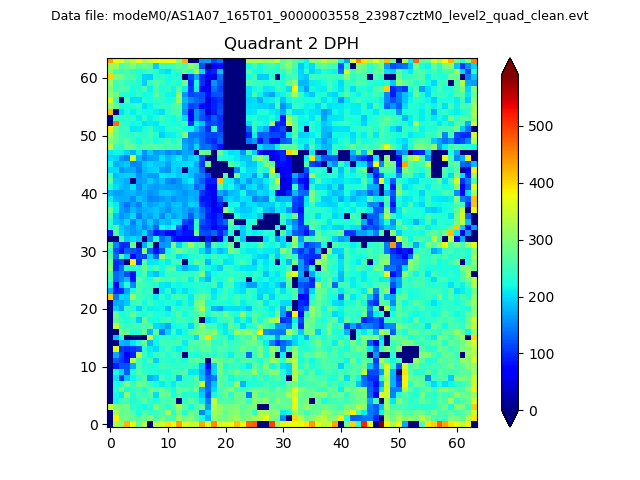
Histogram calculated using DETX and DETY for each event in the final _common_clean file
| Quadrant A | 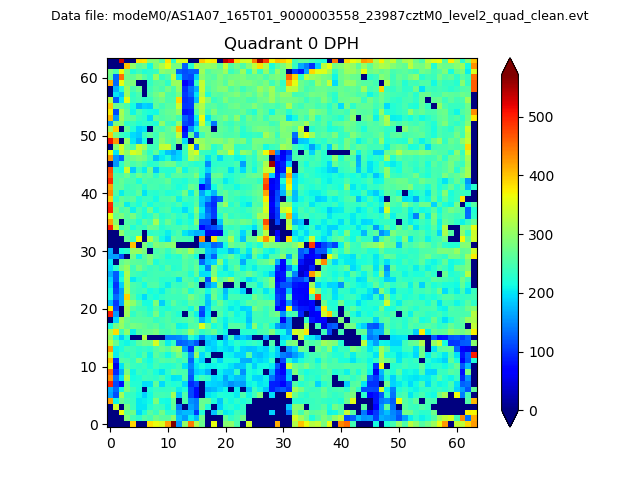 |
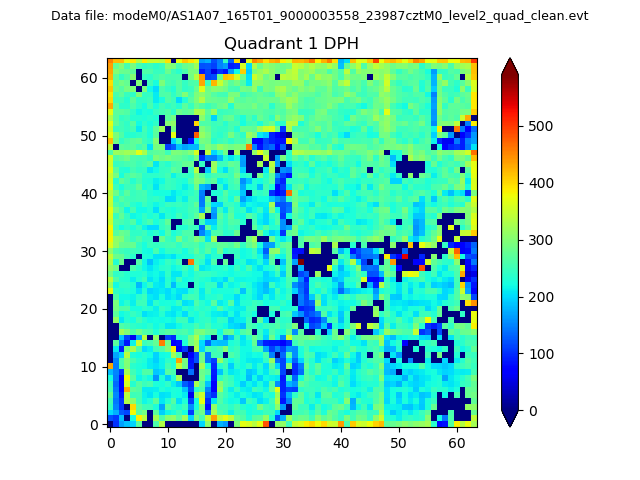 |
Quadrant B |
|---|---|---|---|
| Quadrant D | 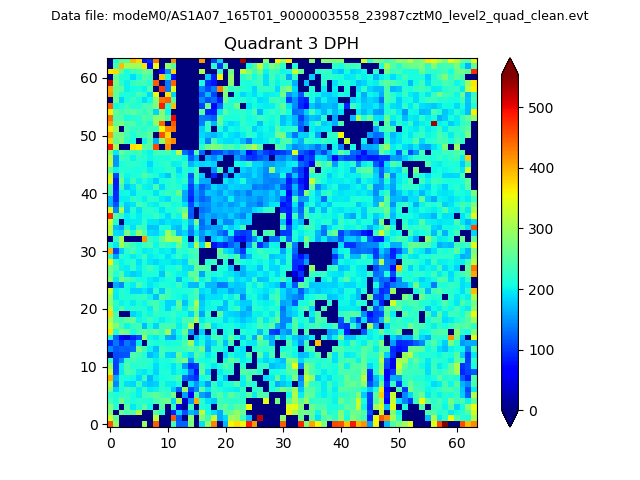 |
 |
Quadrant C |
| Plot type | Count rate plots | Images |
|---|---|---|
| Comparison with Poisson distribution Blue bars denote a histogram of data divided into 1 sec bins. Red curve is a Poisson curve with rate = median count rate of data. |
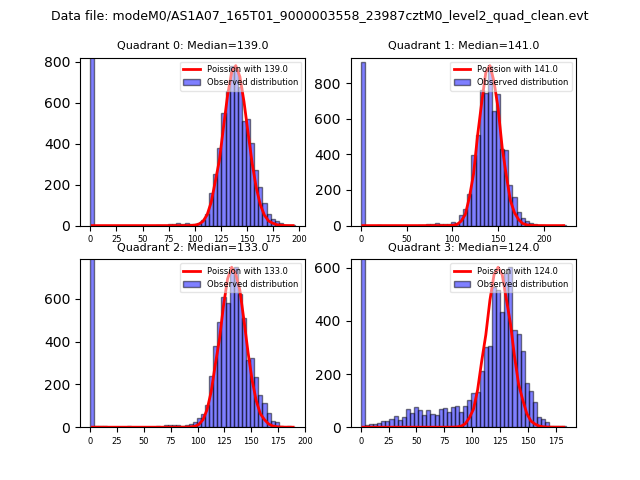 |
 |
| Quadrant-wise count rates Data is divided into 100 sec bins |
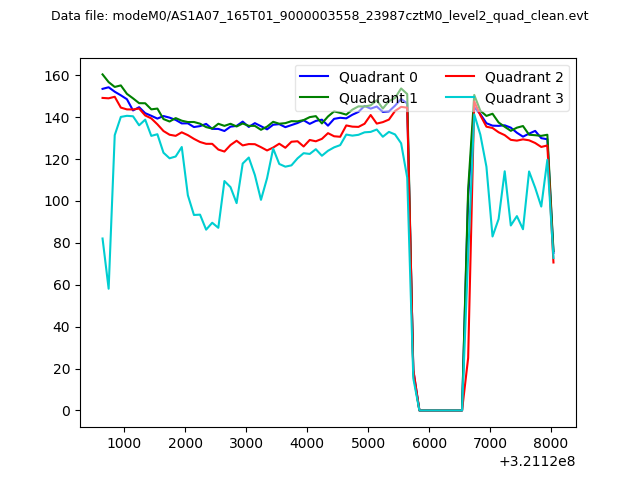 |
|
| Module-wise count rates for Quadrant A Data is divided into 100 sec bins |
 |
 |
| Module-wise count rates for Quadrant B Data is divided into 100 sec bins |
 |
 |
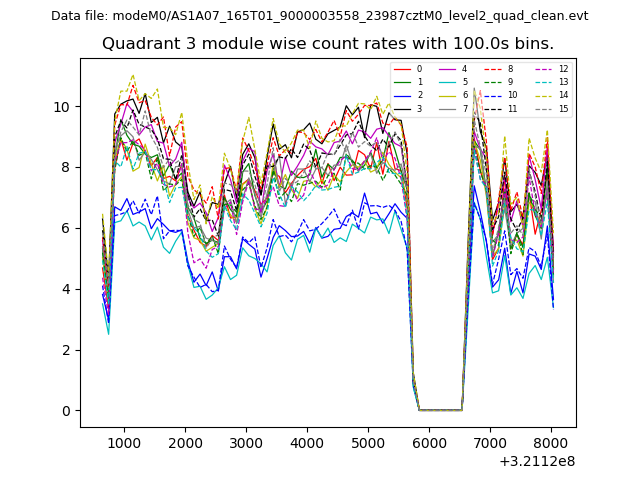
| Module-wise count rates for Quadrant C Data is divided into 100 sec bins |
 |
 |
| Module-wise count rates for Quadrant D Data is divided into 100 sec bins |
 |
 |
| Parameter | Plot |
|---|---|
| CZT HV Monitor |  |
| D_VDD | 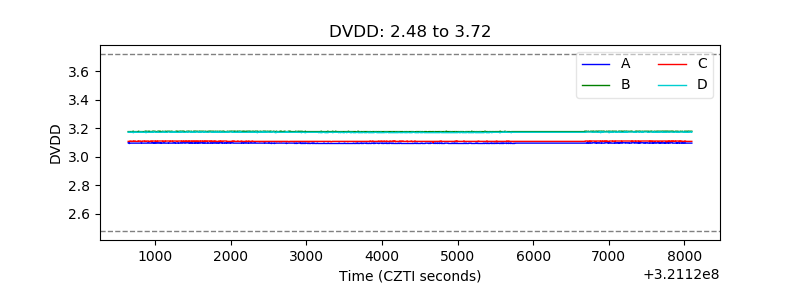 |
| Temperature 1 | 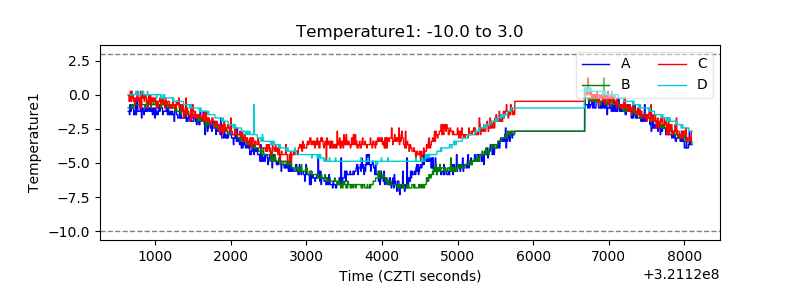 |
| Veto HV Monitor |  |
| Veto LLD | 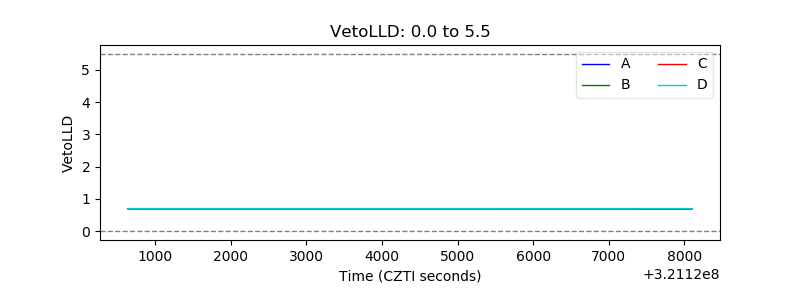 |
| Alpha Counter |  |
| _CPM_Rate | 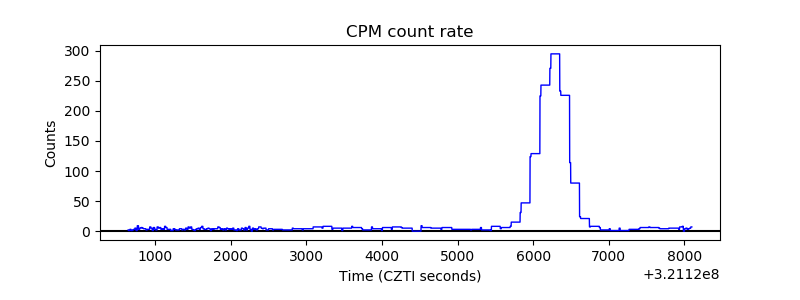 |
| CZT Counter | 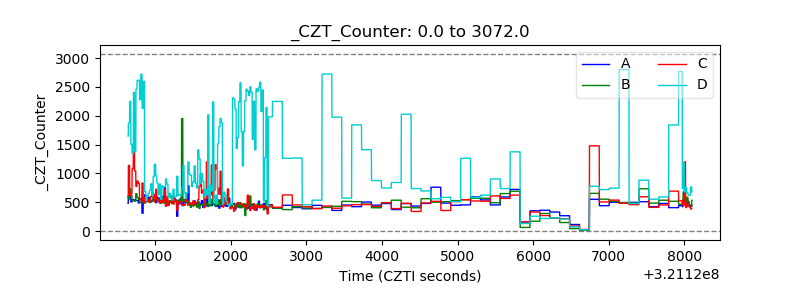 |
| +2.5 Volts monitor | 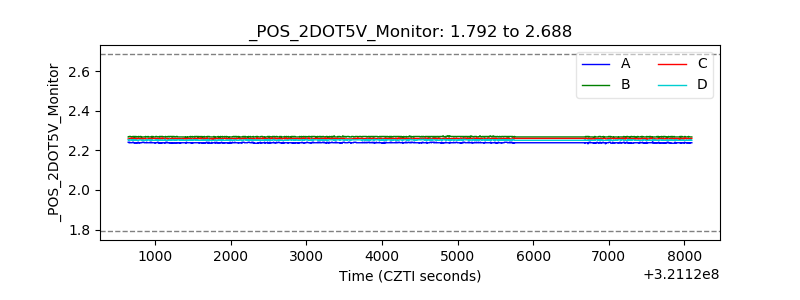 |
| +5 Volts monitor |  |
| _ROLL_ROT | 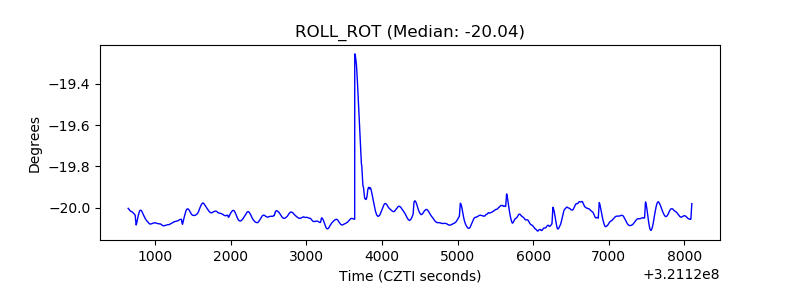 |
| _Roll_DEC |  |
| _Roll_RA | 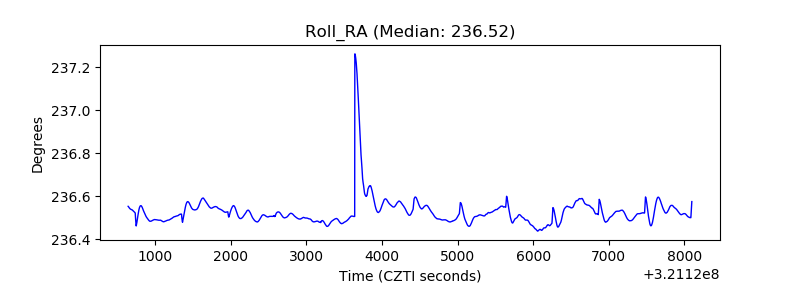 |
| Veto Counter | 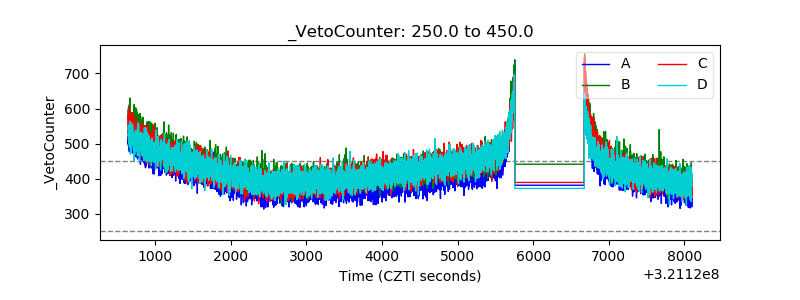 |