| Param | Original file | Final file |
|---|---|---|
| Filename | modeM0/AS1A07_165T01_9000003558_23989cztM0_level2.evt | modeM0/AS1A07_165T01_9000003558_23989cztM0_level2_quad_clean.evt |
| Size (bytes) | 677,151,360 | 136,866,240 |
| Size | 645.8 MB | 130.5 MB |
| Events in quadrant A | 3,432,835 | 965,897 |
| Events in quadrant B | 3,594,650 | 976,597 |
| Events in quadrant C | 3,699,473 | 924,307 |
| Events in quadrant D | 9,276,679 | 760,070 |
| Mode M9 | |||
|---|---|---|---|
| Quadrant | BADHDUFLAG | Total packets | Discarded packets |
| A | 0 | 6 | 0 |
| B | 0 | 7 | 0 |
| C | 0 | 7 | 0 |
| D | 0 | 7 | 0 |
| Mode M0 | |||
|---|---|---|---|
| Quadrant | BADHDUFLAG | Total packets | Discarded packets |
| A | 0 | 15203 | 2 |
| B | 0 | 15546 | 2 |
| C | 0 | 15899 | 2 |
| D | 0 | 32709 | 2 |
| Mode SS | |||
|---|---|---|---|
| Quadrant | BADHDUFLAG | Total packets | Discarded packets |
| A | 0 | 150 | 0 |
| B | 0 | 150 | 0 |
| C | 0 | 150 | 0 |
| D | 0 | 150 | 0 |
| Quadrant | Total seconds | Saturated seconds | Saturation percentage |
|---|---|---|---|
| A | 7439 | 55 | 0.739347% |
| B | 7439 | 91 | 1.223283% |
| C | 7439 | 130 | 1.747547% |
| D | 7438 | 2185 | 29.376176% |
Noise dominated data is calculated using 1-second bins in cleaned event files. If a bin has >2000 counts, and if more than 50% of those come from <1% of pixels, then it is considered to be noise-dominated and hence unusable.
| Quadrant | # 1 sec bins | Bins with >0 counts | Bins with >2000 counts | High rate bins dominated by noise | Noise dominated (total time) | Noise dominated (detector-on time) | Marked lightcurve |
|---|---|---|---|---|---|---|---|
| A | 7749 | 7441 | 0 | 0 | 0.00% | 0.00% | 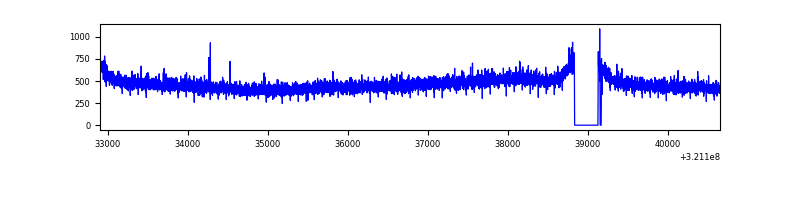 |
| B | 7749 | 7441 | 1 | 1 | 0.01% | 0.01% | 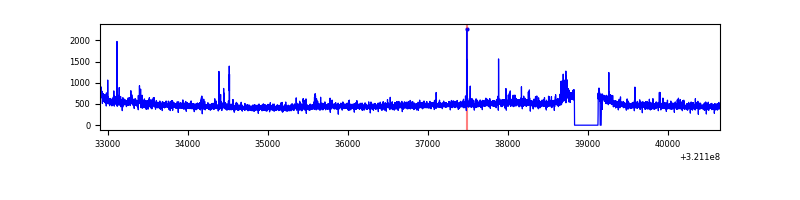 |
| C | 7749 | 7441 | 15 | 15 | 0.19% | 0.20% | 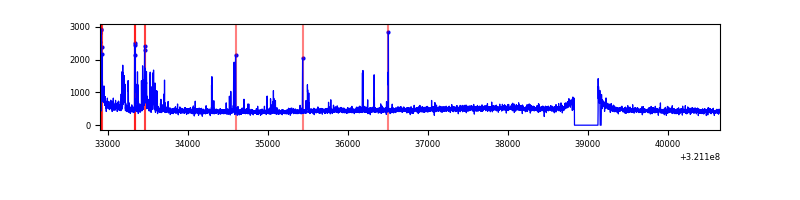 |
| D | 7748 | 7440 | 1375 | 1375 | 17.75% | 18.48% | 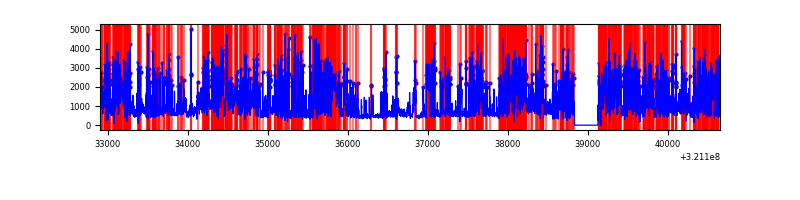 |
Top three noisy pixels from each quadrant. If the there are fewer than three noisy pixels in the level2.evt file, extra rows are filled as -1
| Pixel properties | Quadrant properties | ||||||
|---|---|---|---|---|---|---|---|
| Quadrant | DetID | PixID | Counts | Sigma | Mean | Median | Sigma |
| A | 13 | 254 | 13742 | 72.23 | 889 | 868 | 178.2 |
| A | 3 | 137 | 7732 | 38.51 | 889 | 868 | 178.2 |
| A | 0 | 226 | 7703 | 38.35 | 889 | 868 | 178.2 |
| B | 15 | 33 | 34182 | 199.96 | 888 | 869 | 166.6 |
| B | 0 | 197 | 21598 | 124.43 | 888 | 869 | 166.6 |
| B | 12 | 111 | 19214 | 110.12 | 888 | 869 | 166.6 |
| C | 0 | 10 | 237233 | 1215.53 | 841 | 845 | 194.5 |
| C | 14 | 238 | 132936 | 679.22 | 841 | 845 | 194.5 |
| C | 7 | 247 | 39380 | 198.15 | 841 | 845 | 194.5 |
| D | 12 | 218 | 4075741 | 22647.35 | 733 | 712 | 179.9 |
| D | 1 | 52 | 1290794 | 7169.75 | 733 | 712 | 179.9 |
| D | 8 | 195 | 316216 | 1753.44 | 733 | 712 | 179.9 |
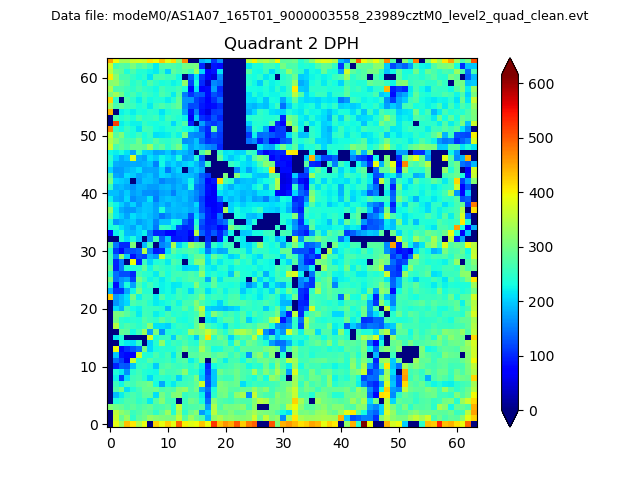
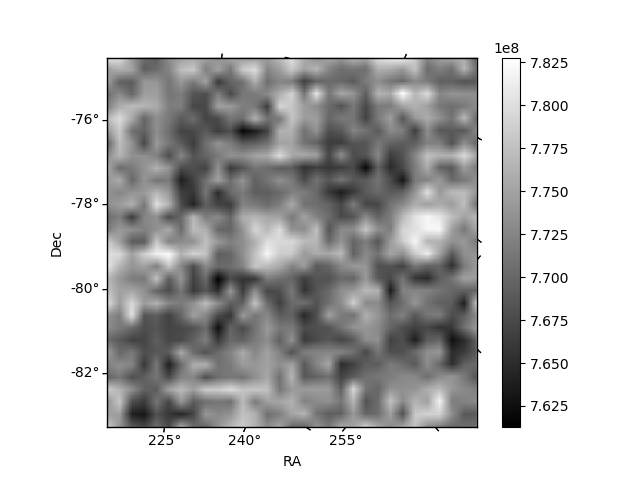
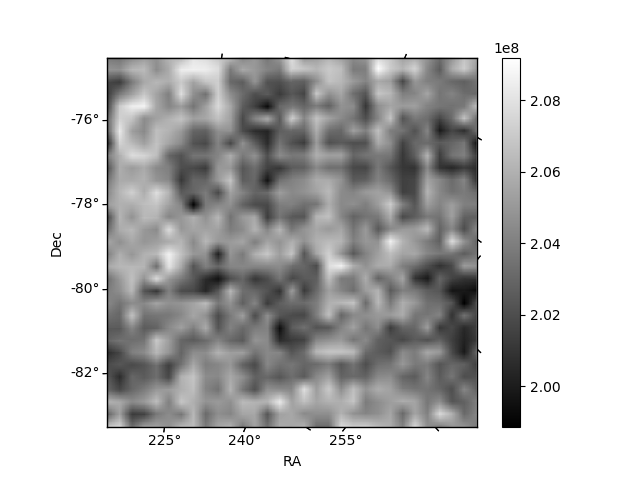
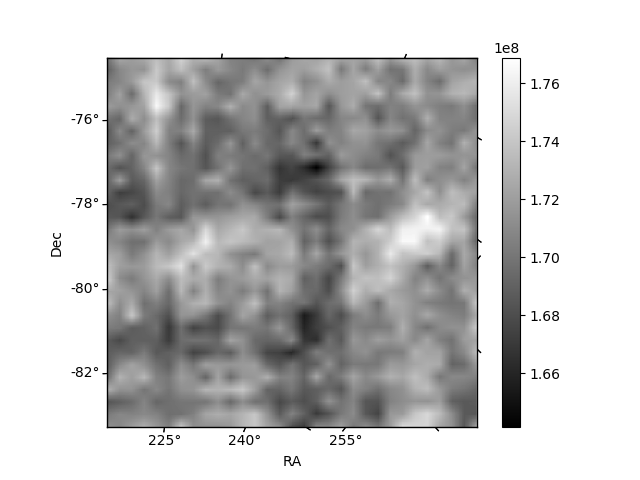
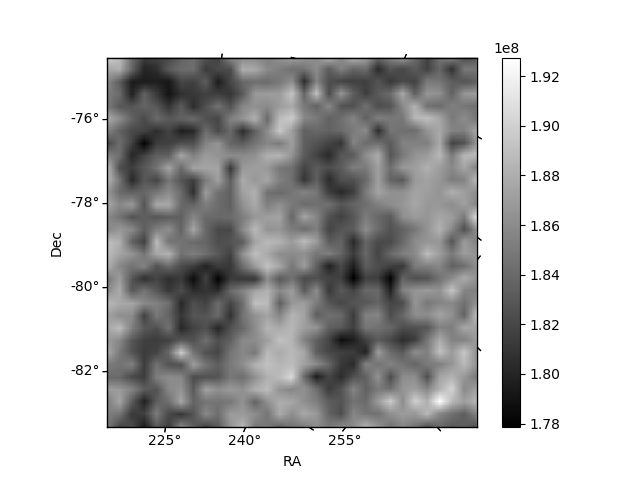
Histogram calculated using DETX and DETY for each event in the final _common_clean file
| Quadrant A | 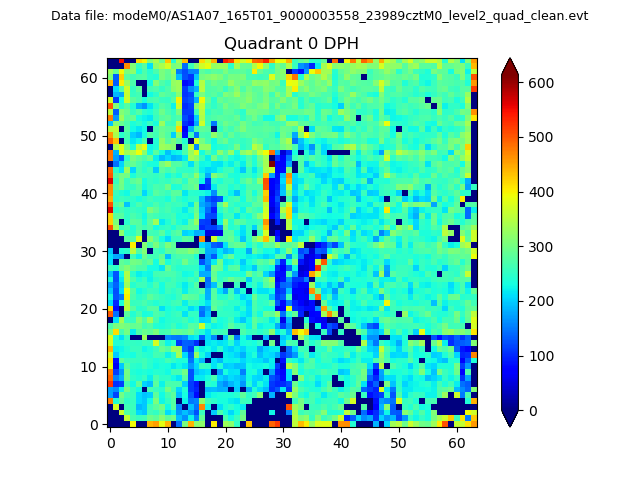 |
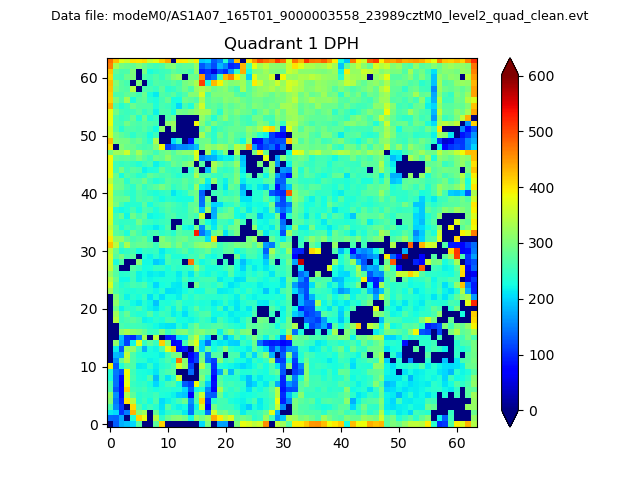 |
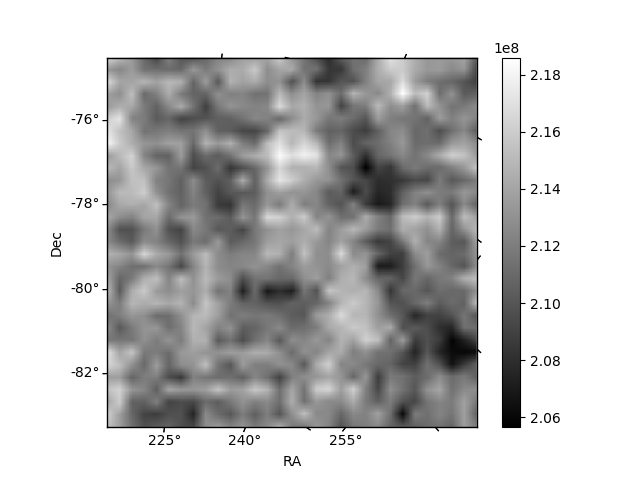
Quadrant B |
|---|---|---|---|
| Quadrant D | 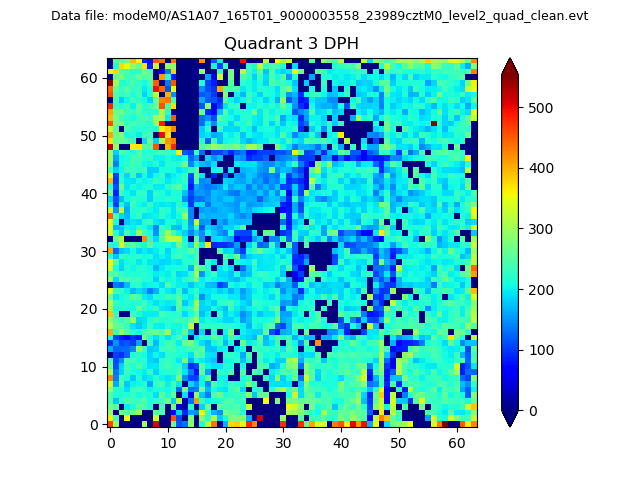 |
 |
Quadrant C |
| Plot type | Count rate plots | Images |
|---|---|---|
| Comparison with Poisson distribution Blue bars denote a histogram of data divided into 1 sec bins. Red curve is a Poisson curve with rate = median count rate of data. |
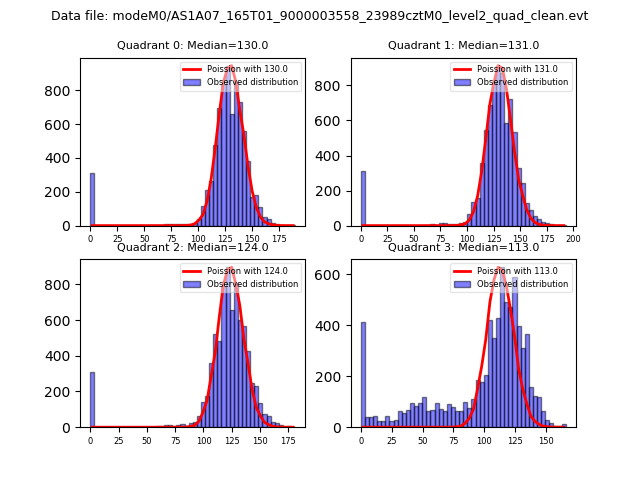 |
 |
| Quadrant-wise count rates Data is divided into 100 sec bins |
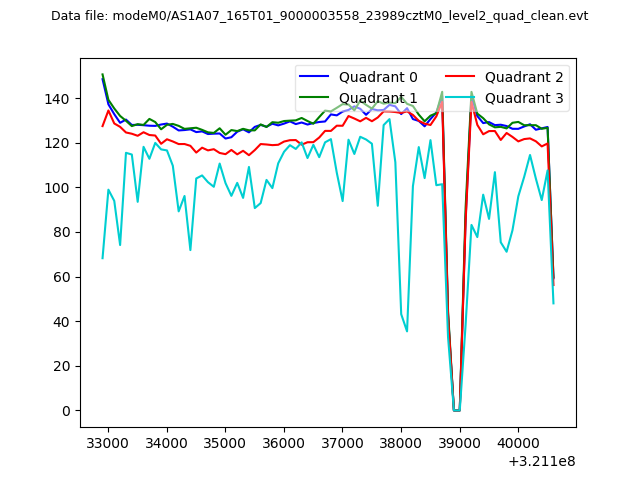 |
|
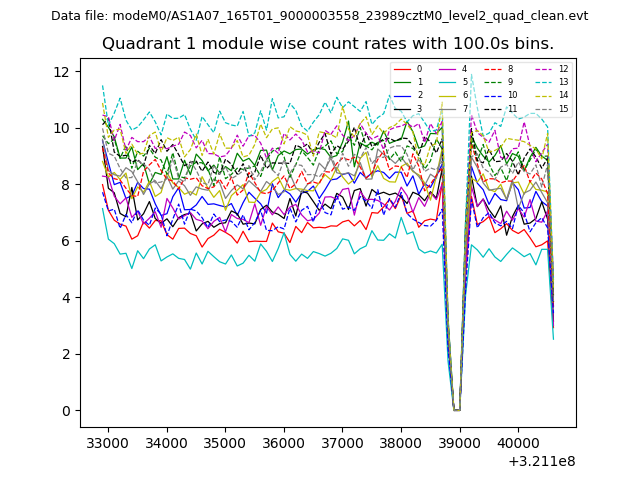
| Module-wise count rates for Quadrant A Data is divided into 100 sec bins |
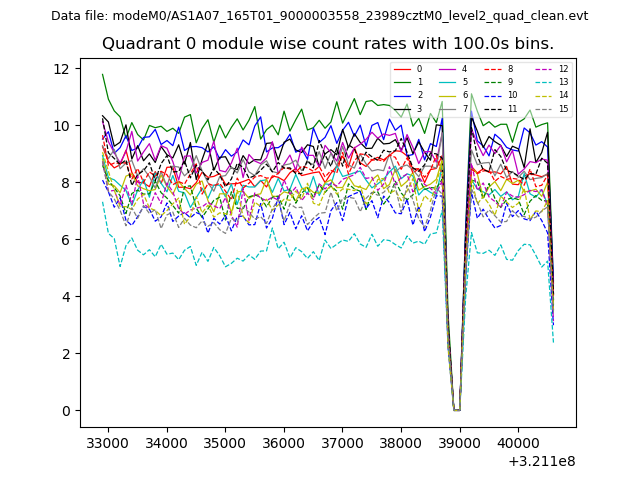 |
 |
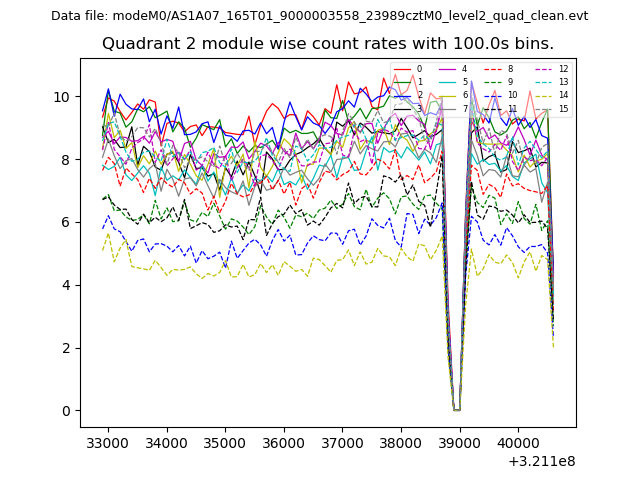
| Module-wise count rates for Quadrant B Data is divided into 100 sec bins |
 |
 |
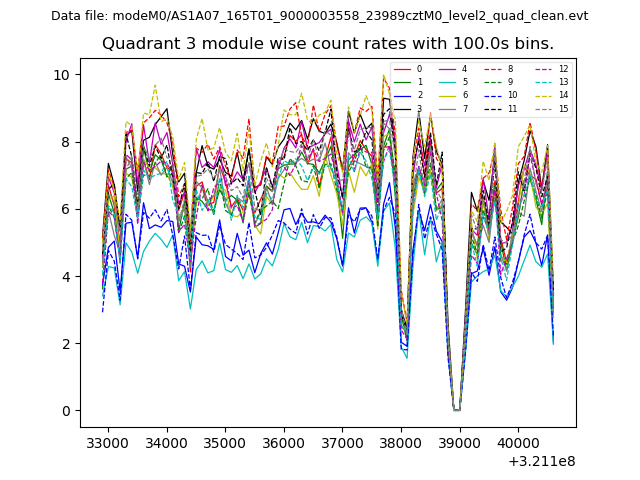
| Module-wise count rates for Quadrant C Data is divided into 100 sec bins |
 |
 |
| Module-wise count rates for Quadrant D Data is divided into 100 sec bins |
 |
 |
| Parameter | Plot |
|---|---|
| CZT HV Monitor | 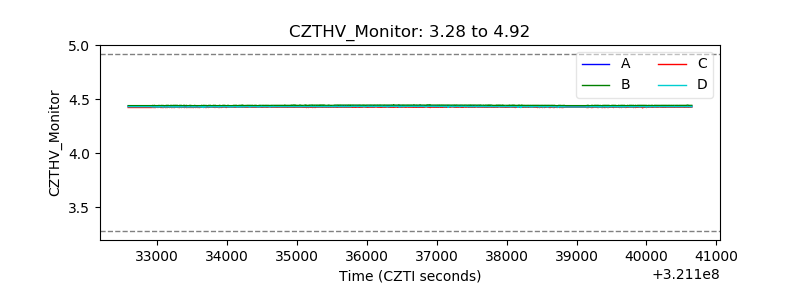 |
| D_VDD | 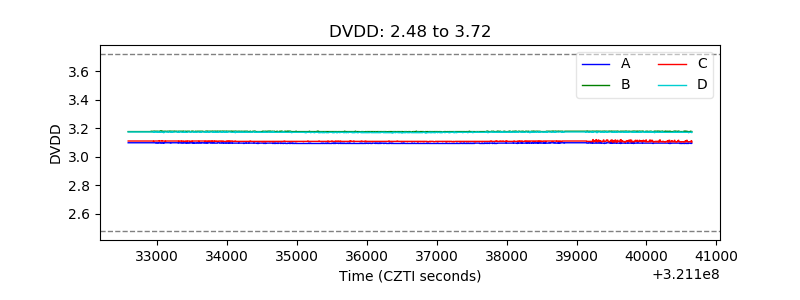 |
| Temperature 1 | 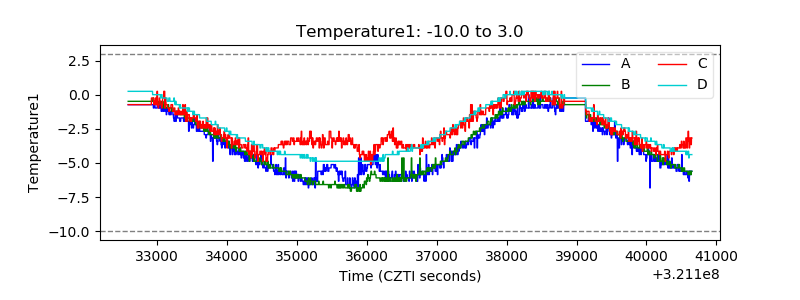 |
| Veto HV Monitor | 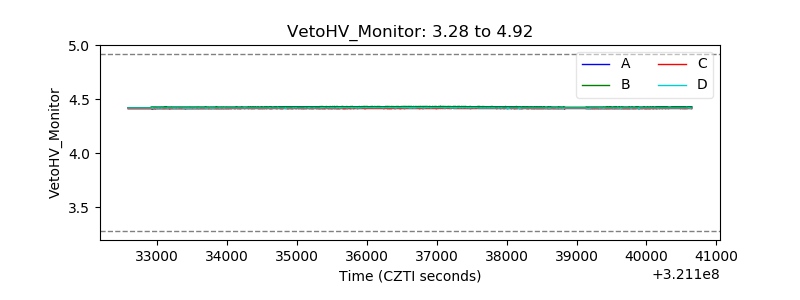 |
| Veto LLD | 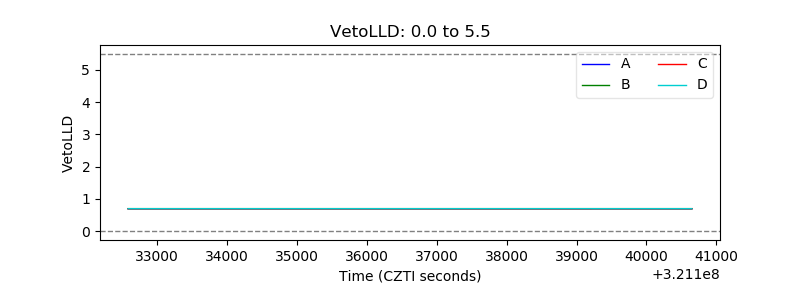 |
| Alpha Counter | 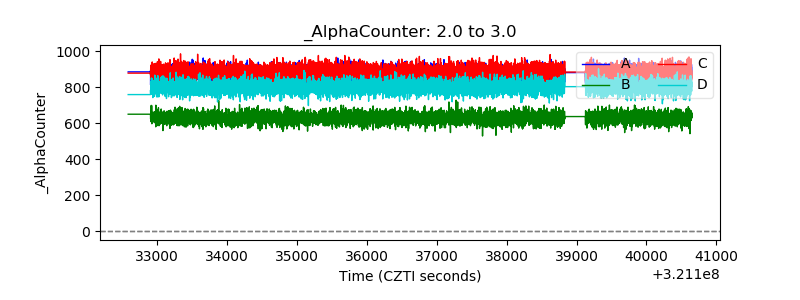 |
| _CPM_Rate | 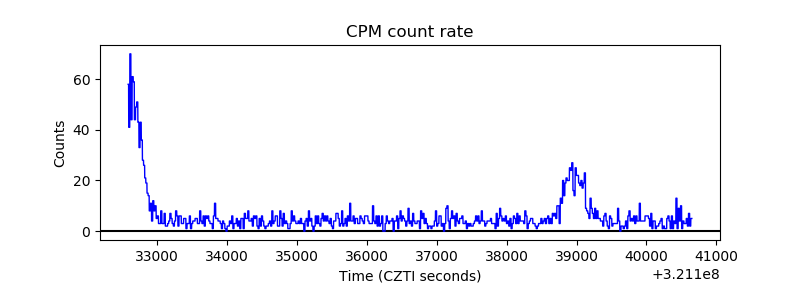 |
| CZT Counter | 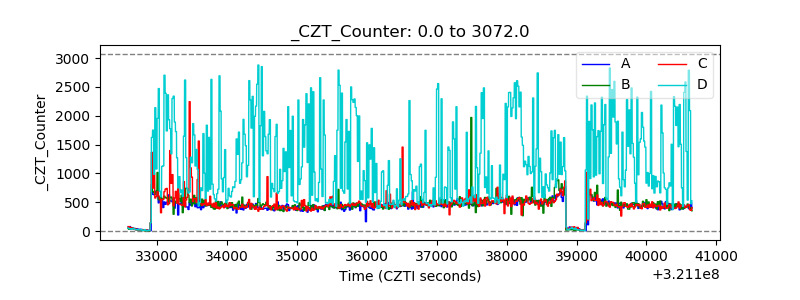 |
| +2.5 Volts monitor |  |
| +5 Volts monitor |  |
| _ROLL_ROT | 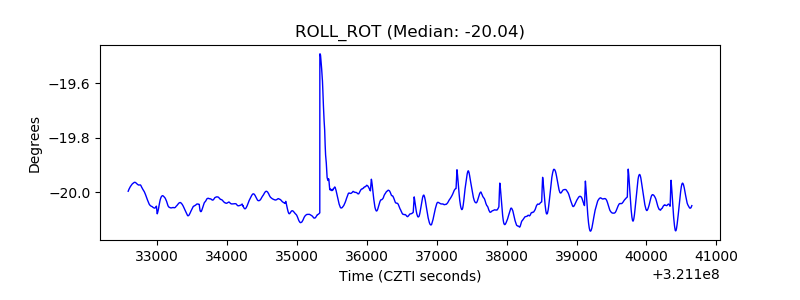 |
| _Roll_DEC | 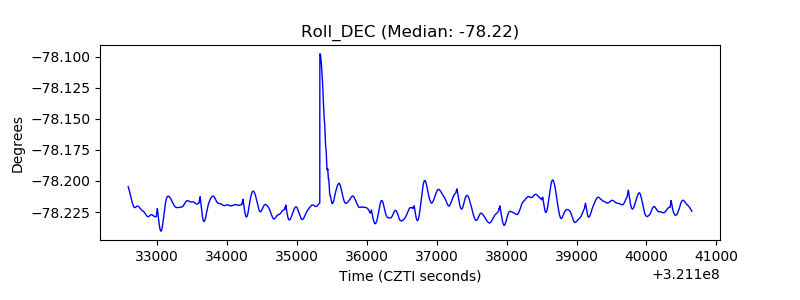 |
| _Roll_RA | 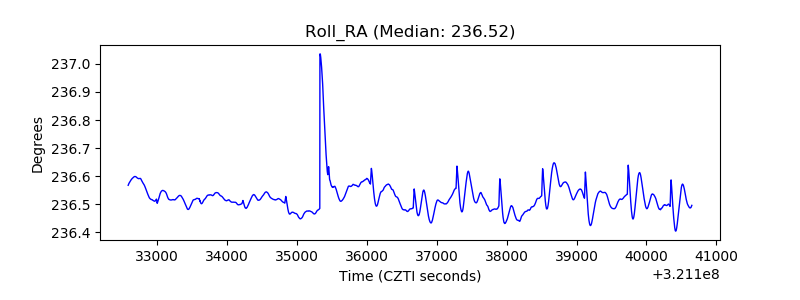 |
| Veto Counter |  |