| Param | Original file | Final file |
|---|---|---|
| Filename | modeM0/AS1A07_165T01_9000003558_23993cztM0_level2.evt | modeM0/AS1A07_165T01_9000003558_23993cztM0_level2_quad_clean.evt |
| Size (bytes) | 1,105,902,720 | 204,615,360 |
| Size | 1.0 GB | 195.1 MB |
| Events in quadrant A | 5,219,635 | 1,441,402 |
| Events in quadrant B | 5,843,268 | 1,459,514 |
| Events in quadrant C | 5,415,798 | 1,397,950 |
| Events in quadrant D | 16,243,234 | 1,107,997 |
| Mode M9 | |||
|---|---|---|---|
| Quadrant | BADHDUFLAG | Total packets | Discarded packets |
| A | 0 | 8 | 0 |
| B | 0 | 9 | 0 |
| C | 0 | 9 | 0 |
| D | 0 | 9 | 0 |
| Mode M0 | |||
|---|---|---|---|
| Quadrant | BADHDUFLAG | Total packets | Discarded packets |
| A | 0 | 23165 | 2 |
| B | 0 | 24928 | 2 |
| C | 0 | 23414 | 2 |
| D | 0 | 56109 | 2 |
| Mode SS | |||
|---|---|---|---|
| Quadrant | BADHDUFLAG | Total packets | Discarded packets |
| A | 0 | 232 | 0 |
| B | 0 | 232 | 0 |
| C | 0 | 232 | 0 |
| D | 0 | 232 | 0 |
| Quadrant | Total seconds | Saturated seconds | Saturation percentage |
|---|---|---|---|
| A | 11405 | 51 | 0.447172% |
| B | 11405 | 157 | 1.376589% |
| C | 11405 | 118 | 1.034634% |
| D | 11405 | 4058 | 35.580886% |
Noise dominated data is calculated using 1-second bins in cleaned event files. If a bin has >2000 counts, and if more than 50% of those come from <1% of pixels, then it is considered to be noise-dominated and hence unusable.
| Quadrant | # 1 sec bins | Bins with >0 counts | Bins with >2000 counts | High rate bins dominated by noise | Noise dominated (total time) | Noise dominated (detector-on time) | Marked lightcurve |
|---|---|---|---|---|---|---|---|
| A | 11925 | 11406 | 1 | 1 | 0.01% | 0.01% | 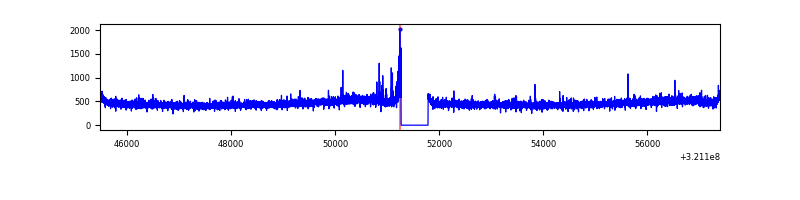 |
| B | 11925 | 11406 | 39 | 39 | 0.33% | 0.34% | 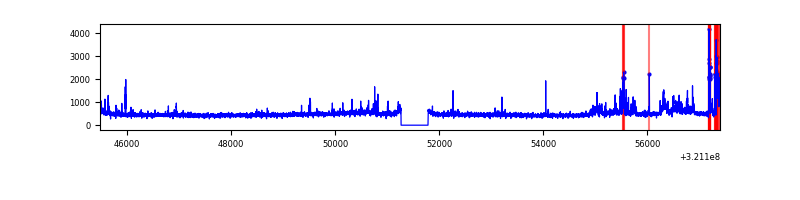 |
| C | 11925 | 11406 | 3 | 3 | 0.03% | 0.03% | 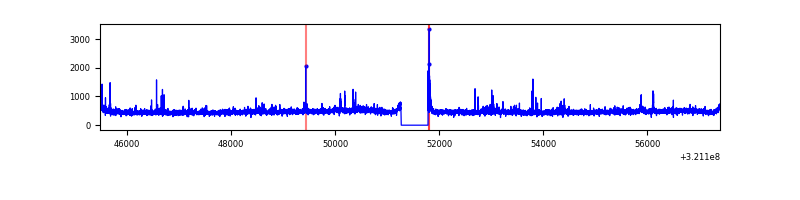 |
| D | 11925 | 11406 | 2992 | 2992 | 25.09% | 26.23% | 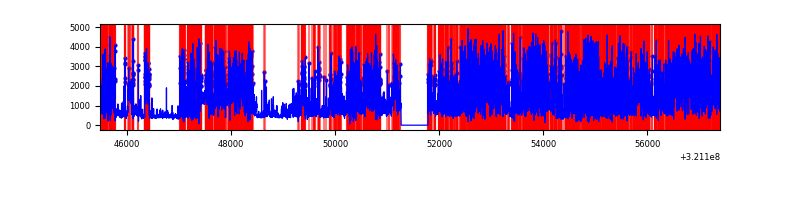 |
Top three noisy pixels from each quadrant. If the there are fewer than three noisy pixels in the level2.evt file, extra rows are filled as -1
| Pixel properties | Quadrant properties | ||||||
|---|---|---|---|---|---|---|---|
| Quadrant | DetID | PixID | Counts | Sigma | Mean | Median | Sigma |
| A | 6 | 16 | 43092 | 154.22 | 1342 | 1313 | 270.9 |
| A | 13 | 254 | 18891 | 64.88 | 1342 | 1313 | 270.9 |
| A | 3 | 137 | 11582 | 37.91 | 1342 | 1313 | 270.9 |
| B | 0 | 197 | 514282 | 2049.29 | 1334 | 1300 | 250.3 |
| B | 12 | 111 | 30273 | 115.74 | 1334 | 1300 | 250.3 |
| B | 11 | 111 | 26430 | 100.39 | 1334 | 1300 | 250.3 |
| C | 14 | 238 | 204877 | 684.56 | 1284 | 1292 | 297.4 |
| C | 0 | 239 | 122721 | 408.31 | 1284 | 1292 | 297.4 |
| C | 0 | 10 | 78962 | 261.17 | 1284 | 1292 | 297.4 |
| D | 12 | 218 | 10131333 | 38505.81 | 1095 | 1060 | 263.1 |
| D | 7 | 223 | 473344 | 1795.18 | 1095 | 1060 | 263.1 |
| D | 12 | 250 | 420004 | 1592.43 | 1095 | 1060 | 263.1 |
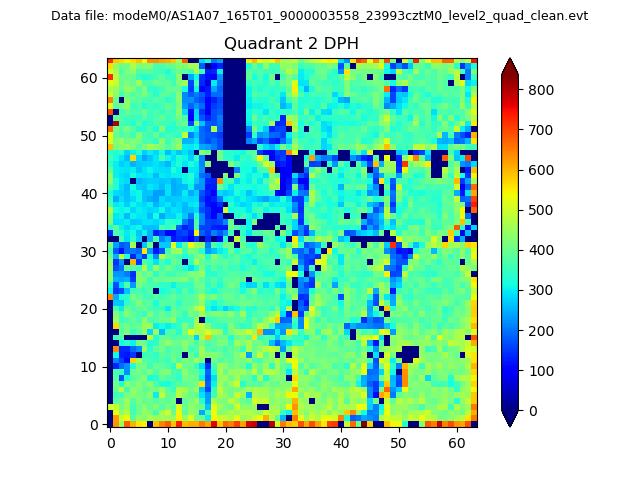
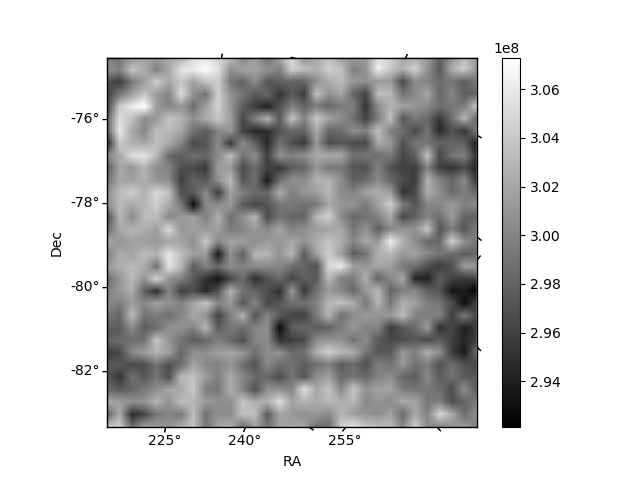
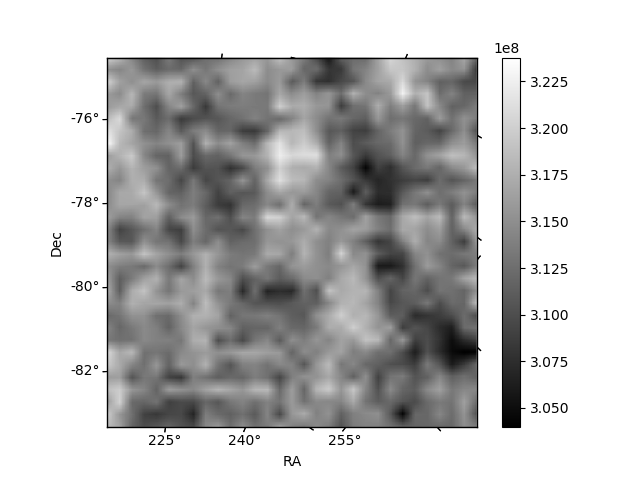
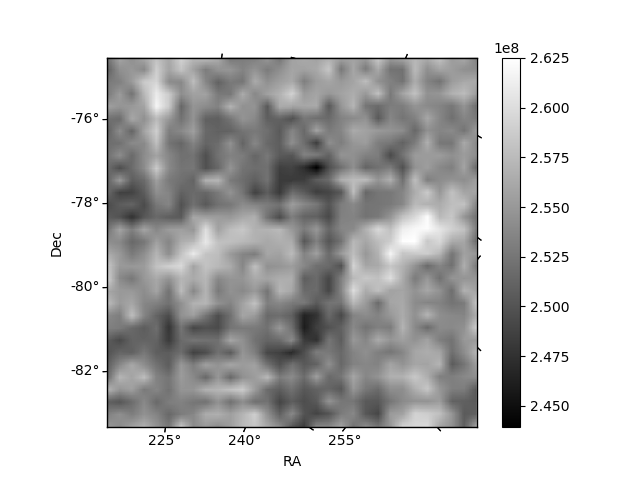
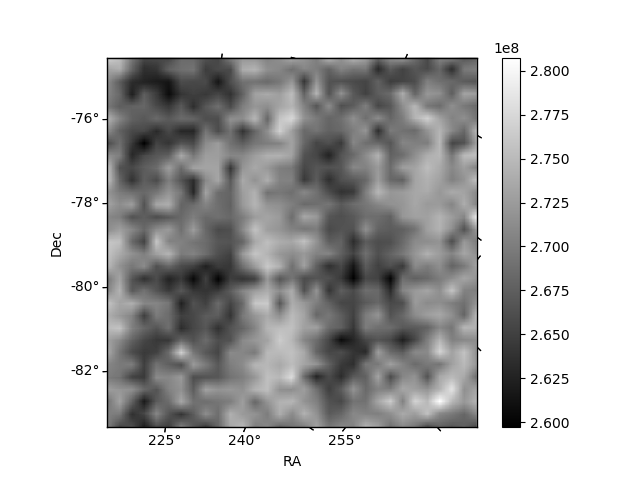
Histogram calculated using DETX and DETY for each event in the final _common_clean file
| Quadrant A | 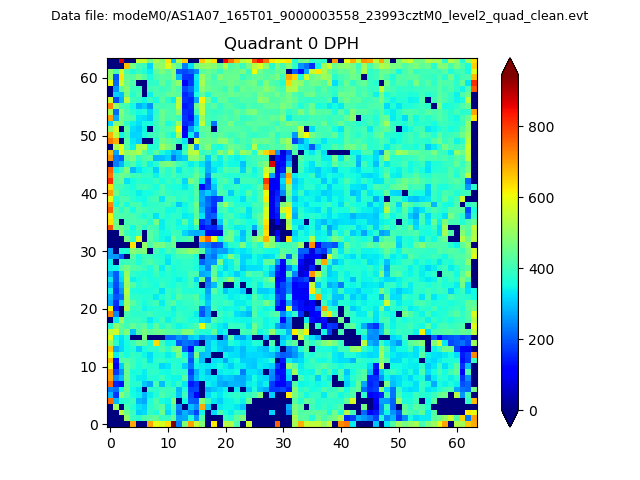 |
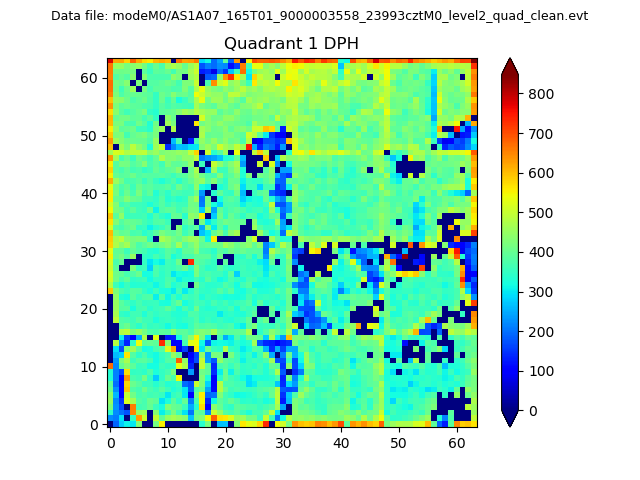 |
Quadrant B |
|---|---|---|---|
| Quadrant D | 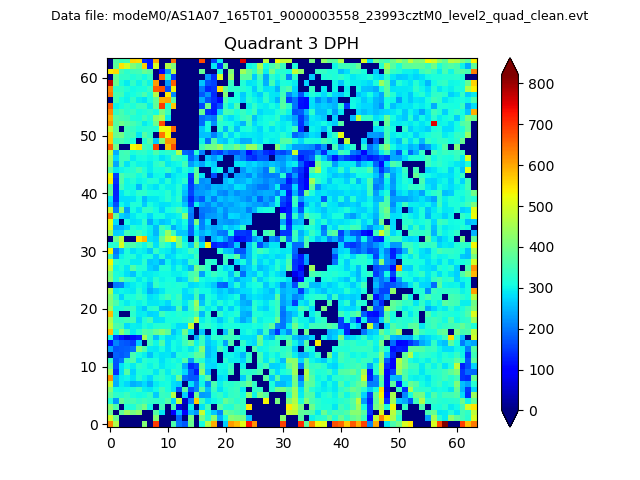 |
 |
Quadrant C |
| Plot type | Count rate plots | Images |
|---|---|---|
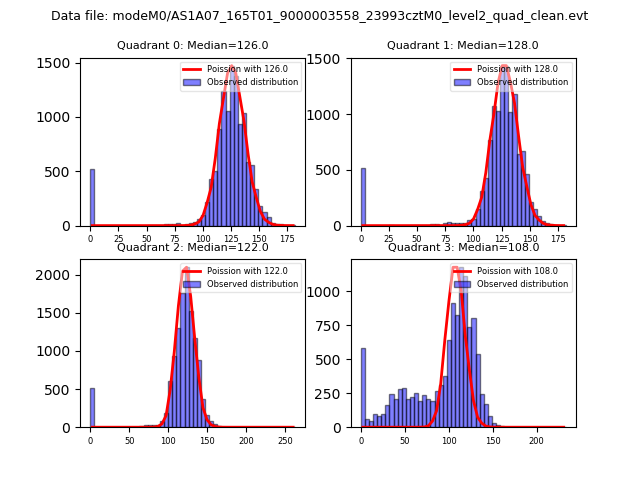
| Comparison with Poisson distribution Blue bars denote a histogram of data divided into 1 sec bins. Red curve is a Poisson curve with rate = median count rate of data. |
 |
 |
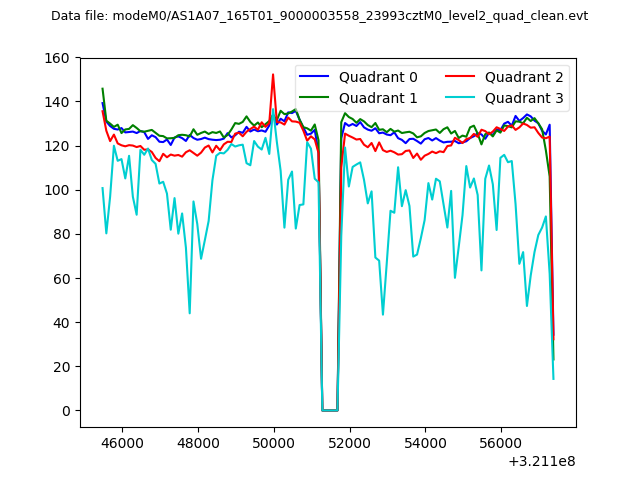
| Quadrant-wise count rates Data is divided into 100 sec bins |
 |
|
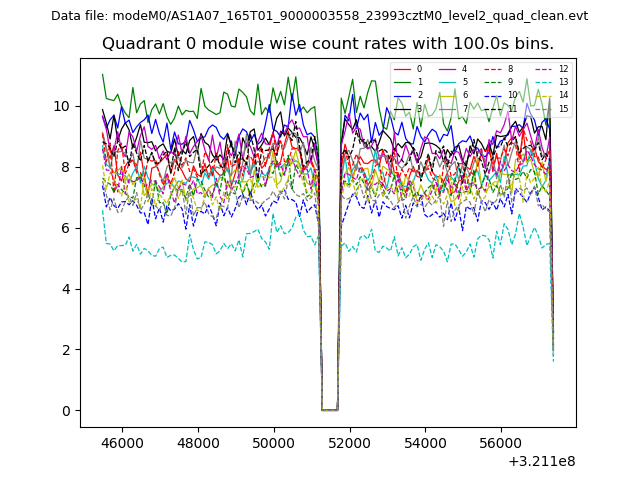
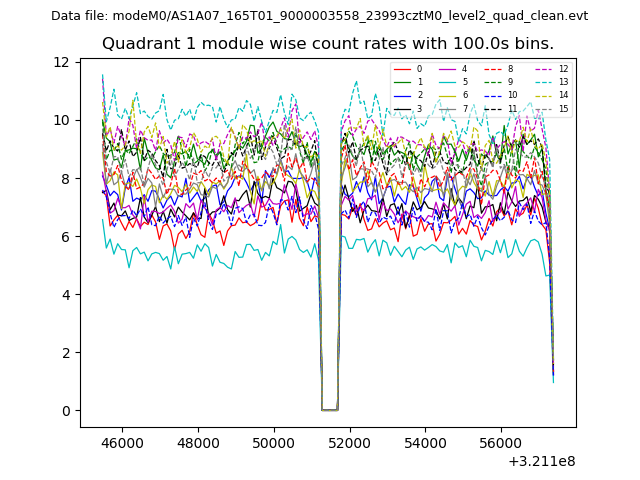
| Module-wise count rates for Quadrant A Data is divided into 100 sec bins |
 |
 |
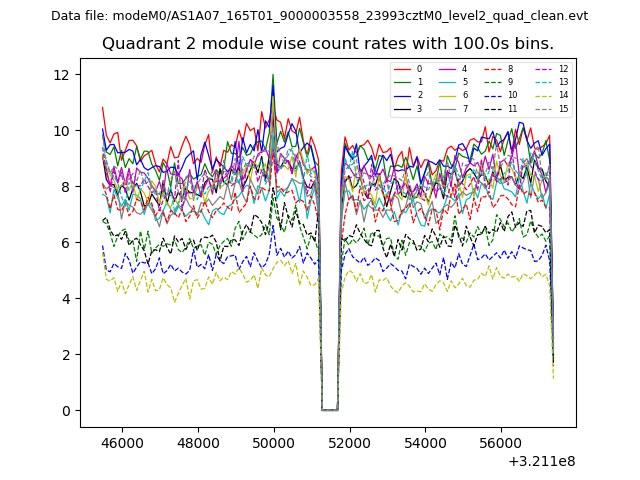
| Module-wise count rates for Quadrant B Data is divided into 100 sec bins |
 |
 |
| Module-wise count rates for Quadrant C Data is divided into 100 sec bins |
 |
 |
| Module-wise count rates for Quadrant D Data is divided into 100 sec bins |
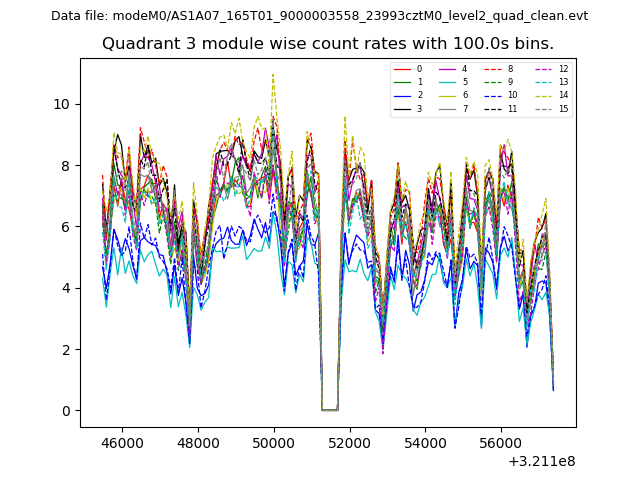 |
 |
| Parameter | Plot |
|---|---|
| CZT HV Monitor | 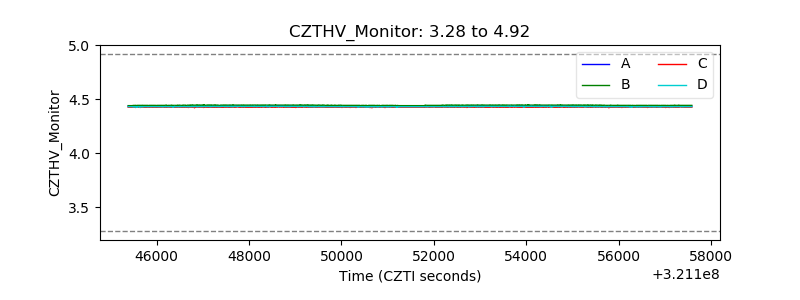 |
| D_VDD | 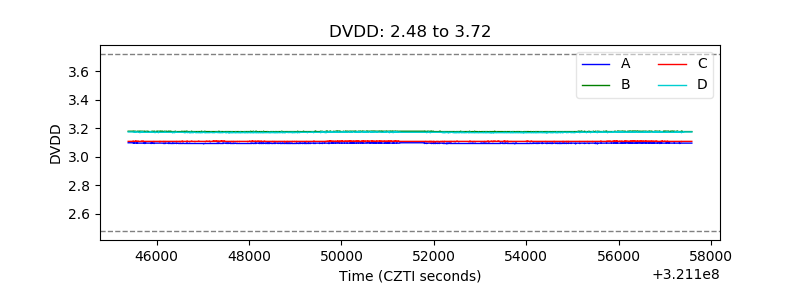 |
| Temperature 1 | 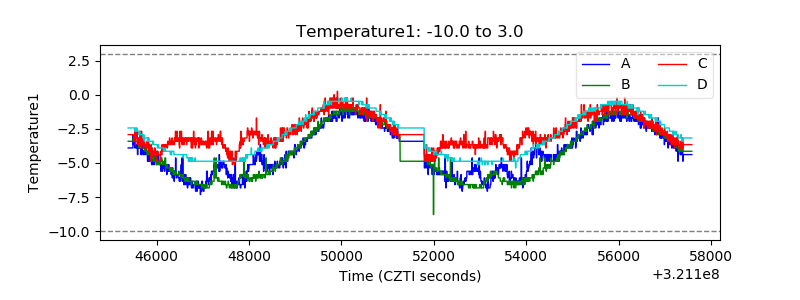 |
| Veto HV Monitor | 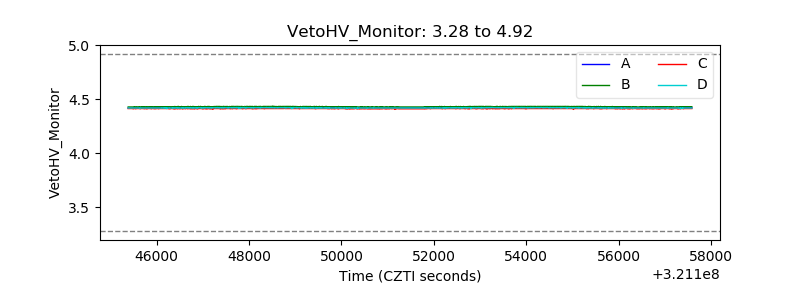 |
| Veto LLD | 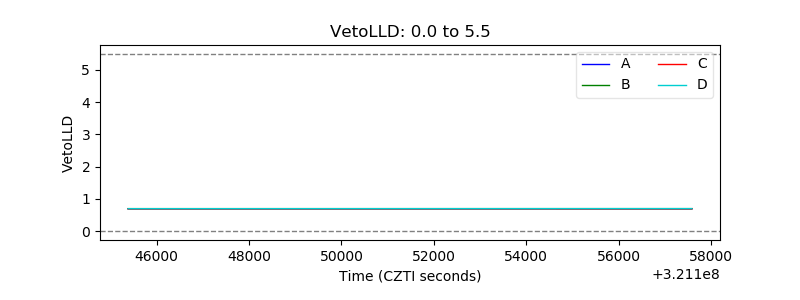 |
| Alpha Counter | 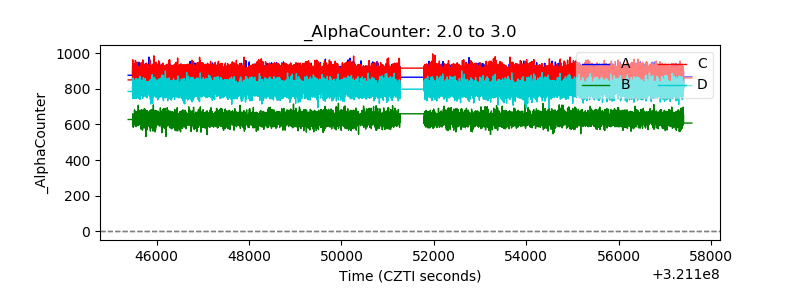 |
| _CPM_Rate | 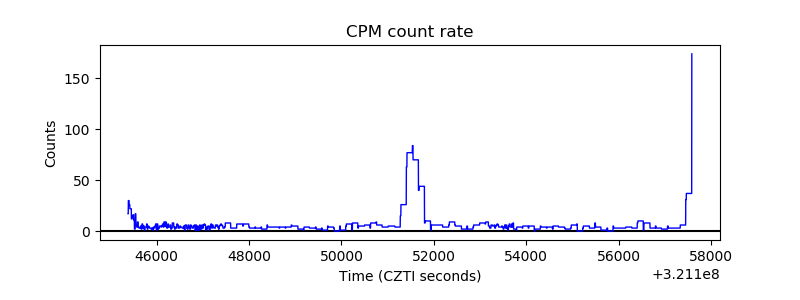 |
| CZT Counter | 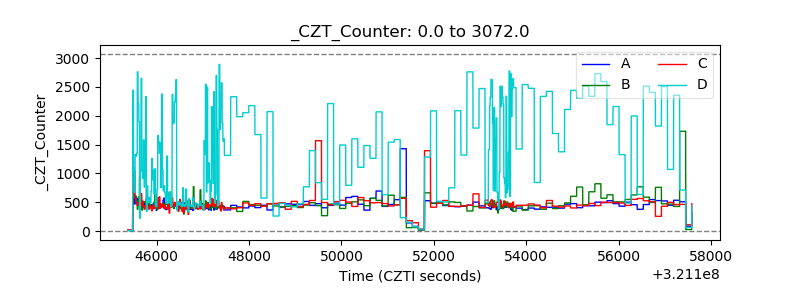 |
| +2.5 Volts monitor | 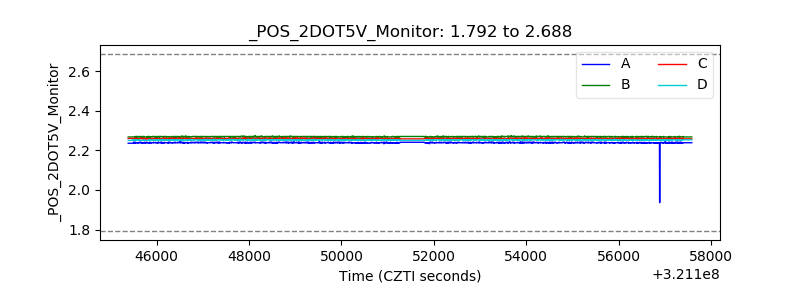 |
| +5 Volts monitor | 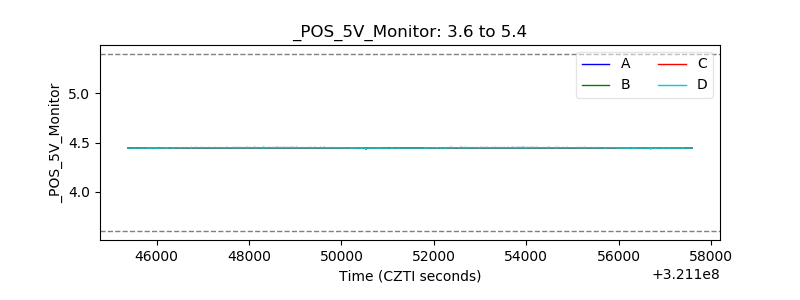 |
| _ROLL_ROT | 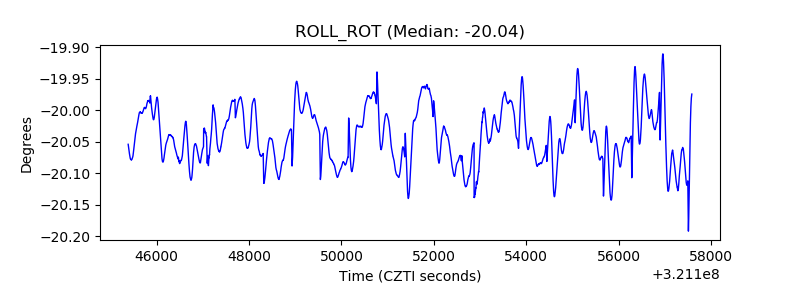 |
| _Roll_DEC | 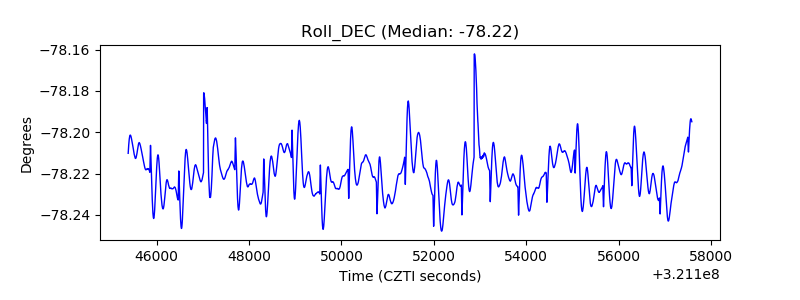 |
| _Roll_RA | 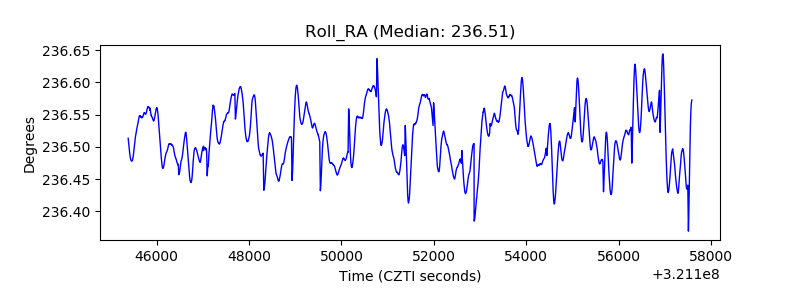 |
| Veto Counter | 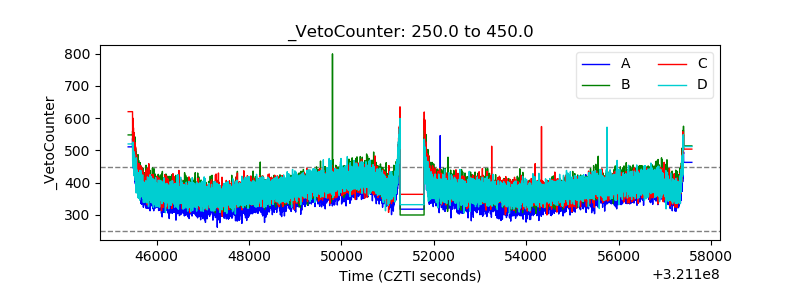 |