| Param | Original file | Final file |
|---|---|---|
| Filename | modeM0/AS1A07_165T01_9000003558_23994cztM0_level2.evt | modeM0/AS1A07_165T01_9000003558_23994cztM0_level2_quad_clean.evt |
| Size (bytes) | 1,142,409,600 | 239,448,960 |
| Size | 1.1 GB | 228.4 MB |
| Events in quadrant A | 5,932,117 | 1,661,217 |
| Events in quadrant B | 6,778,211 | 1,683,745 |
| Events in quadrant C | 6,228,045 | 1,616,311 |
| Events in quadrant D | 14,796,962 | 1,407,795 |
| Mode M9 | |||
|---|---|---|---|
| Quadrant | BADHDUFLAG | Total packets | Discarded packets |
| A | 0 | 24 | 0 |
| B | 0 | 24 | 0 |
| C | 0 | 24 | 0 |
| D | 0 | 24 | 0 |
| Mode M0 | |||
|---|---|---|---|
| Quadrant | BADHDUFLAG | Total packets | Discarded packets |
| A | 0 | 25880 | 3 |
| B | 0 | 28259 | 3 |
| C | 0 | 26602 | 5 |
| D | 0 | 52763 | 3 |
| Mode SS | |||
|---|---|---|---|
| Quadrant | BADHDUFLAG | Total packets | Discarded packets |
| A | 0 | 264 | 0 |
| B | 0 | 264 | 0 |
| C | 0 | 264 | 0 |
| D | 0 | 264 | 0 |
| Quadrant | Total seconds | Saturated seconds | Saturation percentage |
|---|---|---|---|
| A | 12764 | 52 | 0.407396% |
| B | 12765 | 242 | 1.895809% |
| C | 12764 | 219 | 1.715763% |
| D | 12764 | 2661 | 20.847697% |
Noise dominated data is calculated using 1-second bins in cleaned event files. If a bin has >2000 counts, and if more than 50% of those come from <1% of pixels, then it is considered to be noise-dominated and hence unusable.
| Quadrant | # 1 sec bins | Bins with >0 counts | Bins with >2000 counts | High rate bins dominated by noise | Noise dominated (total time) | Noise dominated (detector-on time) | Marked lightcurve |
|---|---|---|---|---|---|---|---|
| A | 15239 | 12767 | 0 | 0 | 0.00% | 0.00% | 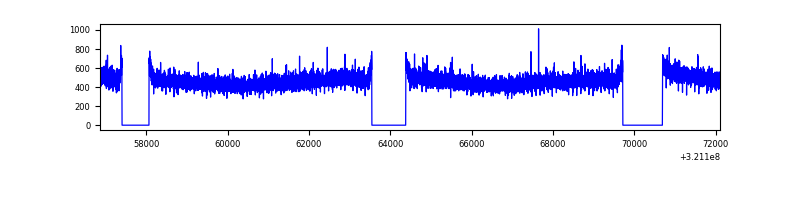 |
| B | 15240 | 12768 | 75 | 75 | 0.49% | 0.59% | 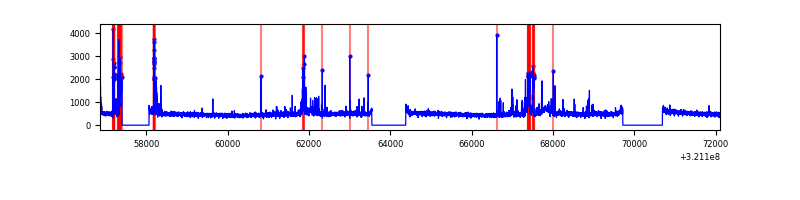 |
| C | 15239 | 12767 | 17 | 17 | 0.11% | 0.13% | 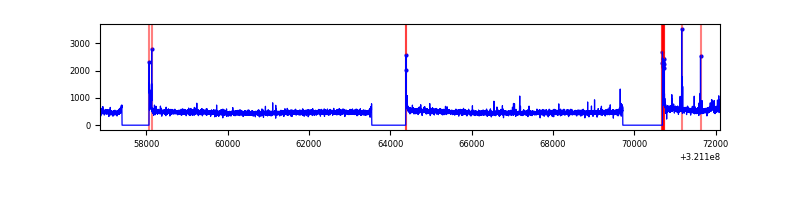 |
| D | 15239 | 12766 | 1929 | 1929 | 12.66% | 15.11% | 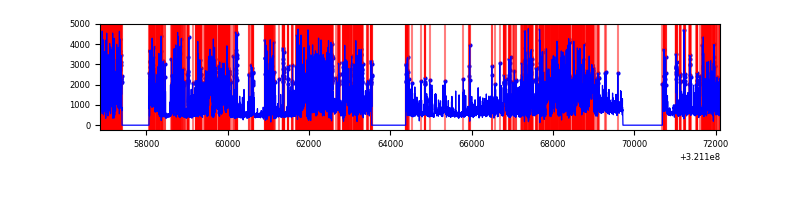 |
Top three noisy pixels from each quadrant. If the there are fewer than three noisy pixels in the level2.evt file, extra rows are filled as -1
| Pixel properties | Quadrant properties | ||||||
|---|---|---|---|---|---|---|---|
| Quadrant | DetID | PixID | Counts | Sigma | Mean | Median | Sigma |
| A | 13 | 254 | 19972 | 59.95 | 1539 | 1508 | 308.0 |
| A | 3 | 137 | 13419 | 38.67 | 1539 | 1508 | 308.0 |
| A | 0 | 226 | 13295 | 38.27 | 1539 | 1508 | 308.0 |
| B | 0 | 197 | 696698 | 2424.77 | 1530 | 1491 | 286.7 |
| B | 12 | 111 | 34761 | 116.04 | 1530 | 1491 | 286.7 |
| B | 11 | 111 | 30586 | 101.48 | 1530 | 1491 | 286.7 |
| C | 14 | 238 | 235975 | 683.51 | 1481 | 1492 | 343.1 |
| C | 0 | 10 | 127867 | 368.38 | 1481 | 1492 | 343.1 |
| C | 3 | 233 | 39839 | 111.78 | 1481 | 1492 | 343.1 |
| D | 12 | 218 | 8295983 | 24985.56 | 1371 | 1330 | 332.0 |
| D | 8 | 195 | 434888 | 1305.98 | 1371 | 1330 | 332.0 |
| D | 1 | 52 | 238358 | 713.99 | 1371 | 1330 | 332.0 |
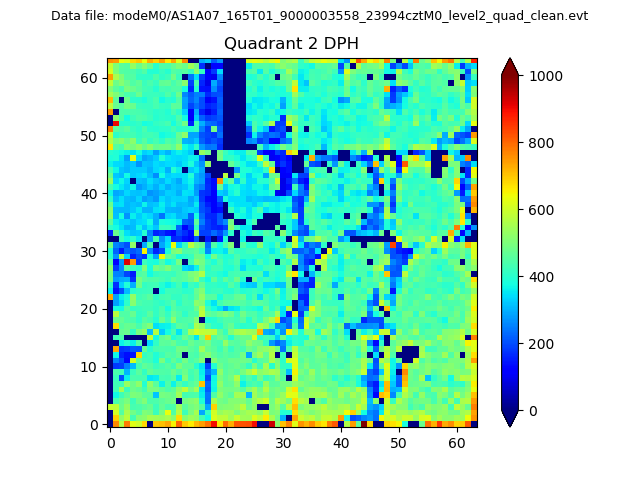
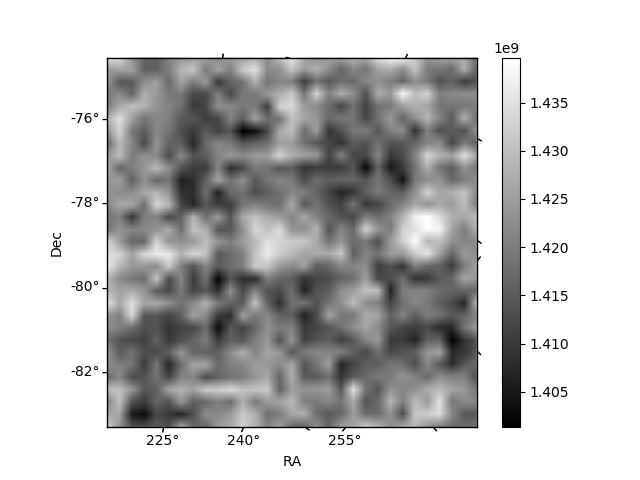
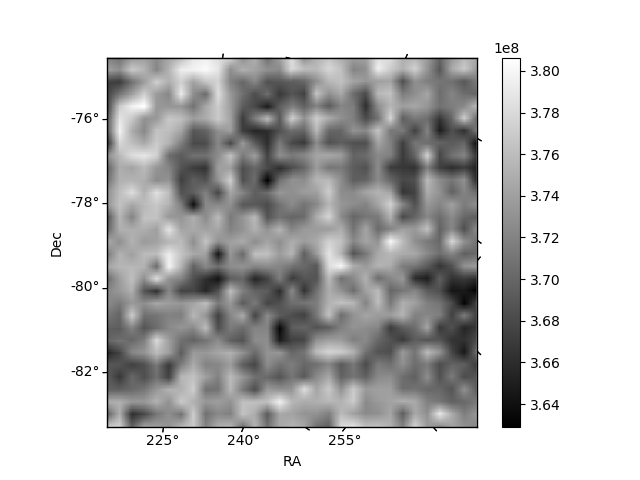
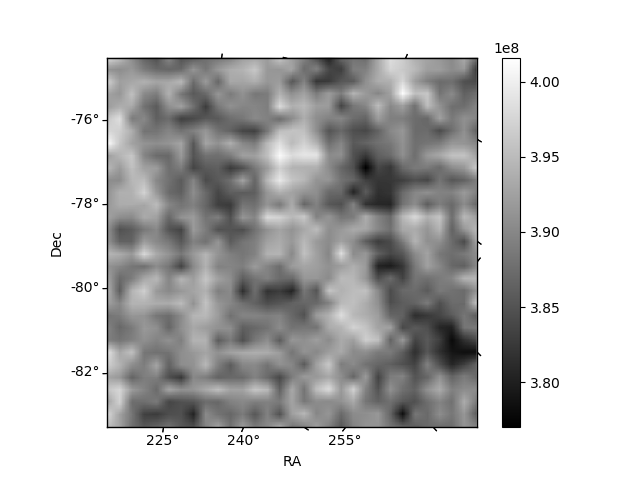
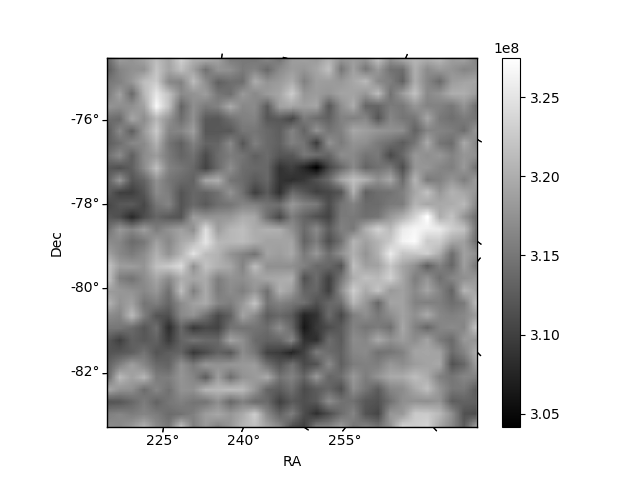
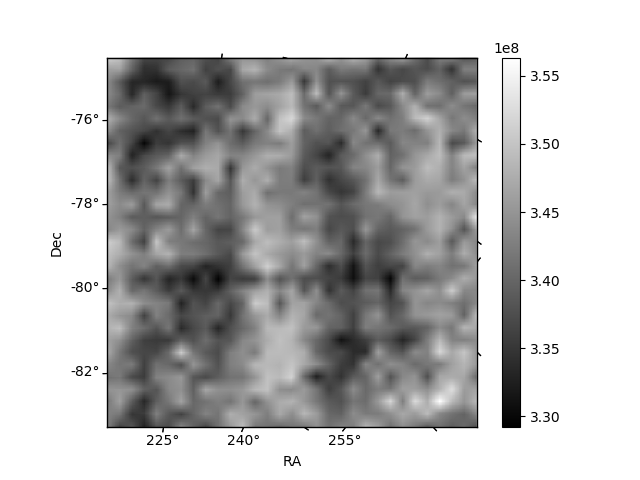
Histogram calculated using DETX and DETY for each event in the final _common_clean file
| Quadrant A | 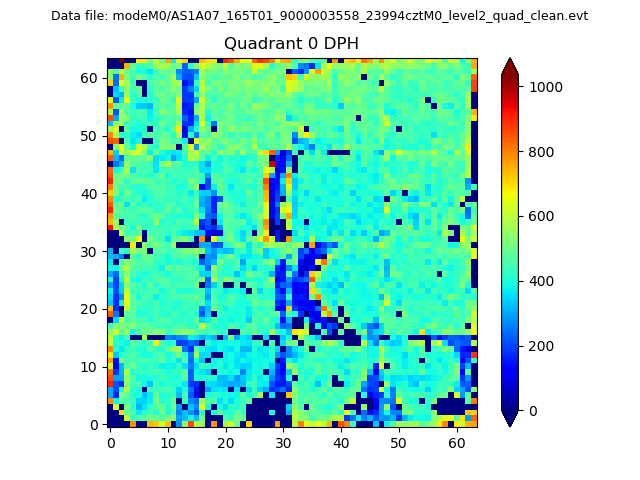 |
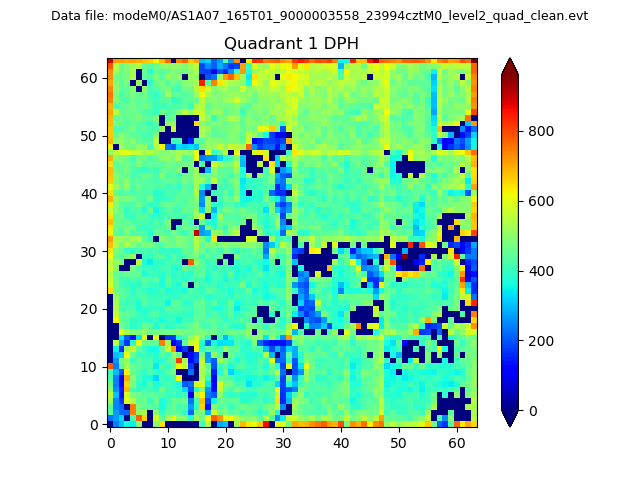 |
Quadrant B |
|---|---|---|---|
| Quadrant D | 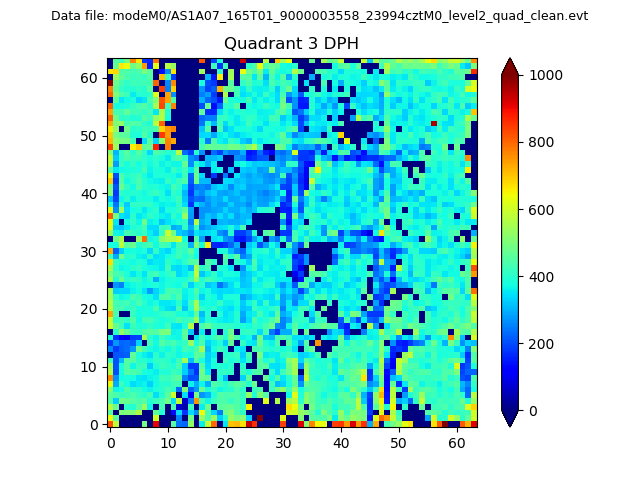 |
 |
Quadrant C |
| Plot type | Count rate plots | Images |
|---|---|---|
| Comparison with Poisson distribution Blue bars denote a histogram of data divided into 1 sec bins. Red curve is a Poisson curve with rate = median count rate of data. |
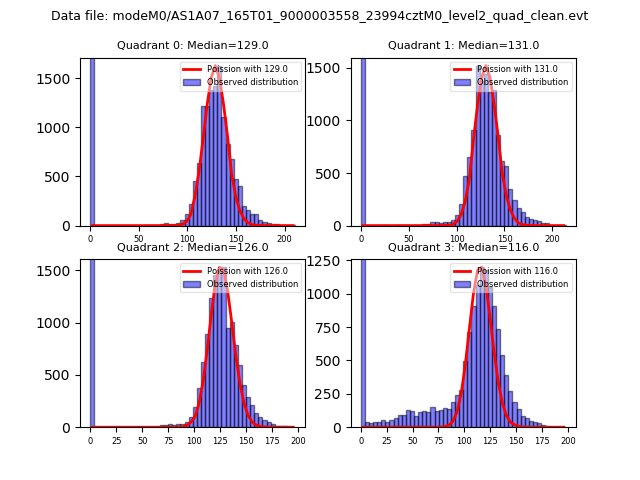 |
 |
| Quadrant-wise count rates Data is divided into 100 sec bins |
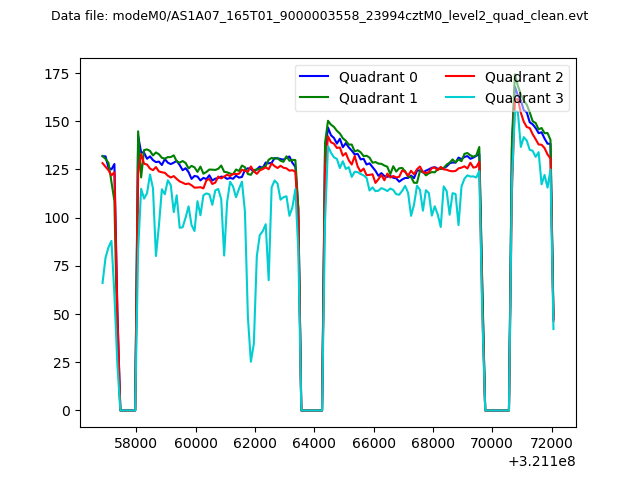 |
|
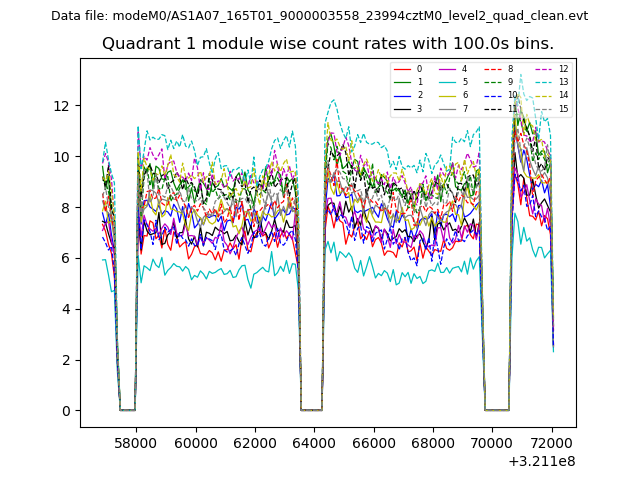
| Module-wise count rates for Quadrant A Data is divided into 100 sec bins |
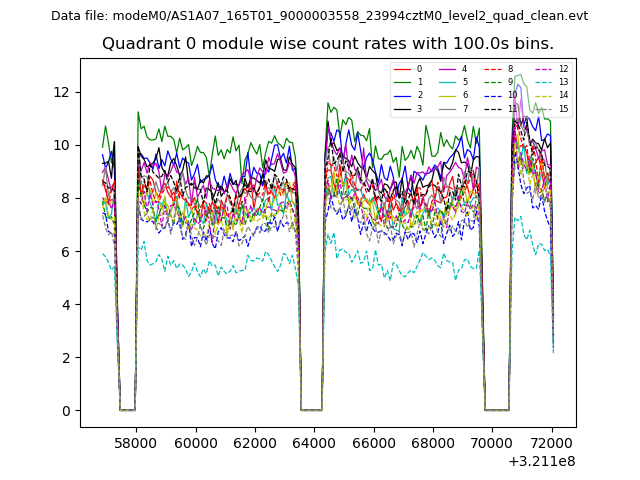 |
 |
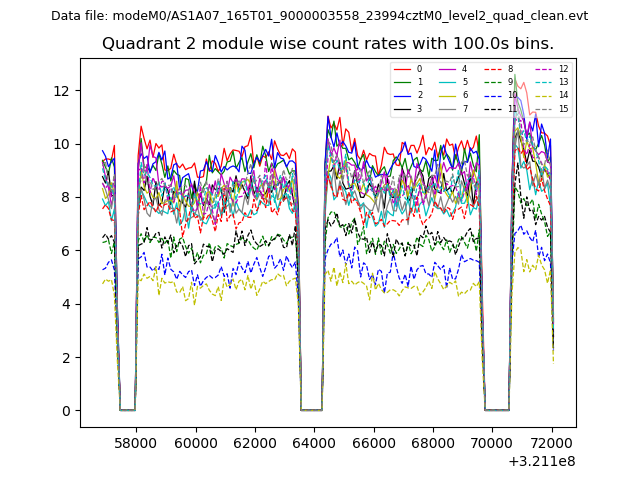
| Module-wise count rates for Quadrant B Data is divided into 100 sec bins |
 |
 |
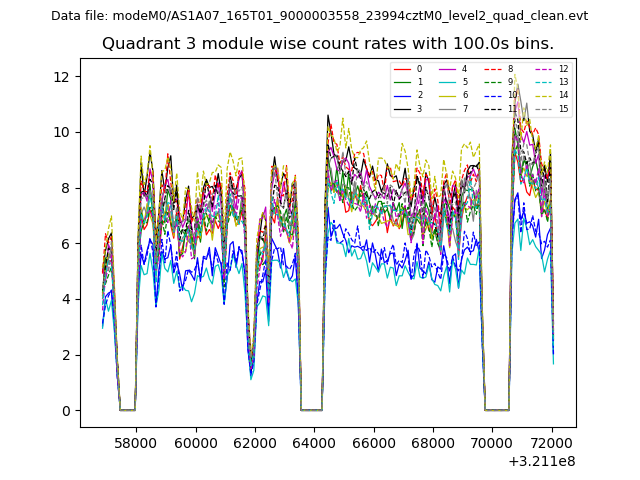
| Module-wise count rates for Quadrant C Data is divided into 100 sec bins |
 |
 |
| Module-wise count rates for Quadrant D Data is divided into 100 sec bins |
 |
 |
| Parameter | Plot |
|---|---|
| CZT HV Monitor | 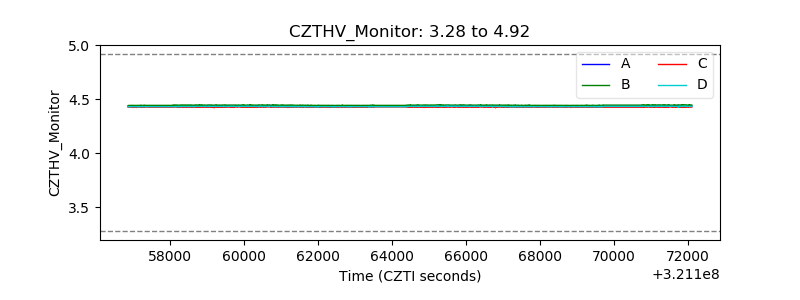 |
| D_VDD | 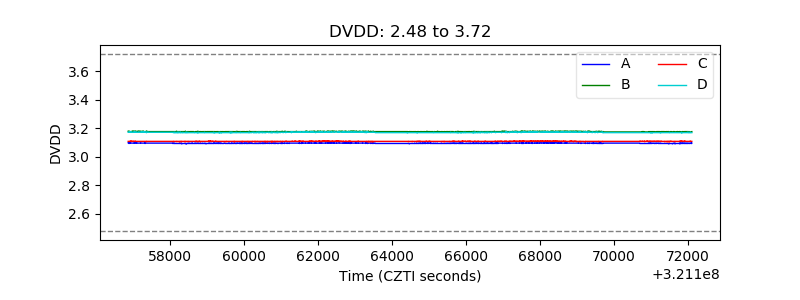 |
| Temperature 1 | 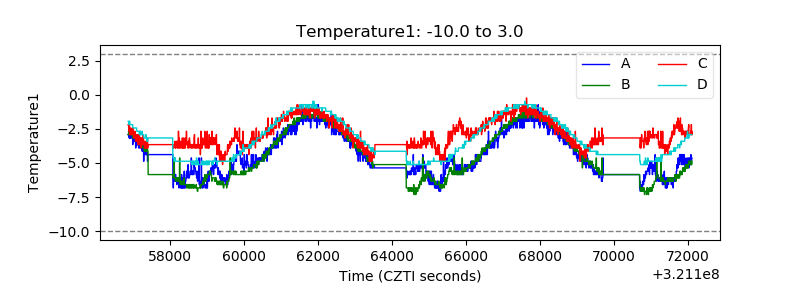 |
| Veto HV Monitor | 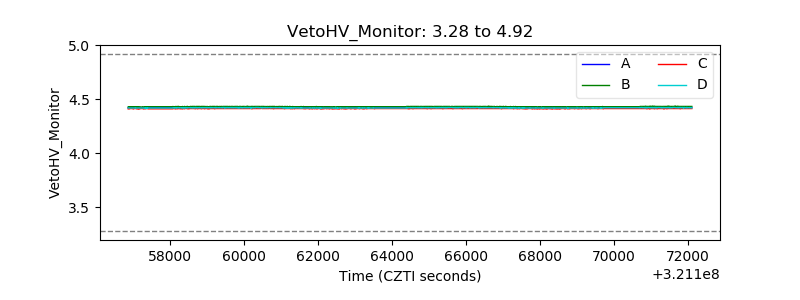 |
| Veto LLD | 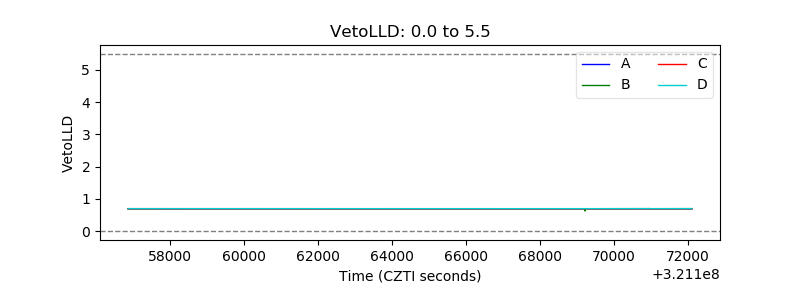 |
| Alpha Counter | 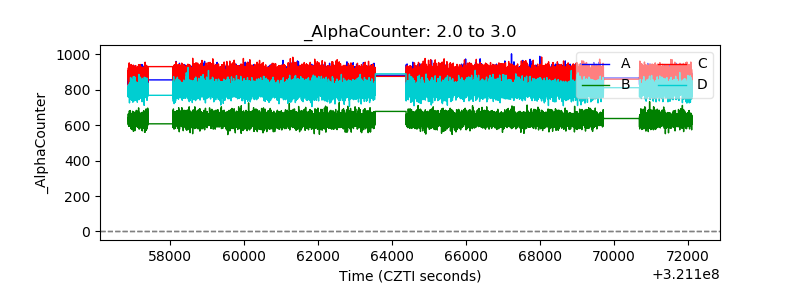 |
| _CPM_Rate | 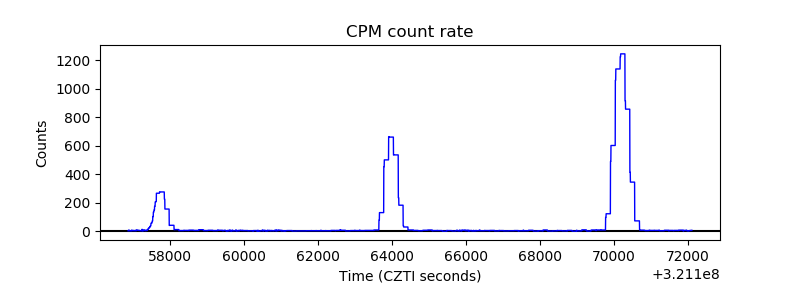 |
| CZT Counter | 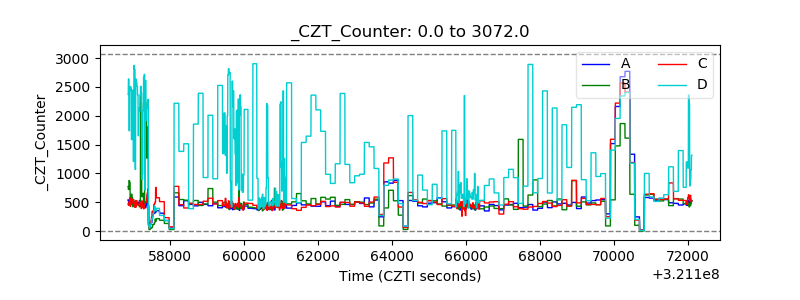 |
| +2.5 Volts monitor | 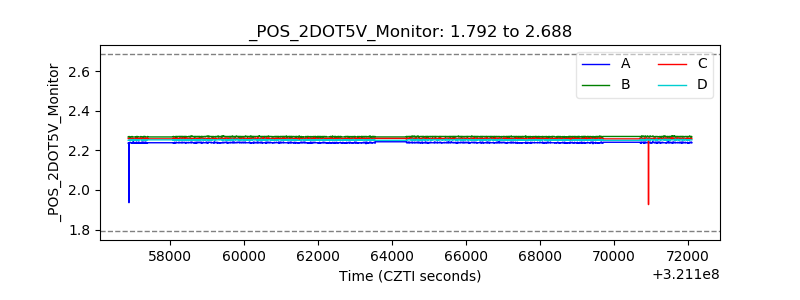 |
| +5 Volts monitor | 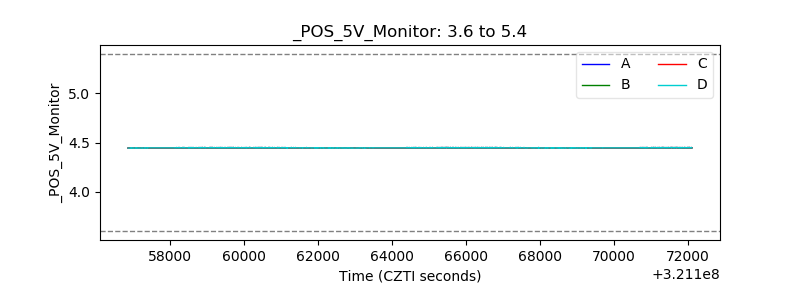 |
| _ROLL_ROT | 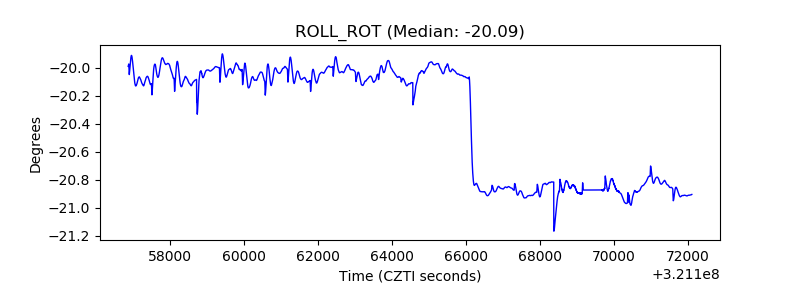 |
| _Roll_DEC | 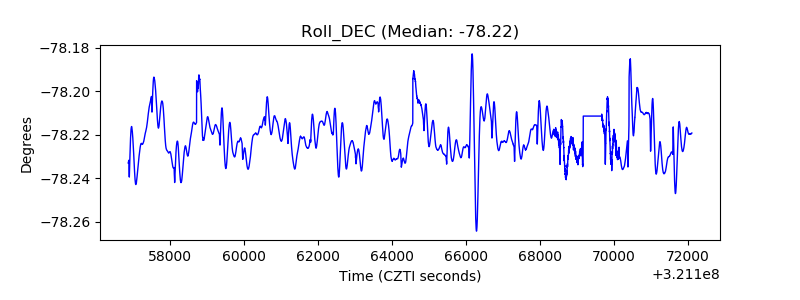 |
| _Roll_RA | 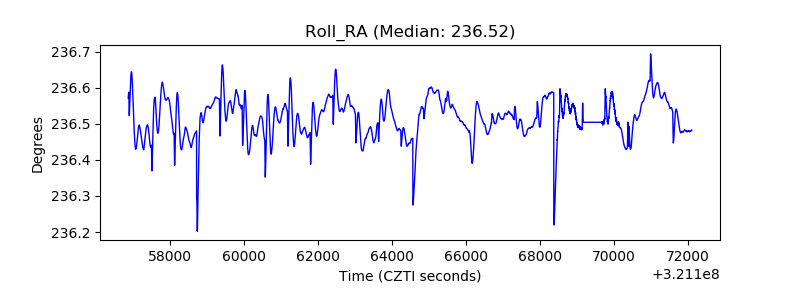 |
| Veto Counter | 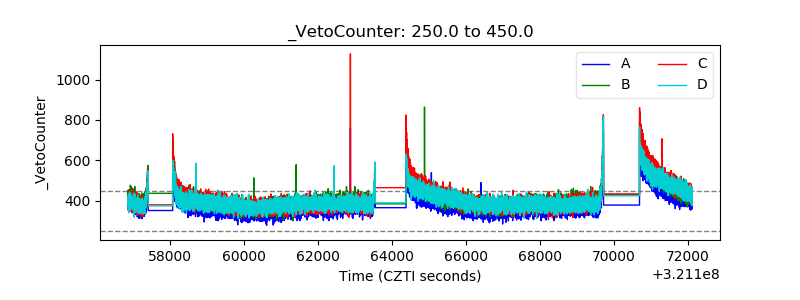 |