| Param | Original file | Final file |
|---|---|---|
| Filename | modeM0/AS1A07_165T01_9000003558_23998cztM0_level2.evt | modeM0/AS1A07_165T01_9000003558_23998cztM0_level2_quad_clean.evt |
| Size (bytes) | 1,099,468,800 | 238,000,320 |
| Size | 1.0 GB | 227.0 MB |
| Events in quadrant A | 5,712,398 | 1,706,704 |
| Events in quadrant B | 6,063,048 | 1,722,069 |
| Events in quadrant C | 6,323,637 | 1,637,645 |
| Events in quadrant D | 14,448,817 | 1,372,508 |
| Mode M9 | |||
|---|---|---|---|
| Quadrant | BADHDUFLAG | Total packets | Discarded packets |
| A | 0 | 24 | 0 |
| B | 0 | 24 | 0 |
| C | 0 | 24 | 0 |
| D | 0 | 24 | 0 |
| Mode M0 | |||
|---|---|---|---|
| Quadrant | BADHDUFLAG | Total packets | Discarded packets |
| A | 0 | 23958 | 2 |
| B | 0 | 24968 | 2 |
| C | 0 | 25852 | 2 |
| D | 0 | 50660 | 3 |
| Mode SS | |||
|---|---|---|---|
| Quadrant | BADHDUFLAG | Total packets | Discarded packets |
| A | 0 | 228 | 0 |
| B | 0 | 228 | 0 |
| C | 0 | 228 | 0 |
| D | 0 | 228 | 0 |
| Quadrant | Total seconds | Saturated seconds | Saturation percentage |
|---|---|---|---|
| A | 11109 | 72 | 0.648123% |
| B | 11109 | 121 | 1.089207% |
| C | 11109 | 235 | 2.115402% |
| D | 11108 | 2938 | 26.449406% |
Noise dominated data is calculated using 1-second bins in cleaned event files. If a bin has >2000 counts, and if more than 50% of those come from <1% of pixels, then it is considered to be noise-dominated and hence unusable.
| Quadrant | # 1 sec bins | Bins with >0 counts | Bins with >2000 counts | High rate bins dominated by noise | Noise dominated (total time) | Noise dominated (detector-on time) | Marked lightcurve |
|---|---|---|---|---|---|---|---|
| A | 13609 | 11111 | 1 | 1 | 0.01% | 0.01% | 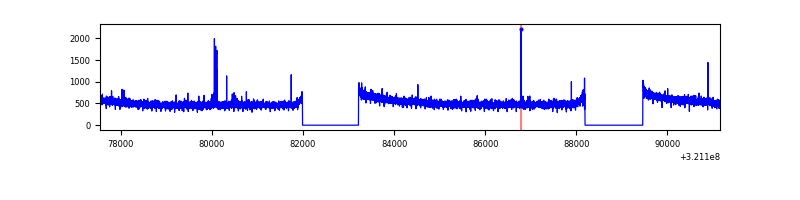 |
| B | 13609 | 11111 | 28 | 28 | 0.21% | 0.25% | 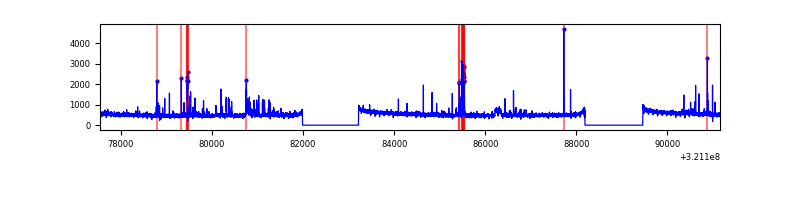 |
| C | 13609 | 11111 | 34 | 34 | 0.25% | 0.31% | 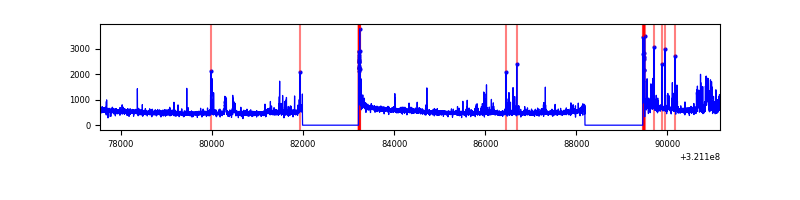 |
| D | 13608 | 11110 | 2178 | 2178 | 16.01% | 19.60% | 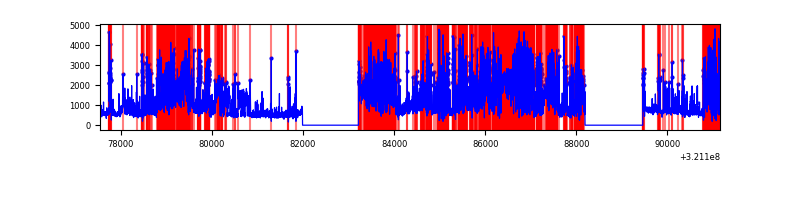 |
Top three noisy pixels from each quadrant. If the there are fewer than three noisy pixels in the level2.evt file, extra rows are filled as -1
| Pixel properties | Quadrant properties | ||||||
|---|---|---|---|---|---|---|---|
| Quadrant | DetID | PixID | Counts | Sigma | Mean | Median | Sigma |
| A | 6 | 16 | 33458 | 111.52 | 1473 | 1449 | 287.0 |
| A | 13 | 254 | 18648 | 59.92 | 1473 | 1449 | 287.0 |
| A | 0 | 226 | 12901 | 39.9 | 1473 | 1449 | 287.0 |
| B | 0 | 197 | 273018 | 1042.22 | 1449 | 1419 | 260.6 |
| B | 15 | 32 | 44186 | 164.11 | 1449 | 1419 | 260.6 |
| B | 12 | 111 | 29861 | 109.14 | 1449 | 1419 | 260.6 |
| C | 0 | 10 | 380088 | 1207.1 | 1390 | 1402 | 313.7 |
| C | 0 | 239 | 244301 | 774.26 | 1390 | 1402 | 313.7 |
| C | 14 | 238 | 227501 | 720.71 | 1390 | 1402 | 313.7 |
| D | 12 | 218 | 6898727 | 23000.51 | 1255 | 1219 | 299.9 |
| D | 1 | 52 | 1113605 | 3709.38 | 1255 | 1219 | 299.9 |
| D | 8 | 195 | 613992 | 2043.36 | 1255 | 1219 | 299.9 |
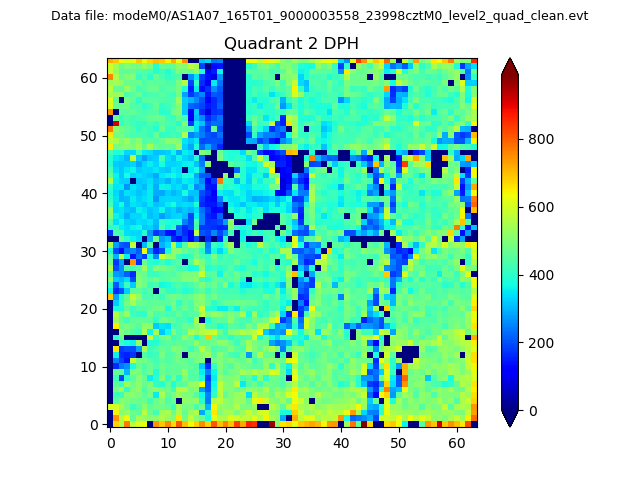
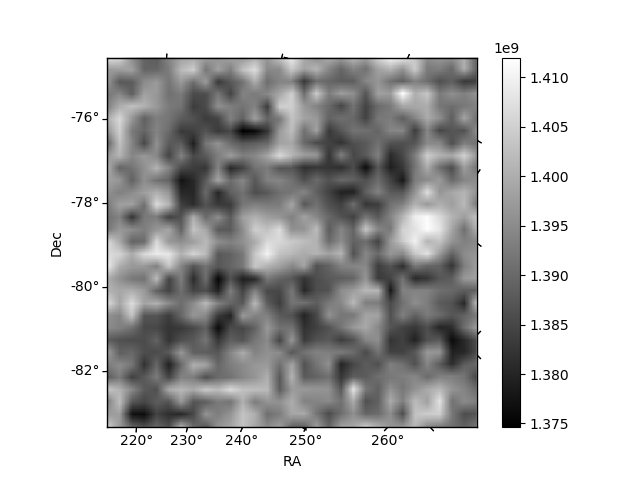
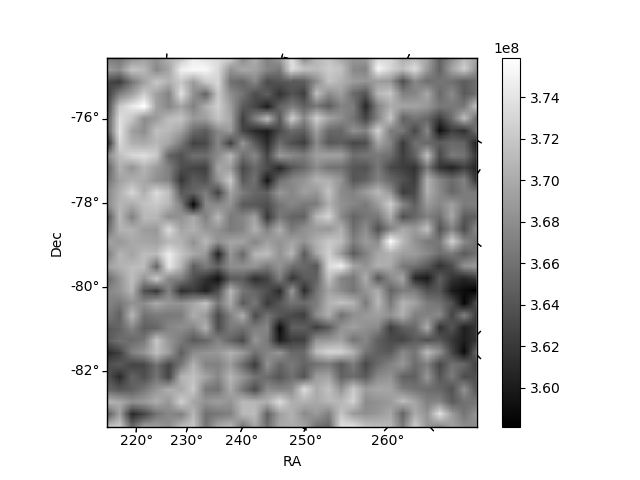
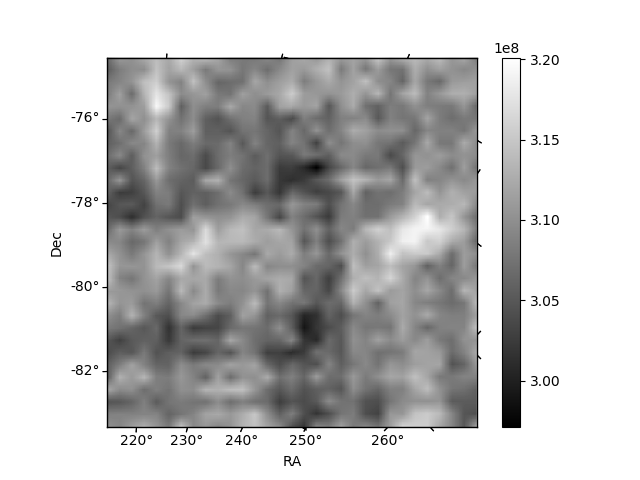
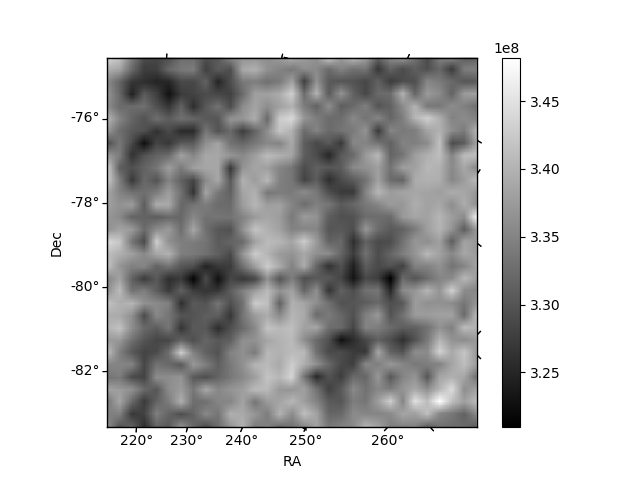
Histogram calculated using DETX and DETY for each event in the final _common_clean file
| Quadrant A | 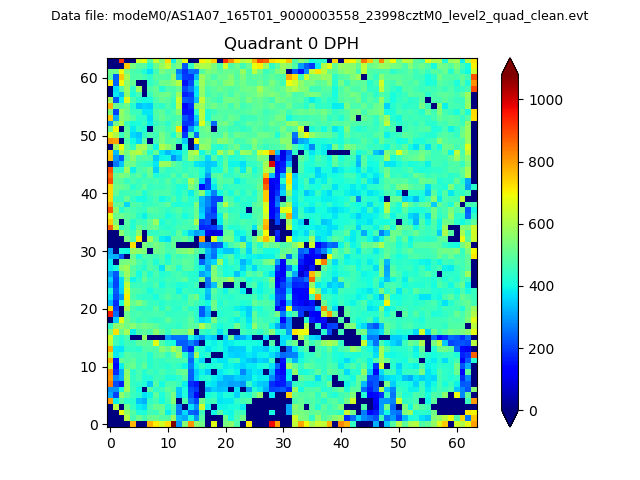 |
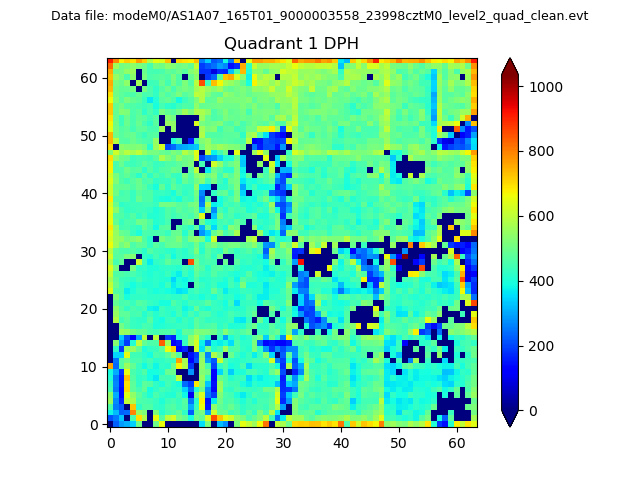 |
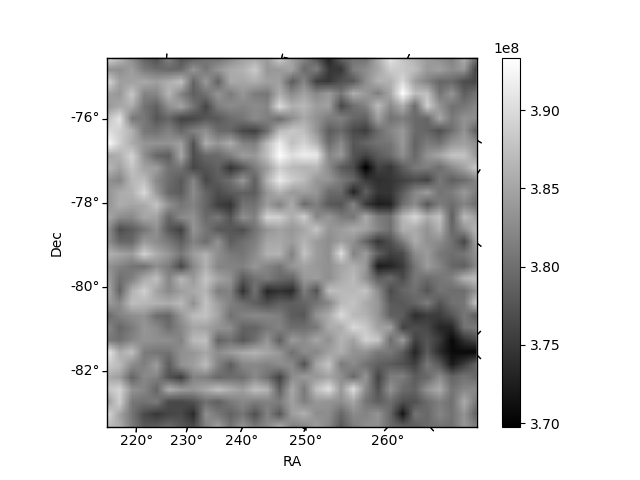
Quadrant B |
|---|---|---|---|
| Quadrant D | 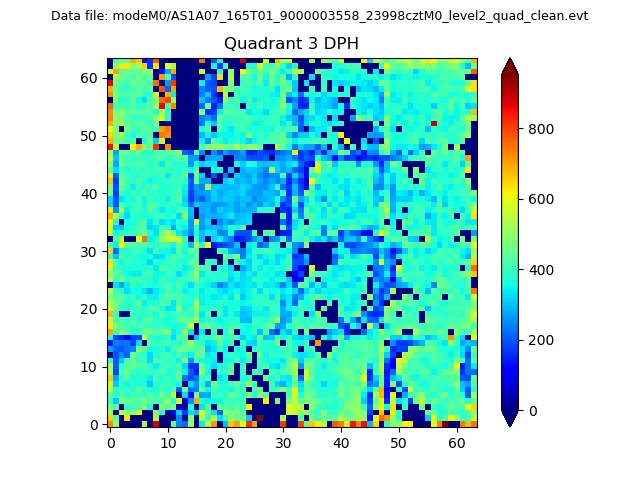 |
 |
Quadrant C |
| Plot type | Count rate plots | Images |
|---|---|---|
| Comparison with Poisson distribution Blue bars denote a histogram of data divided into 1 sec bins. Red curve is a Poisson curve with rate = median count rate of data. |
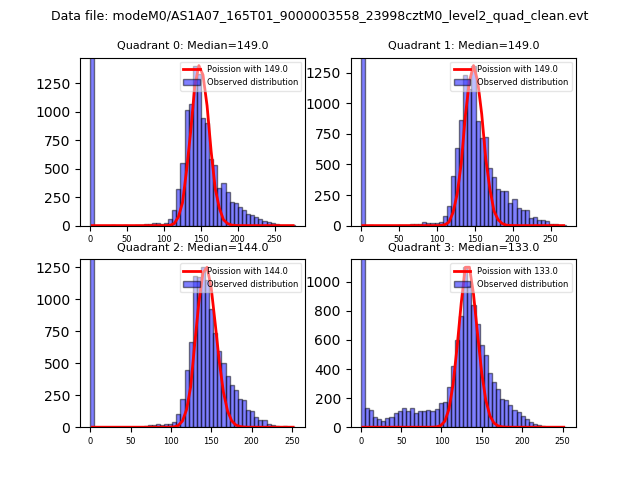 |
 |
| Quadrant-wise count rates Data is divided into 100 sec bins |
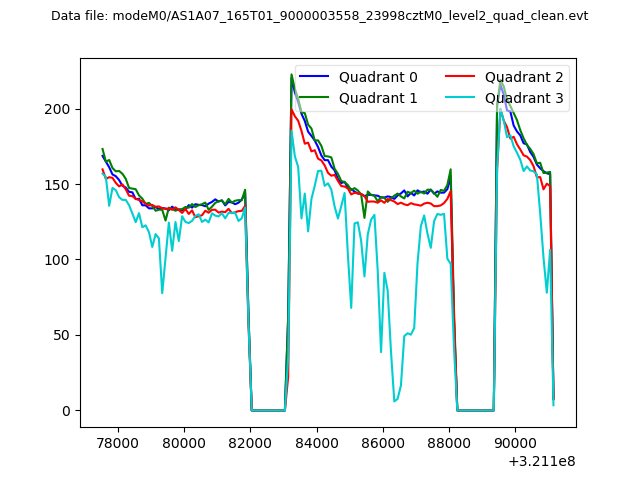 |
|
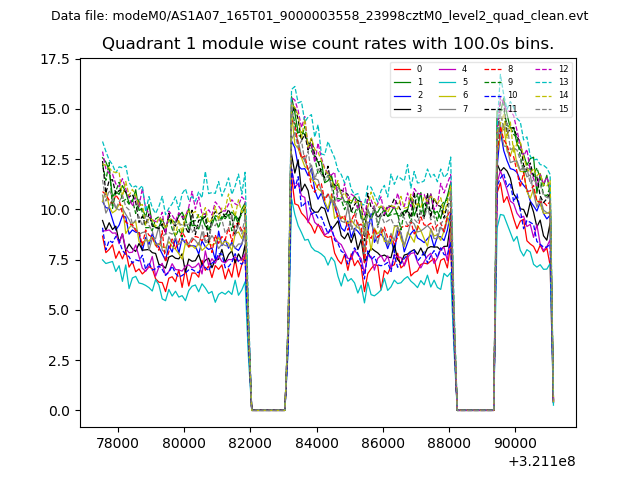
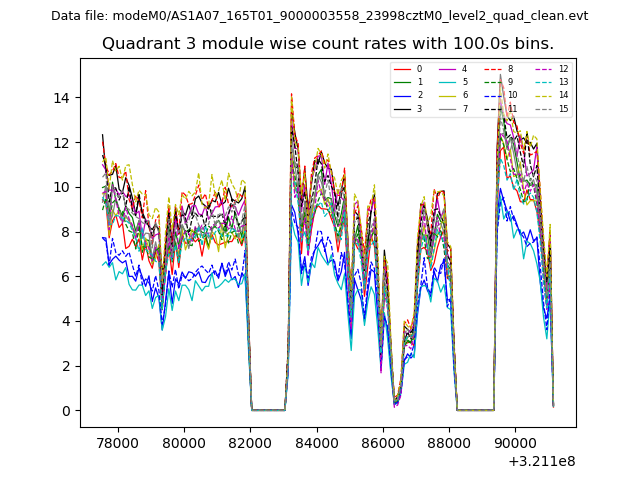
| Module-wise count rates for Quadrant A Data is divided into 100 sec bins |
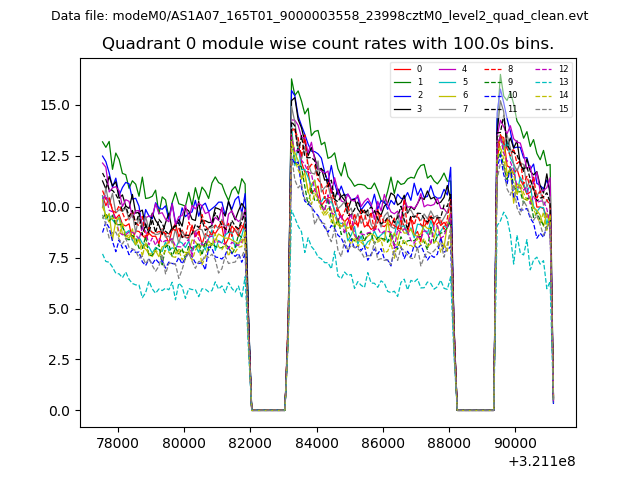 |
 |
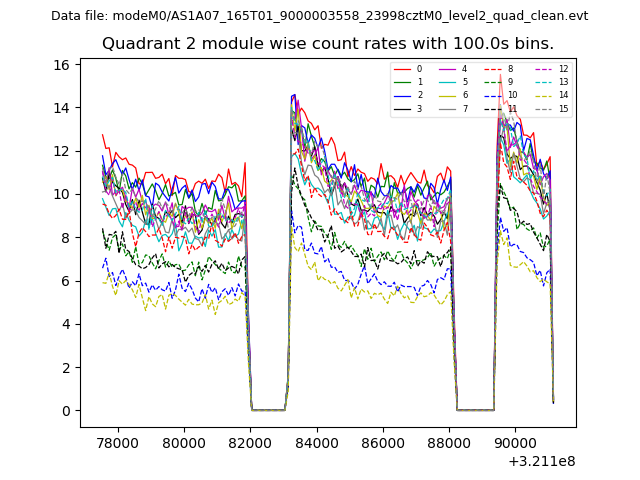
| Module-wise count rates for Quadrant B Data is divided into 100 sec bins |
 |
 |
| Module-wise count rates for Quadrant C Data is divided into 100 sec bins |
 |
 |
| Module-wise count rates for Quadrant D Data is divided into 100 sec bins |
 |
 |
| Parameter | Plot |
|---|---|
| CZT HV Monitor | 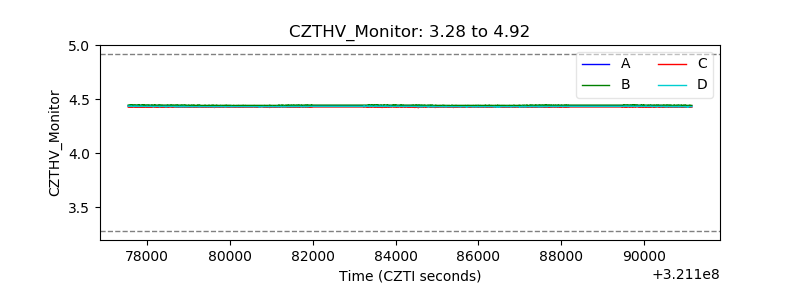 |
| D_VDD | 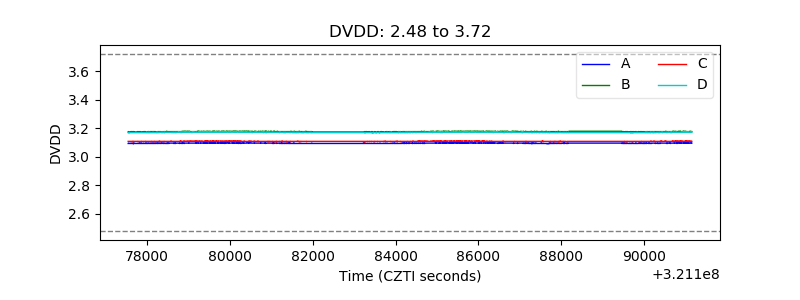 |
| Temperature 1 | 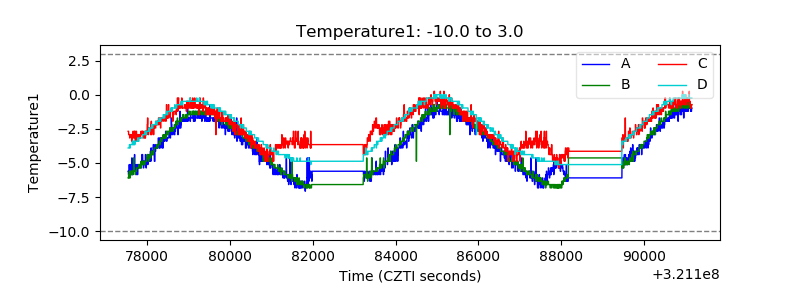 |
| Veto HV Monitor | 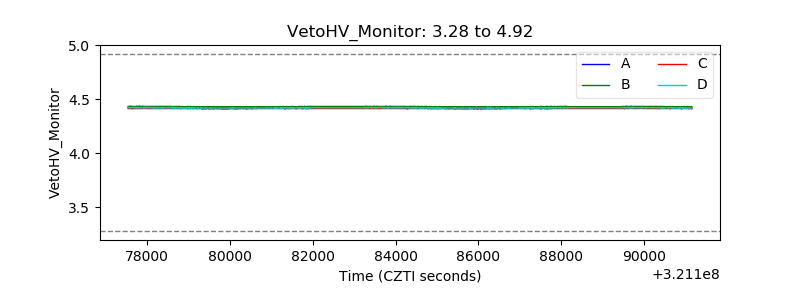 |
| Veto LLD | 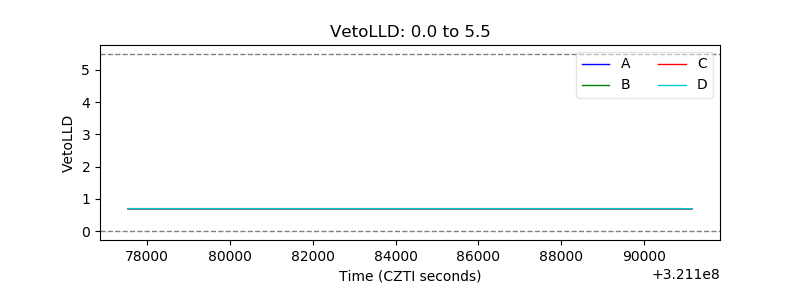 |
| Alpha Counter | 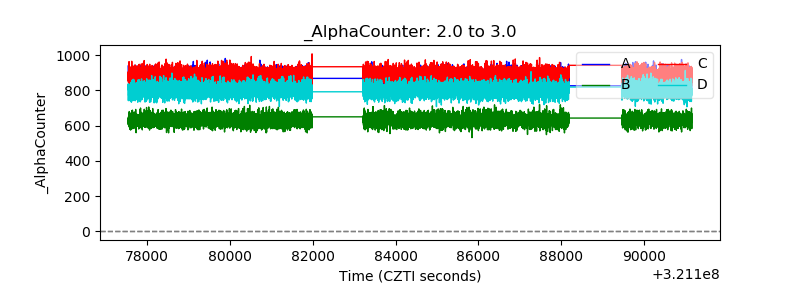 |
| _CPM_Rate | 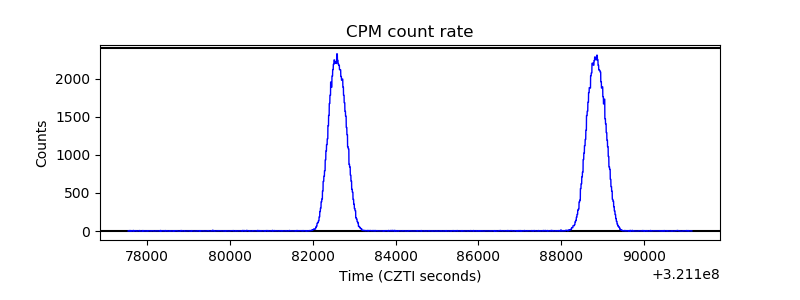 |
| CZT Counter | 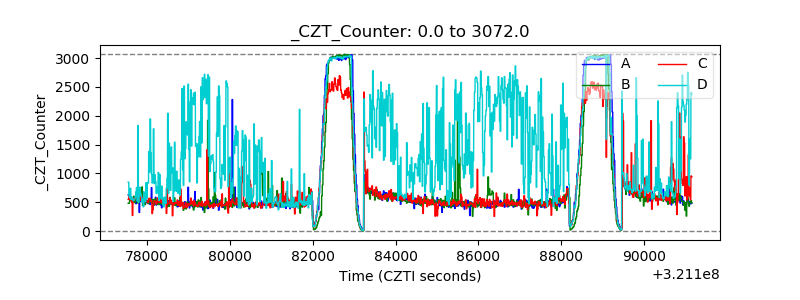 |
| +2.5 Volts monitor |  |
| +5 Volts monitor |  |
| _ROLL_ROT | 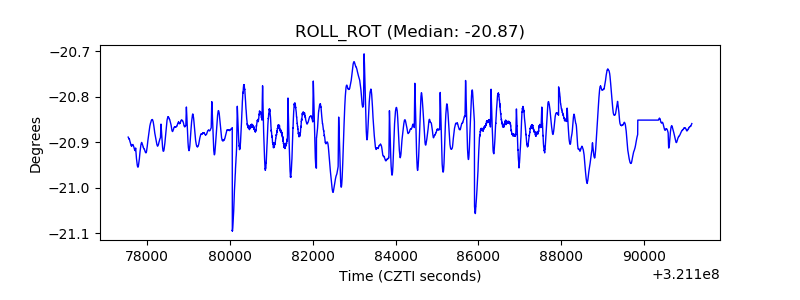 |
| _Roll_DEC | 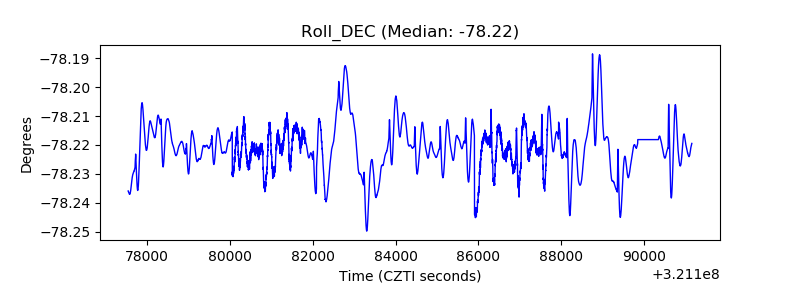 |
| _Roll_RA | 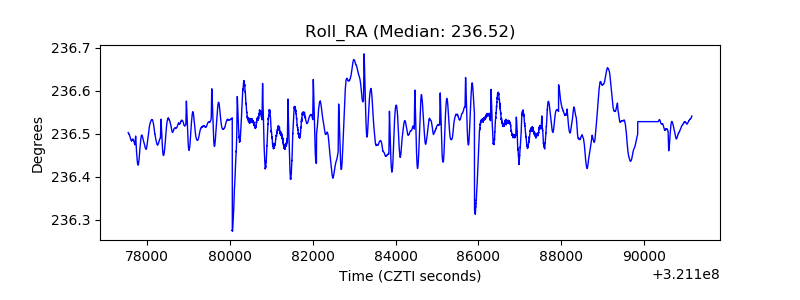 |
| Veto Counter | 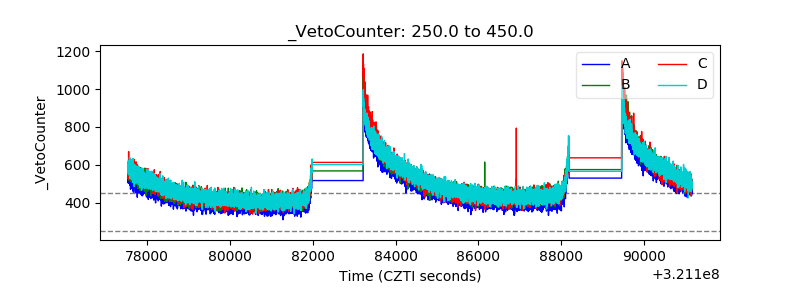 |