| Param | Original file | Final file |
|---|---|---|
| Filename | modeM0/AS1A07_165T01_9000003558_24000cztM0_level2.evt | modeM0/AS1A07_165T01_9000003558_24000cztM0_level2_quad_clean.evt |
| Size (bytes) | 471,427,200 | 129,893,760 |
| Size | 449.6 MB | 123.9 MB |
| Events in quadrant A | 3,007,146 | 909,307 |
| Events in quadrant B | 3,112,091 | 915,546 |
| Events in quadrant C | 3,357,606 | 862,537 |
| Events in quadrant D | 4,395,399 | 830,135 |
| Mode M9 | |||
|---|---|---|---|
| Quadrant | BADHDUFLAG | Total packets | Discarded packets |
| A | 0 | 12 | 0 |
| B | 0 | 12 | 0 |
| C | 0 | 12 | 0 |
| D | 0 | 12 | 0 |
| Mode M0 | |||
|---|---|---|---|
| Quadrant | BADHDUFLAG | Total packets | Discarded packets |
| A | 0 | 12463 | 1 |
| B | 0 | 12809 | 1 |
| C | 0 | 13708 | 1 |
| D | 0 | 16944 | 2 |
| Mode SS | |||
|---|---|---|---|
| Quadrant | BADHDUFLAG | Total packets | Discarded packets |
| A | 0 | 120 | 0 |
| B | 0 | 120 | 0 |
| C | 0 | 120 | 0 |
| D | 0 | 120 | 0 |
| Quadrant | Total seconds | Saturated seconds | Saturation percentage |
|---|---|---|---|
| A | 5962 | 74 | 1.241194% |
| B | 5963 | 87 | 1.458997% |
| C | 5963 | 140 | 2.347812% |
| D | 5962 | 357 | 5.987924% |
Noise dominated data is calculated using 1-second bins in cleaned event files. If a bin has >2000 counts, and if more than 50% of those come from <1% of pixels, then it is considered to be noise-dominated and hence unusable.
| Quadrant | # 1 sec bins | Bins with >0 counts | Bins with >2000 counts | High rate bins dominated by noise | Noise dominated (total time) | Noise dominated (detector-on time) | Marked lightcurve |
|---|---|---|---|---|---|---|---|
| A | 7222 | 5963 | 0 | 0 | 0.00% | 0.00% | 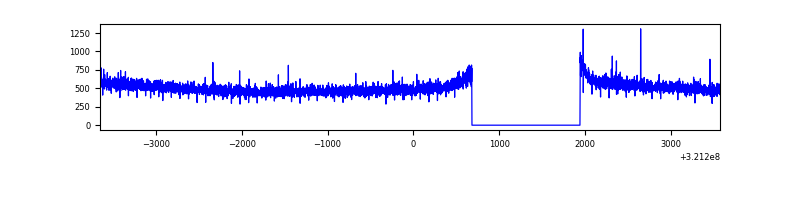 |
| B | 7223 | 5964 | 4 | 4 | 0.06% | 0.07% | 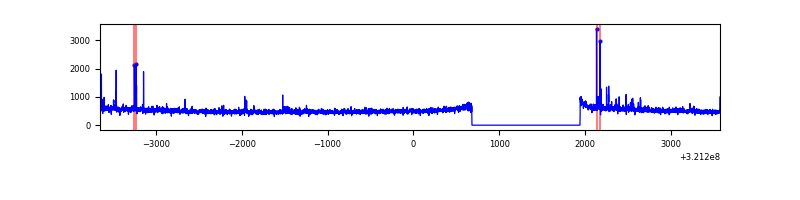 |
| C | 7223 | 5964 | 18 | 18 | 0.25% | 0.30% | 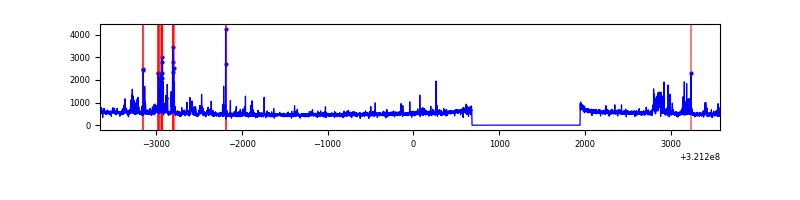 |
| D | 7222 | 5963 | 223 | 223 | 3.09% | 3.74% | 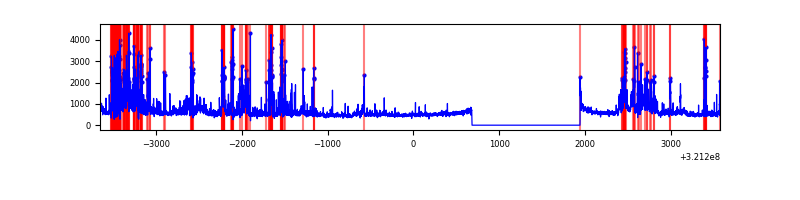 |
Top three noisy pixels from each quadrant. If the there are fewer than three noisy pixels in the level2.evt file, extra rows are filled as -1
| Pixel properties | Quadrant properties | ||||||
|---|---|---|---|---|---|---|---|
| Quadrant | DetID | PixID | Counts | Sigma | Mean | Median | Sigma |
| A | 13 | 254 | 10945 | 65.73 | 779 | 764 | 154.9 |
| A | 0 | 226 | 6892 | 39.56 | 779 | 764 | 154.9 |
| A | 3 | 137 | 6032 | 34.01 | 779 | 764 | 154.9 |
| B | 0 | 190 | 26953 | 185.08 | 772 | 757 | 141.5 |
| B | 12 | 111 | 15814 | 106.38 | 772 | 757 | 141.5 |
| B | 0 | 228 | 15259 | 102.46 | 772 | 757 | 141.5 |
| C | 0 | 239 | 239549 | 1431.13 | 732 | 738 | 166.9 |
| C | 14 | 238 | 118521 | 705.84 | 732 | 738 | 166.9 |
| C | 7 | 247 | 82681 | 491.06 | 732 | 738 | 166.9 |
| D | 12 | 218 | 941451 | 5476.19 | 730 | 713 | 171.8 |
| D | 7 | 238 | 333414 | 1936.71 | 730 | 713 | 171.8 |
| D | 8 | 195 | 128674 | 744.88 | 730 | 713 | 171.8 |
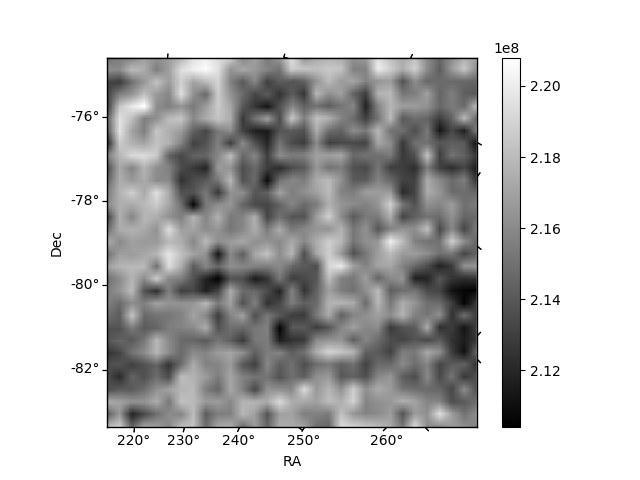
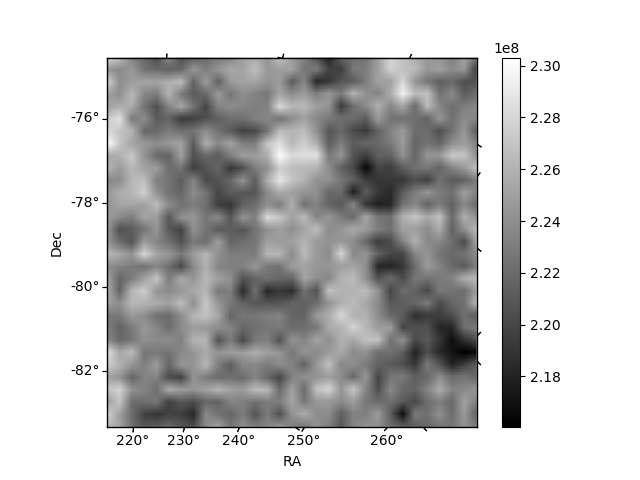
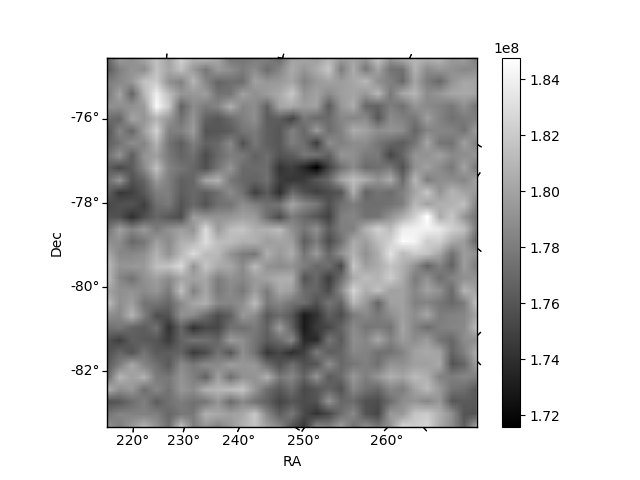
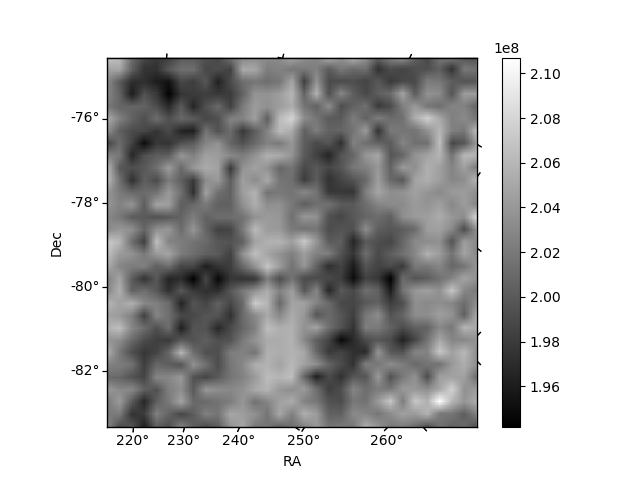
Histogram calculated using DETX and DETY for each event in the final _common_clean file
| Quadrant A | 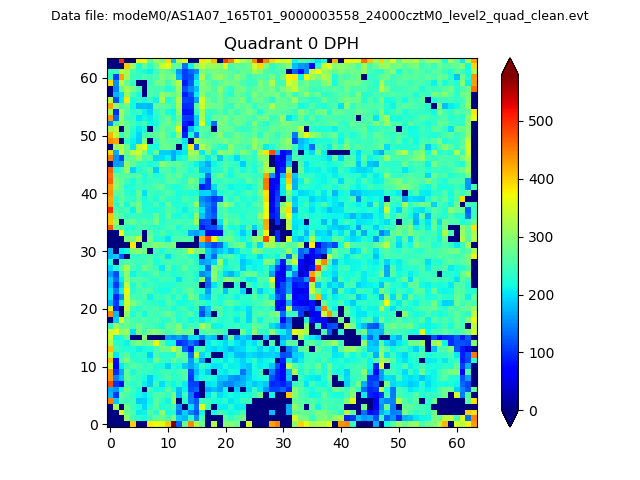 |
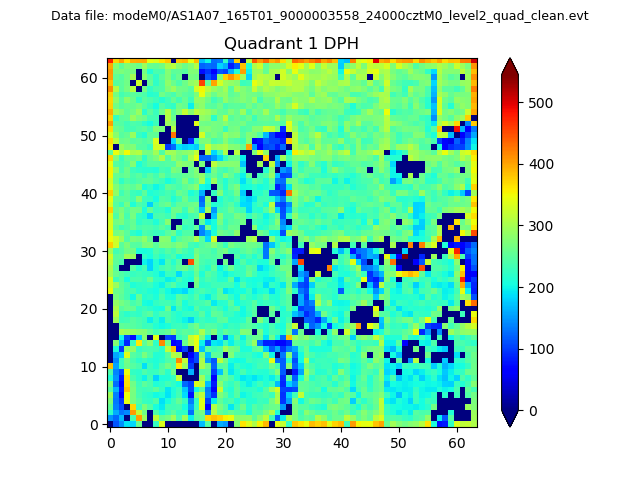 |
Quadrant B |
|---|---|---|---|
| Quadrant D |  |
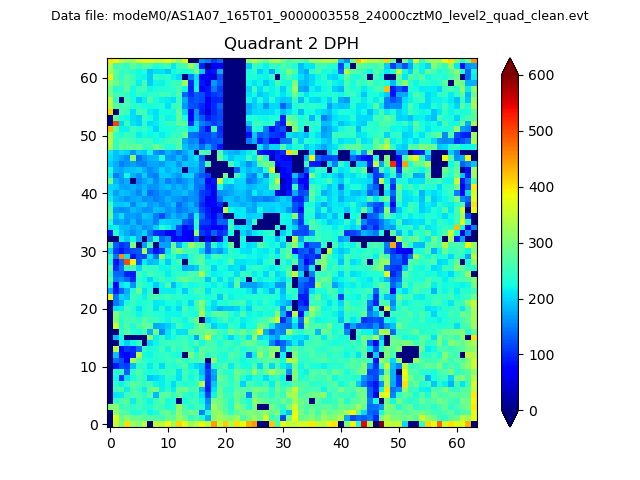 |
Quadrant C |
| Plot type | Count rate plots | Images |
|---|---|---|
| Comparison with Poisson distribution Blue bars denote a histogram of data divided into 1 sec bins. Red curve is a Poisson curve with rate = median count rate of data. |
 |
 |
| Quadrant-wise count rates Data is divided into 100 sec bins |
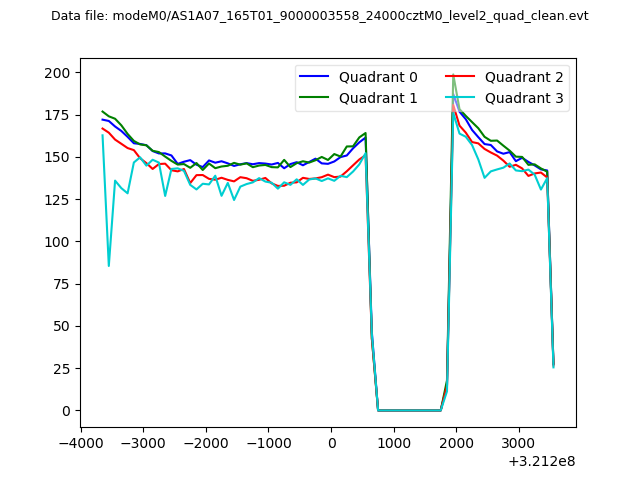 |
|
| Module-wise count rates for Quadrant A Data is divided into 100 sec bins |
 |
 |
| Module-wise count rates for Quadrant B Data is divided into 100 sec bins |
 |
 |
| Module-wise count rates for Quadrant C Data is divided into 100 sec bins |
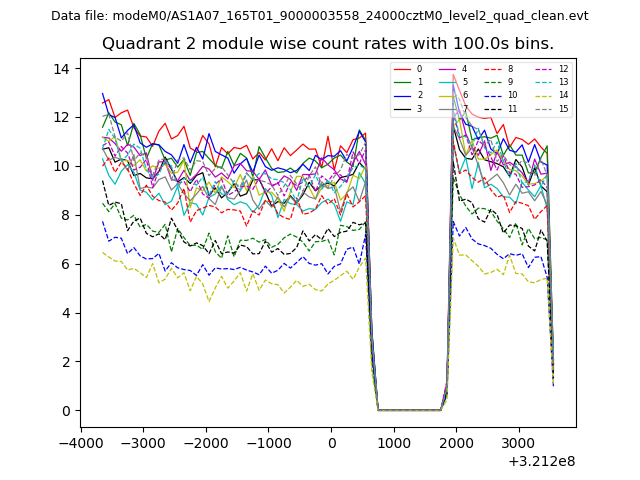 |
 |
| Module-wise count rates for Quadrant D Data is divided into 100 sec bins |
 |
 |
| Parameter | Plot |
|---|---|
| CZT HV Monitor |  |
| D_VDD | 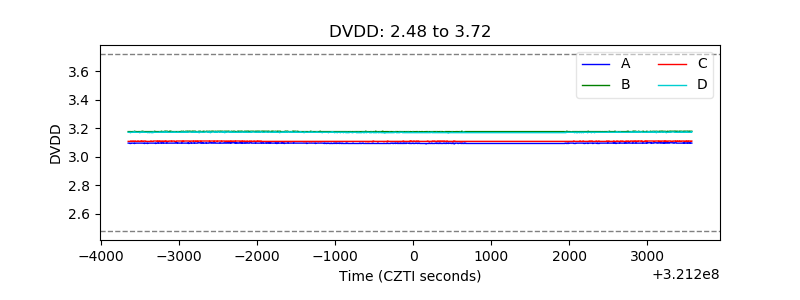 |
| Temperature 1 | 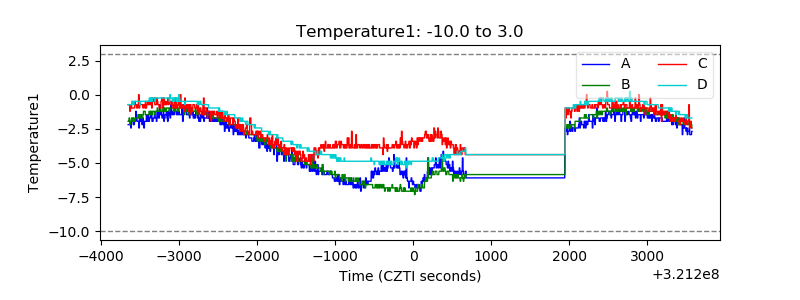 |
| Veto HV Monitor | 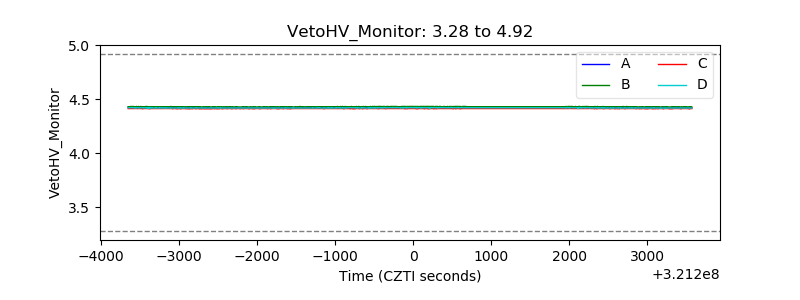 |
| Veto LLD |  |
| Alpha Counter | 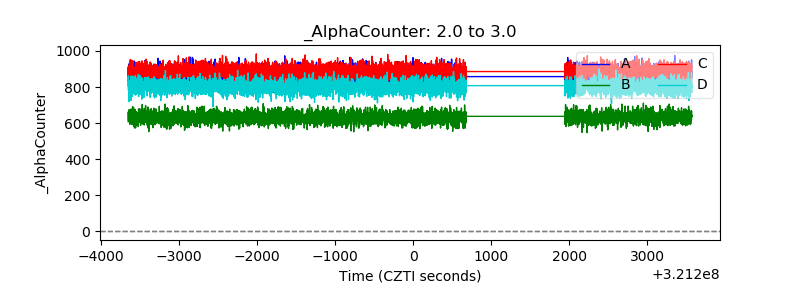 |
| _CPM_Rate | 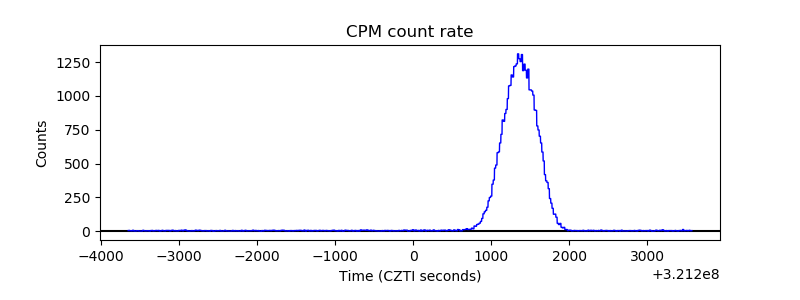 |
| CZT Counter | 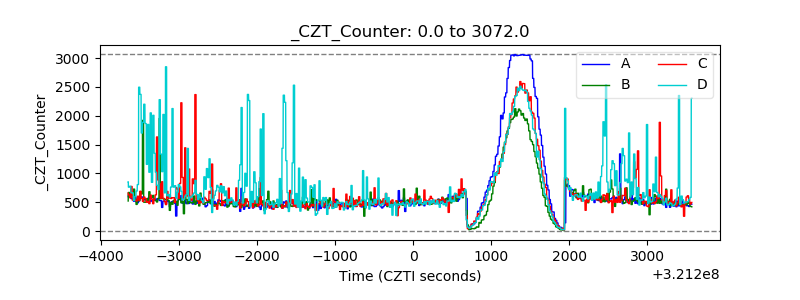 |
| +2.5 Volts monitor |  |
| +5 Volts monitor |  |
| _ROLL_ROT | 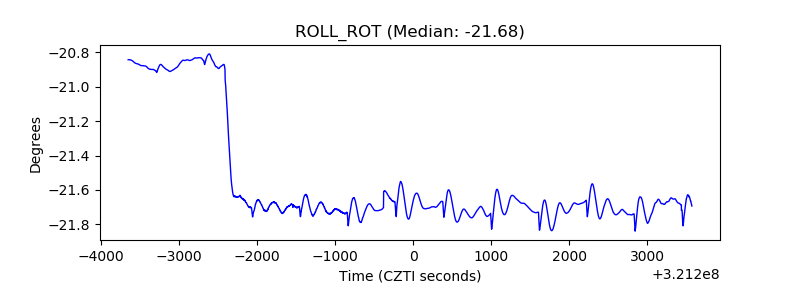 |
| _Roll_DEC | 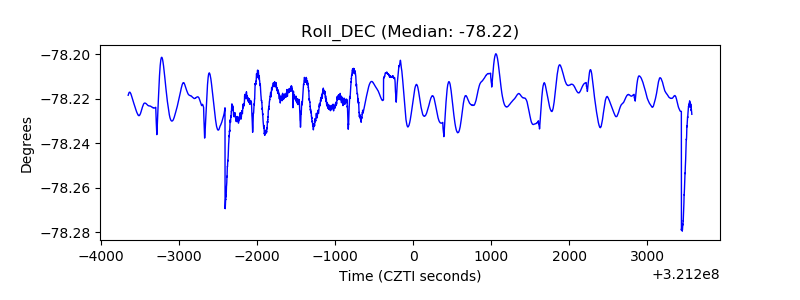 |
| _Roll_RA | 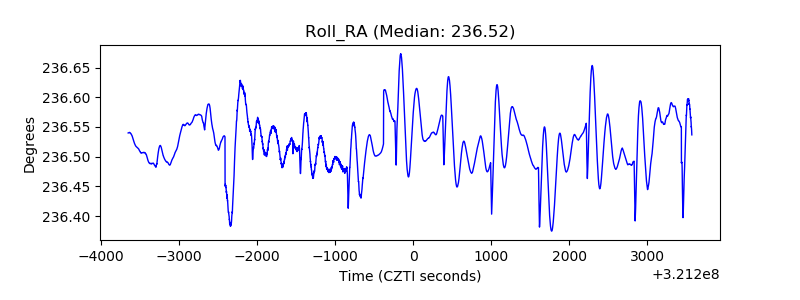 |
| Veto Counter |  |