| Param | Original file | Final file |
|---|---|---|
| Filename | modeM0/AS1A07_165T01_9000003558_24002cztM0_level2.evt | modeM0/AS1A07_165T01_9000003558_24002cztM0_level2_quad_clean.evt |
| Size (bytes) | 523,523,520 | 137,528,640 |
| Size | 499.3 MB | 131.2 MB |
| Events in quadrant A | 3,320,190 | 944,930 |
| Events in quadrant B | 3,515,612 | 955,134 |
| Events in quadrant C | 3,487,391 | 908,784 |
| Events in quadrant D | 5,059,352 | 871,571 |
| Mode M9 | |||
|---|---|---|---|
| Quadrant | BADHDUFLAG | Total packets | Discarded packets |
| A | 0 | 7 | 0 |
| B | 0 | 7 | 0 |
| C | 0 | 7 | 0 |
| D | 0 | 7 | 0 |
| Mode M0 | |||
|---|---|---|---|
| Quadrant | BADHDUFLAG | Total packets | Discarded packets |
| A | 0 | 14380 | 2 |
| B | 0 | 14840 | 2 |
| C | 0 | 14796 | 2 |
| D | 0 | 19764 | 3 |
| Mode SS | |||
|---|---|---|---|
| Quadrant | BADHDUFLAG | Total packets | Discarded packets |
| A | 0 | 142 | 0 |
| B | 0 | 142 | 0 |
| C | 0 | 142 | 0 |
| D | 0 | 142 | 0 |
| Quadrant | Total seconds | Saturated seconds | Saturation percentage |
|---|---|---|---|
| A | 6960 | 69 | 0.991379% |
| B | 6960 | 107 | 1.537356% |
| C | 6960 | 119 | 1.709770% |
| D | 6959 | 344 | 4.943239% |
Noise dominated data is calculated using 1-second bins in cleaned event files. If a bin has >2000 counts, and if more than 50% of those come from <1% of pixels, then it is considered to be noise-dominated and hence unusable.
| Quadrant | # 1 sec bins | Bins with >0 counts | Bins with >2000 counts | High rate bins dominated by noise | Noise dominated (total time) | Noise dominated (detector-on time) | Marked lightcurve |
|---|---|---|---|---|---|---|---|
| A | 7695 | 6961 | 0 | 0 | 0.00% | 0.00% | 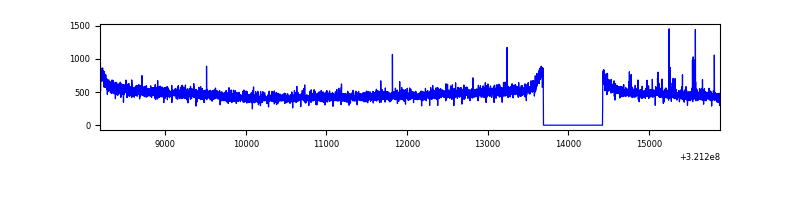 |
| B | 7695 | 6961 | 4 | 4 | 0.05% | 0.06% | 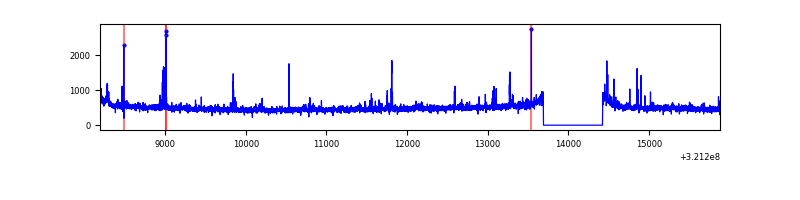 |
| C | 7695 | 6961 | 5 | 5 | 0.06% | 0.07% | 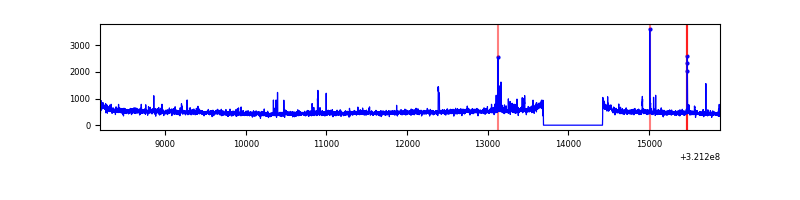 |
| D | 7694 | 6960 | 193 | 193 | 2.51% | 2.77% | 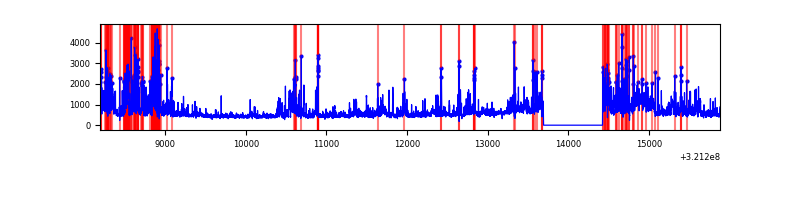 |
Top three noisy pixels from each quadrant. If the there are fewer than three noisy pixels in the level2.evt file, extra rows are filled as -1
| Pixel properties | Quadrant properties | ||||||
|---|---|---|---|---|---|---|---|
| Quadrant | DetID | PixID | Counts | Sigma | Mean | Median | Sigma |
| A | 6 | 16 | 27916 | 159.22 | 854 | 836 | 170.1 |
| A | 13 | 254 | 11890 | 64.99 | 854 | 836 | 170.1 |
| A | 0 | 226 | 7467 | 38.99 | 854 | 836 | 170.1 |
| B | 0 | 197 | 85734 | 536.21 | 851 | 830 | 158.3 |
| B | 0 | 245 | 30686 | 188.55 | 851 | 830 | 158.3 |
| B | 7 | 202 | 25180 | 153.78 | 851 | 830 | 158.3 |
| C | 14 | 238 | 128956 | 685.32 | 810 | 814 | 187.0 |
| C | 0 | 239 | 117853 | 625.94 | 810 | 814 | 187.0 |
| C | 10 | 9 | 44962 | 236.11 | 810 | 814 | 187.0 |
| D | 12 | 218 | 1091962 | 5554.48 | 810 | 784 | 196.5 |
| D | 1 | 52 | 374031 | 1899.96 | 810 | 784 | 196.5 |
| D | 8 | 195 | 197096 | 999.3 | 810 | 784 | 196.5 |
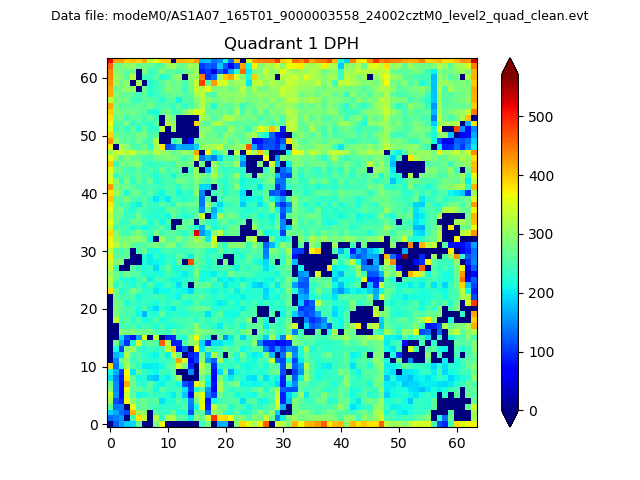
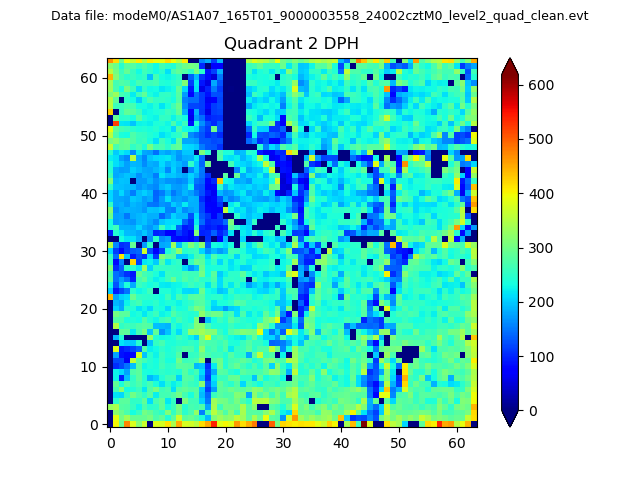
Histogram calculated using DETX and DETY for each event in the final _common_clean file
| Quadrant A |  |
 |
Quadrant B |
|---|---|---|---|
| Quadrant D |  |
 |
Quadrant C |
| Plot type | Count rate plots | Images |
|---|---|---|
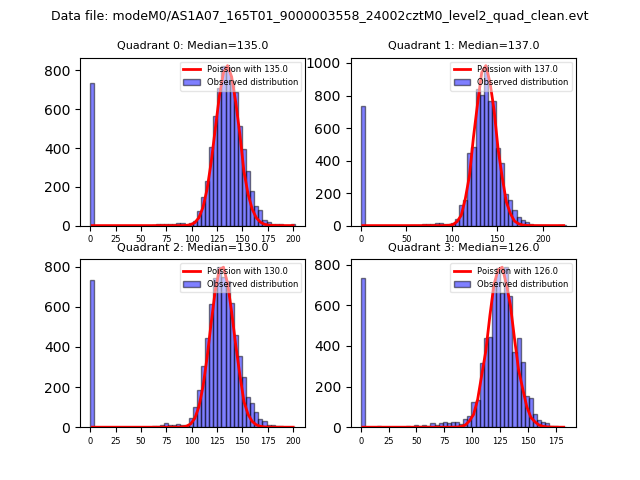
| Comparison with Poisson distribution Blue bars denote a histogram of data divided into 1 sec bins. Red curve is a Poisson curve with rate = median count rate of data. |
 |
 |
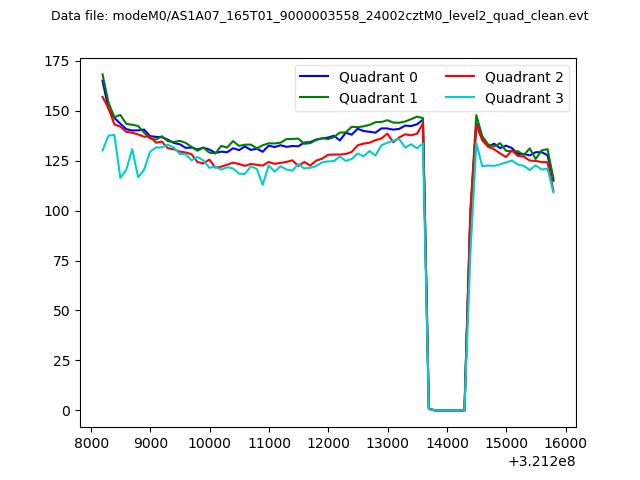
| Quadrant-wise count rates Data is divided into 100 sec bins |
 |
|
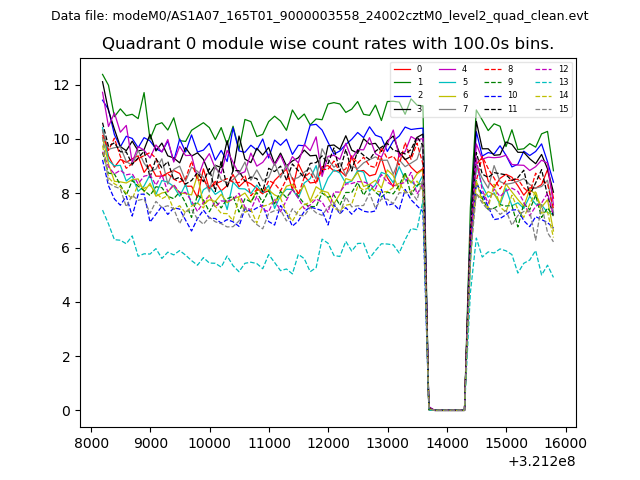
| Module-wise count rates for Quadrant A Data is divided into 100 sec bins |
 |
 |
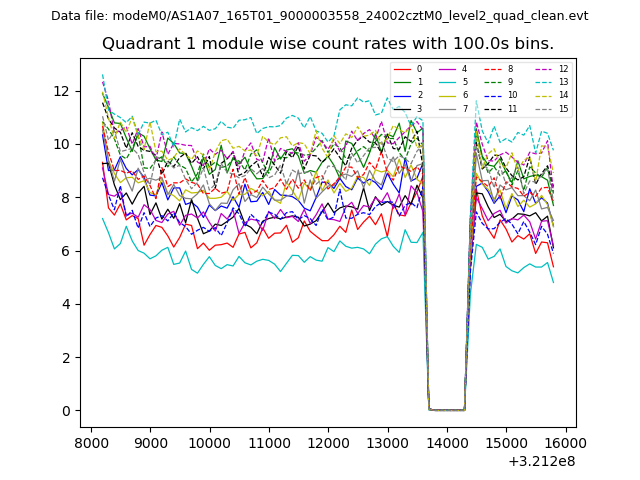
| Module-wise count rates for Quadrant B Data is divided into 100 sec bins |
 |
 |
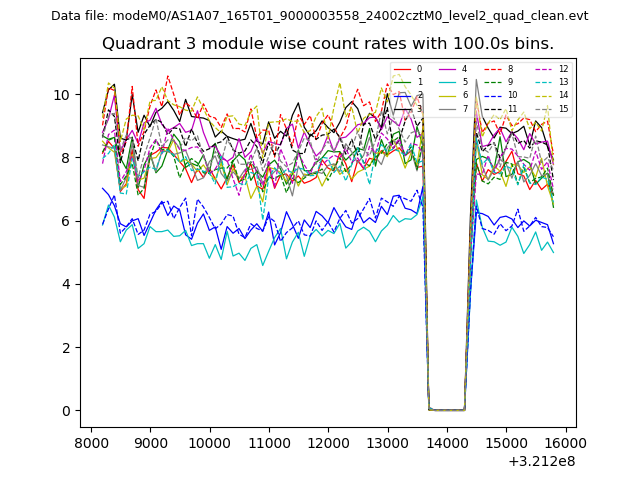
| Module-wise count rates for Quadrant C Data is divided into 100 sec bins |
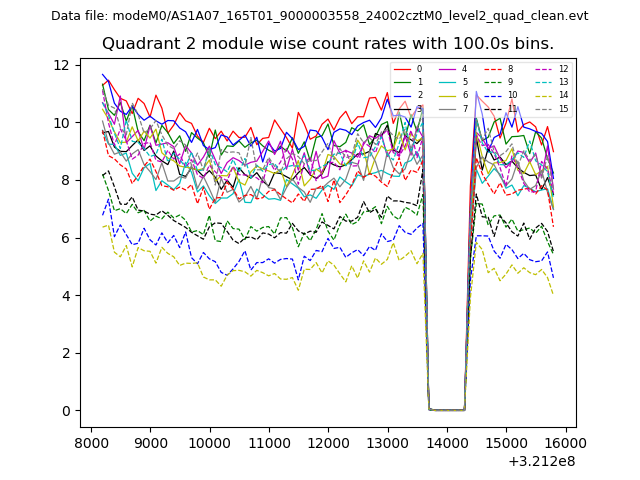 |
 |
| Module-wise count rates for Quadrant D Data is divided into 100 sec bins |
 |
 |
| Parameter | Plot |
|---|---|
| CZT HV Monitor | 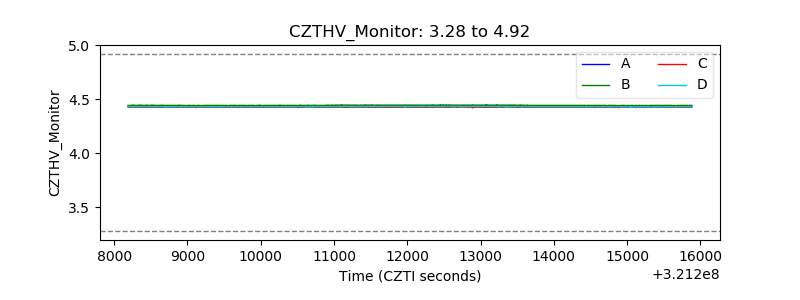 |
| D_VDD | 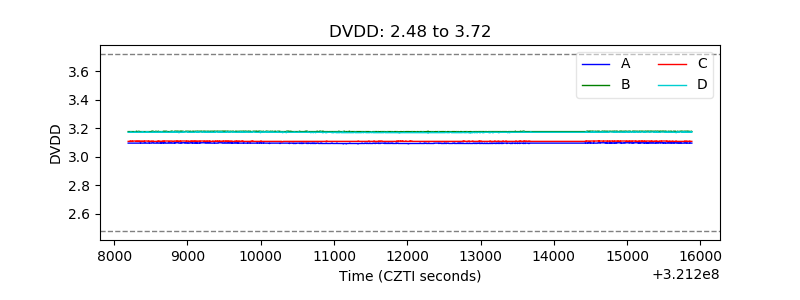 |
| Temperature 1 | 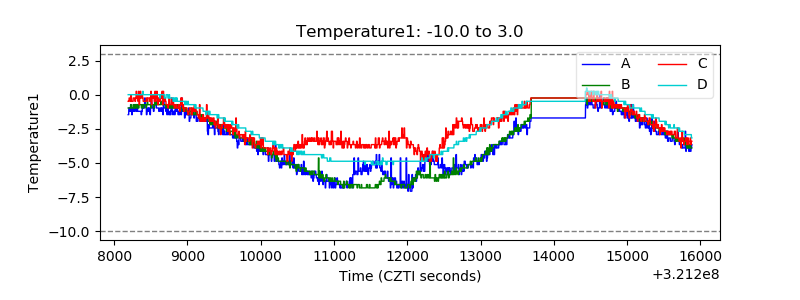 |
| Veto HV Monitor |  |
| Veto LLD | 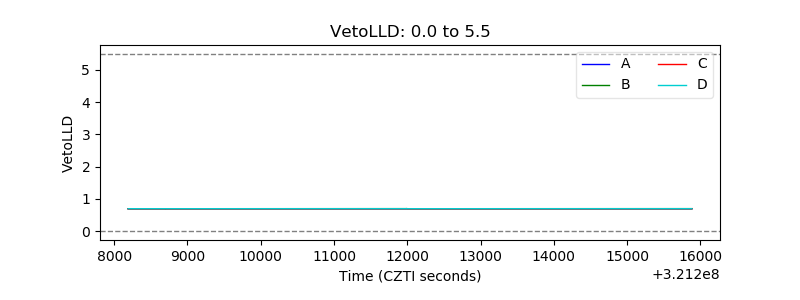 |
| Alpha Counter | 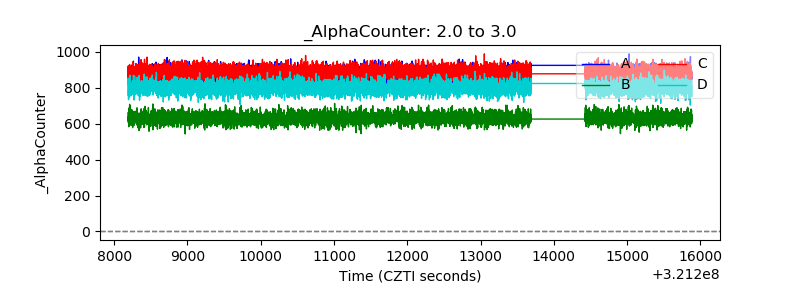 |
| _CPM_Rate | 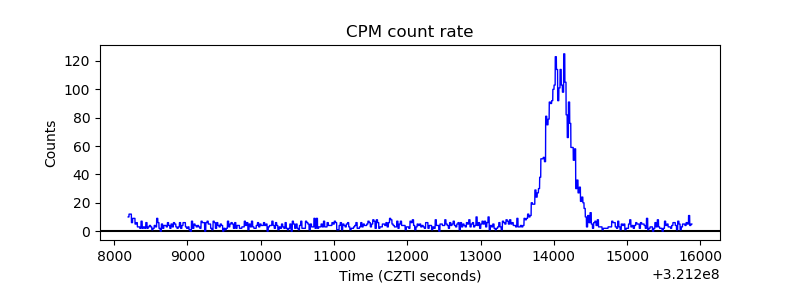 |
| CZT Counter |  |
| +2.5 Volts monitor |  |
| +5 Volts monitor | 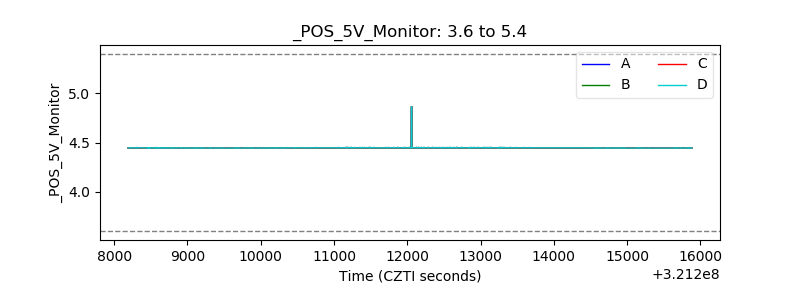 |
| _ROLL_ROT | 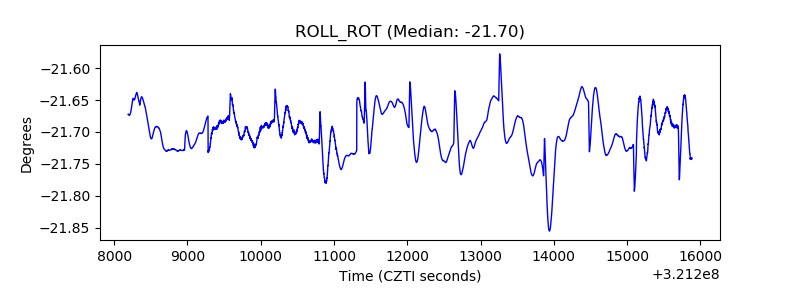 |
| _Roll_DEC | 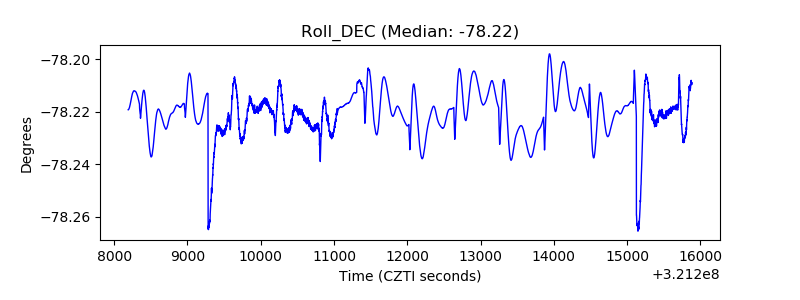 |
| _Roll_RA |  |
| Veto Counter | 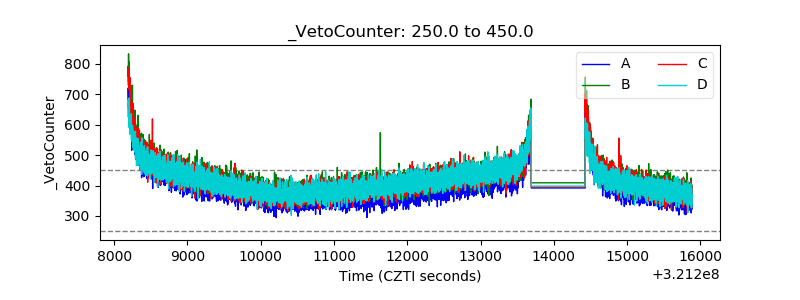 |