| Param | Original file | Final file |
|---|---|---|
| Filename | modeM0/AS1A07_165T01_9000003558_24003cztM0_level2.evt | modeM0/AS1A07_165T01_9000003558_24003cztM0_level2_quad_clean.evt |
| Size (bytes) | 521,861,760 | 131,152,320 |
| Size | 497.7 MB | 125.1 MB |
| Events in quadrant A | 3,243,114 | 896,134 |
| Events in quadrant B | 3,383,118 | 908,280 |
| Events in quadrant C | 3,368,688 | 865,618 |
| Events in quadrant D | 5,342,260 | 822,253 |
| Mode M9 | |||
|---|---|---|---|
| Quadrant | BADHDUFLAG | Total packets | Discarded packets |
| A | 0 | 4 | 0 |
| B | 0 | 4 | 0 |
| C | 0 | 4 | 0 |
| D | 0 | 4 | 0 |
| Mode M0 | |||
|---|---|---|---|
| Quadrant | BADHDUFLAG | Total packets | Discarded packets |
| A | 0 | 14236 | 1 |
| B | 0 | 14484 | 1 |
| C | 0 | 14475 | 1 |
| D | 0 | 20549 | 1 |
| Mode SS | |||
|---|---|---|---|
| Quadrant | BADHDUFLAG | Total packets | Discarded packets |
| A | 0 | 140 | 0 |
| B | 0 | 140 | 0 |
| C | 0 | 140 | 0 |
| D | 0 | 140 | 0 |
| Quadrant | Total seconds | Saturated seconds | Saturation percentage |
|---|---|---|---|
| A | 6887 | 60 | 0.871207% |
| B | 6888 | 73 | 1.059814% |
| C | 6888 | 101 | 1.466318% |
| D | 6888 | 518 | 7.520325% |
Noise dominated data is calculated using 1-second bins in cleaned event files. If a bin has >2000 counts, and if more than 50% of those come from <1% of pixels, then it is considered to be noise-dominated and hence unusable.
| Quadrant | # 1 sec bins | Bins with >0 counts | Bins with >2000 counts | High rate bins dominated by noise | Noise dominated (total time) | Noise dominated (detector-on time) | Marked lightcurve |
|---|---|---|---|---|---|---|---|
| A | 7267 | 6888 | 1 | 1 | 0.01% | 0.01% | 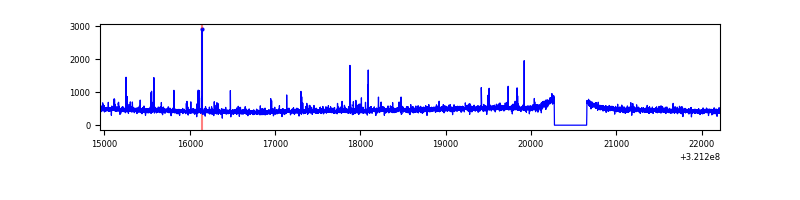 |
| B | 7268 | 6889 | 4 | 4 | 0.06% | 0.06% | 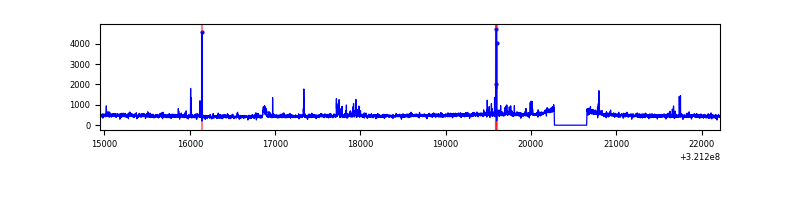 |
| C | 7268 | 6889 | 9 | 9 | 0.12% | 0.13% | 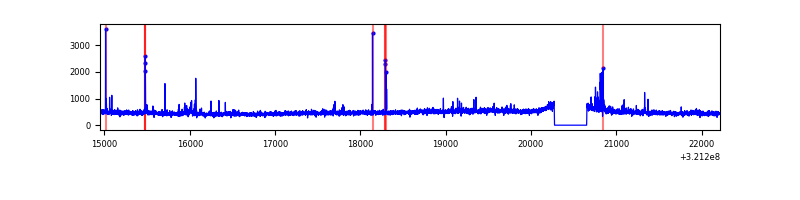 |
| D | 7268 | 6889 | 345 | 345 | 4.75% | 5.01% | 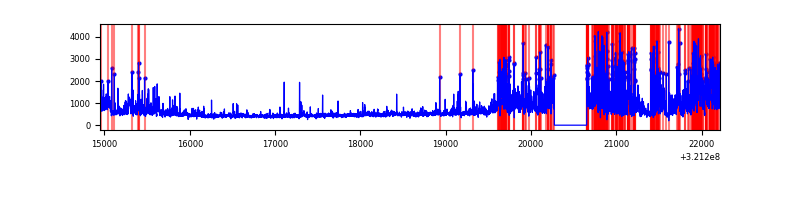 |
Top three noisy pixels from each quadrant. If the there are fewer than three noisy pixels in the level2.evt file, extra rows are filled as -1
| Pixel properties | Quadrant properties | ||||||
|---|---|---|---|---|---|---|---|
| Quadrant | DetID | PixID | Counts | Sigma | Mean | Median | Sigma |
| A | 6 | 16 | 78161 | 468.65 | 821 | 804 | 165.1 |
| A | 13 | 254 | 11737 | 66.23 | 821 | 804 | 165.1 |
| A | 3 | 137 | 7058 | 37.89 | 821 | 804 | 165.1 |
| B | 0 | 197 | 75643 | 488.44 | 820 | 800 | 153.2 |
| B | 7 | 202 | 19427 | 121.56 | 820 | 800 | 153.2 |
| B | 4 | 216 | 19169 | 119.88 | 820 | 800 | 153.2 |
| C | 0 | 239 | 132210 | 730.74 | 779 | 783 | 179.9 |
| C | 14 | 238 | 123904 | 684.55 | 779 | 783 | 179.9 |
| C | 7 | 247 | 54428 | 298.27 | 779 | 783 | 179.9 |
| D | 12 | 218 | 1257028 | 6659.97 | 770 | 746 | 188.6 |
| D | 8 | 195 | 676426 | 3582.01 | 770 | 746 | 188.6 |
| D | 1 | 52 | 229039 | 1210.26 | 770 | 746 | 188.6 |
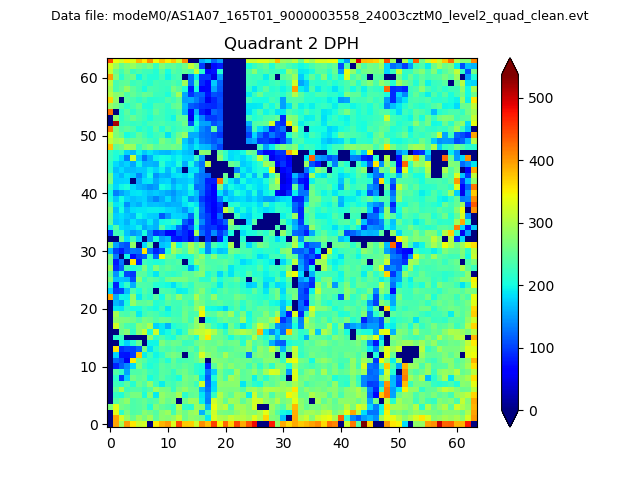
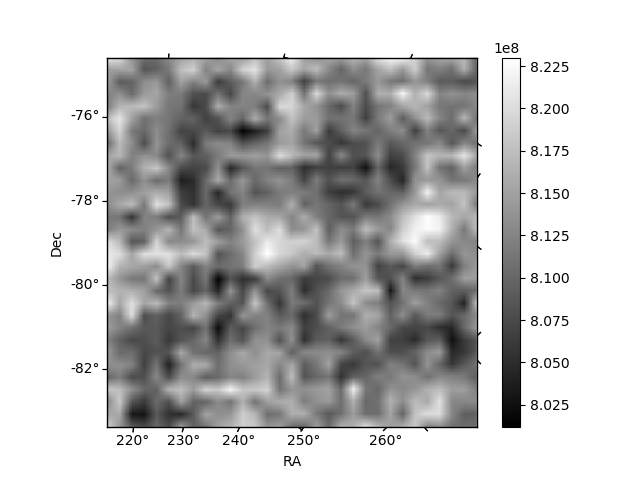
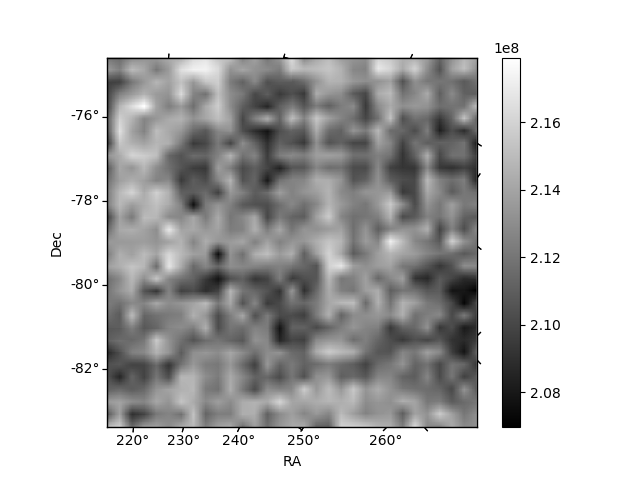
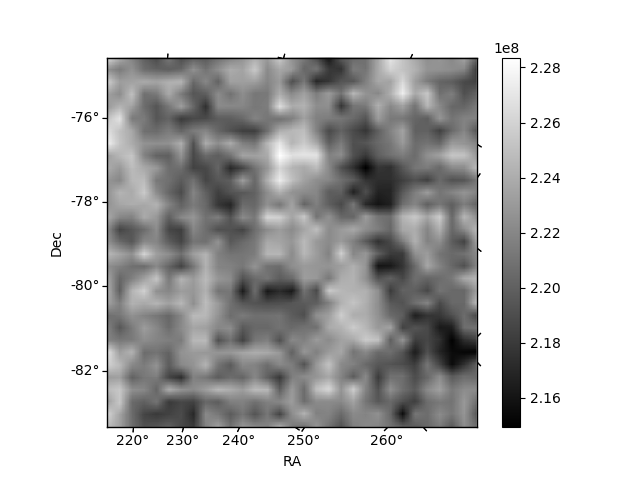
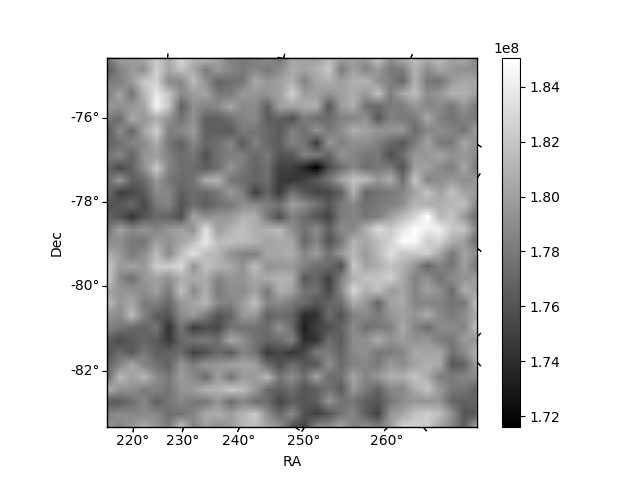
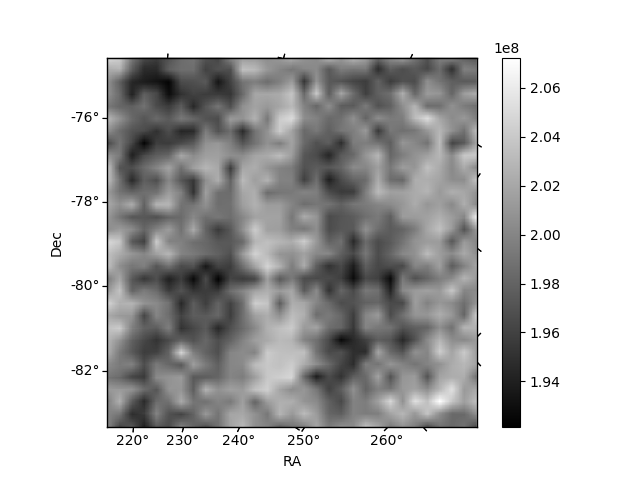
Histogram calculated using DETX and DETY for each event in the final _common_clean file
| Quadrant A | 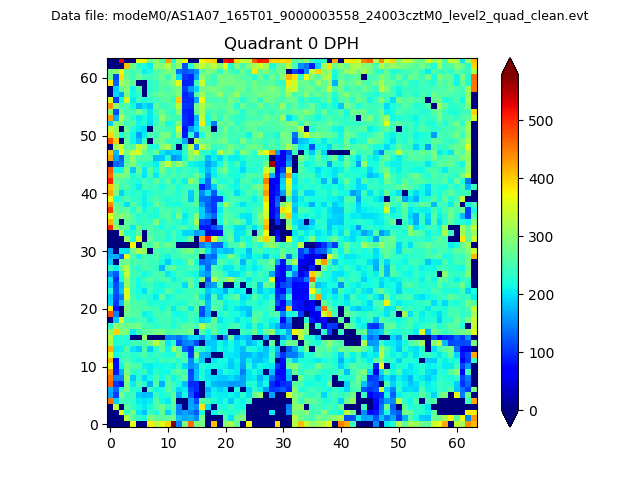 |
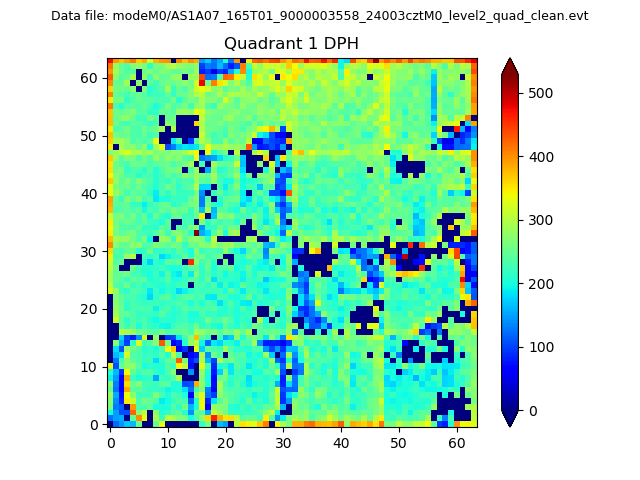 |
Quadrant B |
|---|---|---|---|
| Quadrant D | 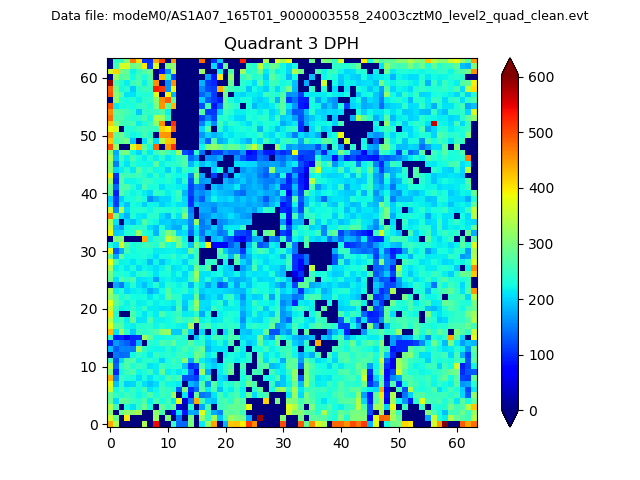 |
 |
Quadrant C |
| Plot type | Count rate plots | Images |
|---|---|---|
| Comparison with Poisson distribution Blue bars denote a histogram of data divided into 1 sec bins. Red curve is a Poisson curve with rate = median count rate of data. |
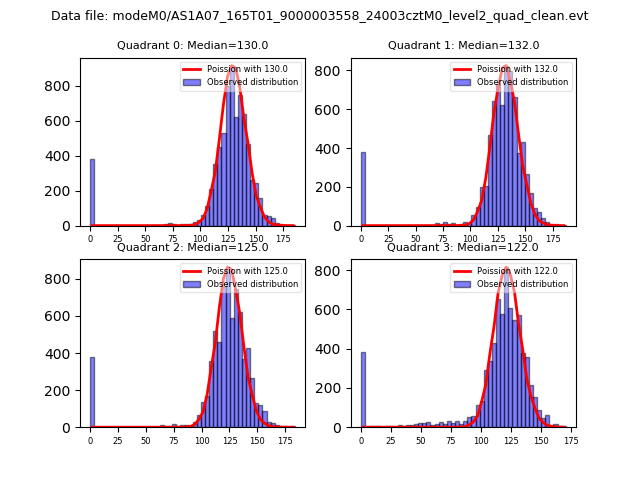 |
 |
| Quadrant-wise count rates Data is divided into 100 sec bins |
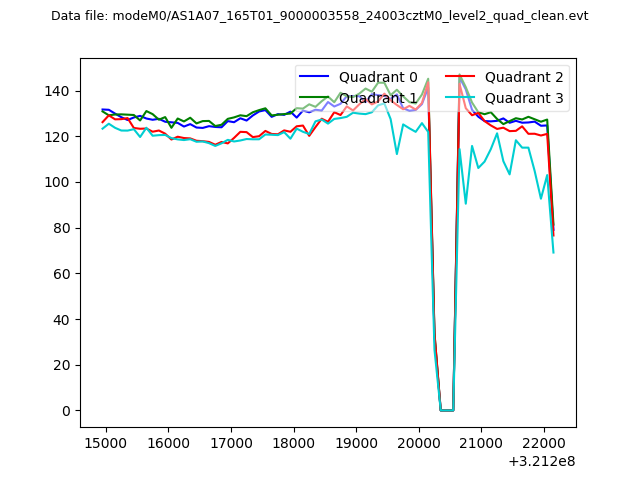 |
|
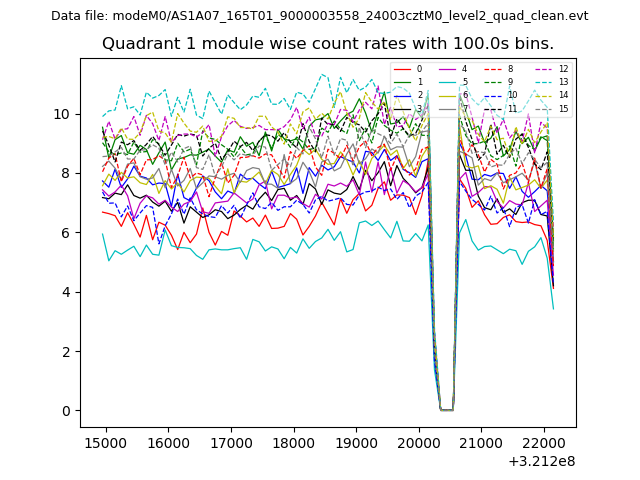
| Module-wise count rates for Quadrant A Data is divided into 100 sec bins |
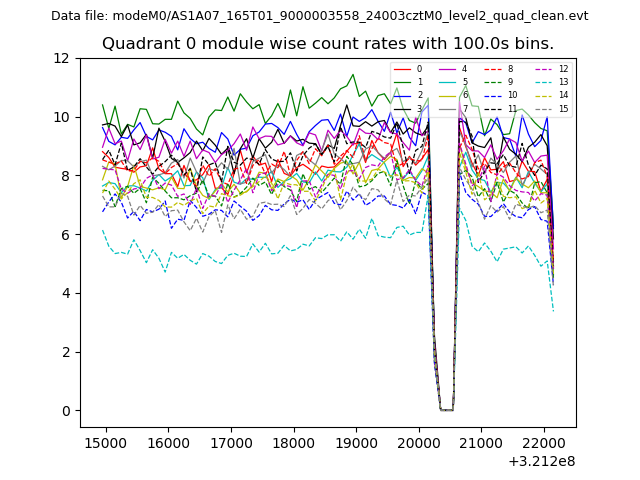 |
 |
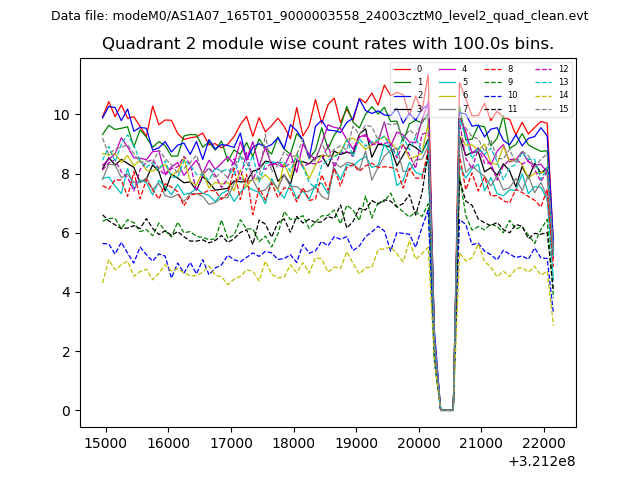
| Module-wise count rates for Quadrant B Data is divided into 100 sec bins |
 |
 |
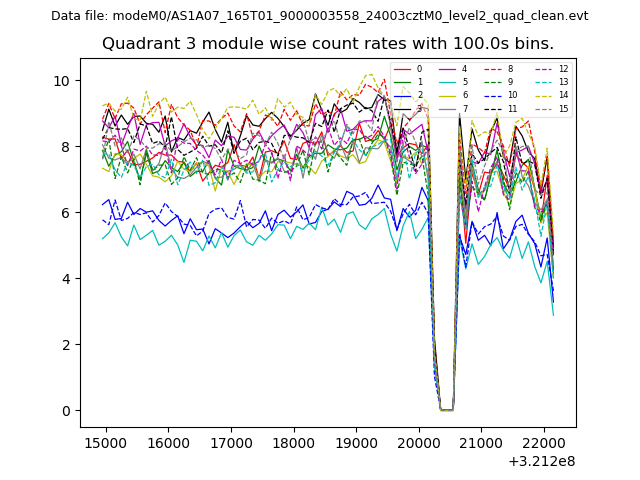
| Module-wise count rates for Quadrant C Data is divided into 100 sec bins |
 |
 |
| Module-wise count rates for Quadrant D Data is divided into 100 sec bins |
 |
 |
| Parameter | Plot |
|---|---|
| CZT HV Monitor | 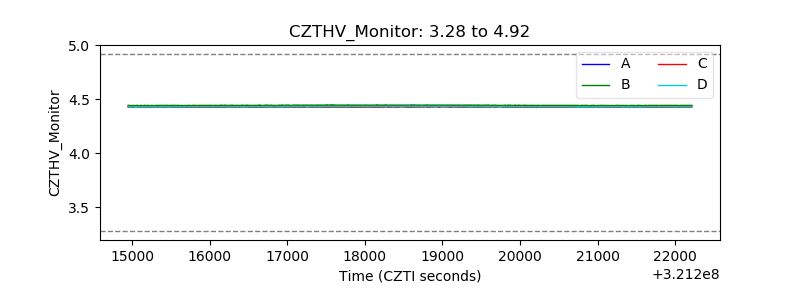 |
| D_VDD | 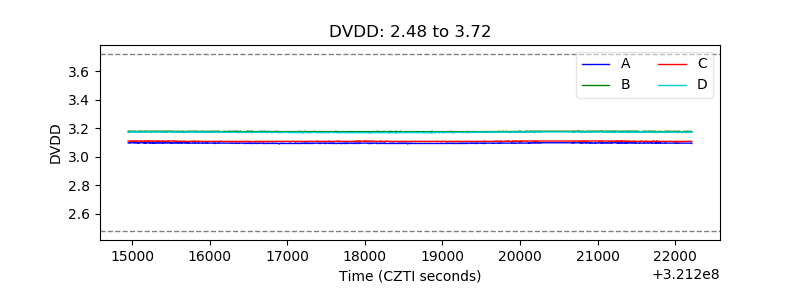 |
| Temperature 1 | 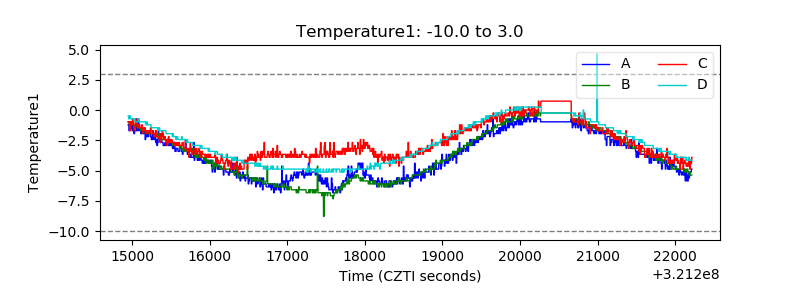 |
| Veto HV Monitor | 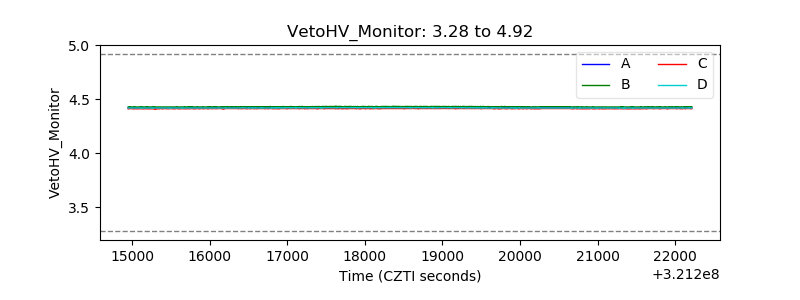 |
| Veto LLD | 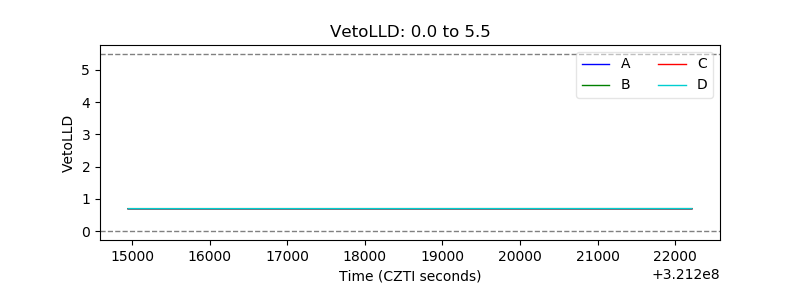 |
| Alpha Counter | 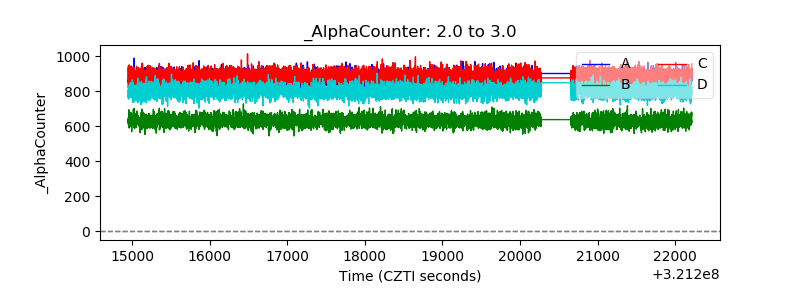 |
| _CPM_Rate | 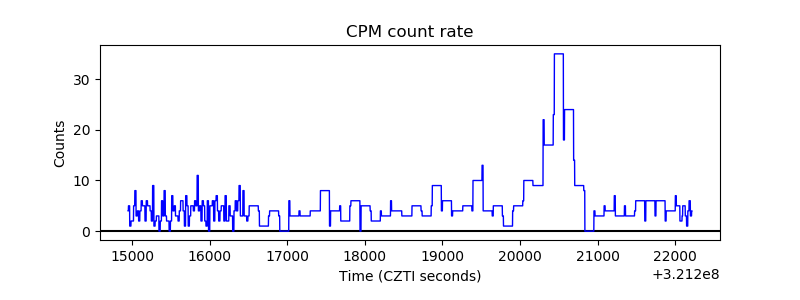 |
| CZT Counter | 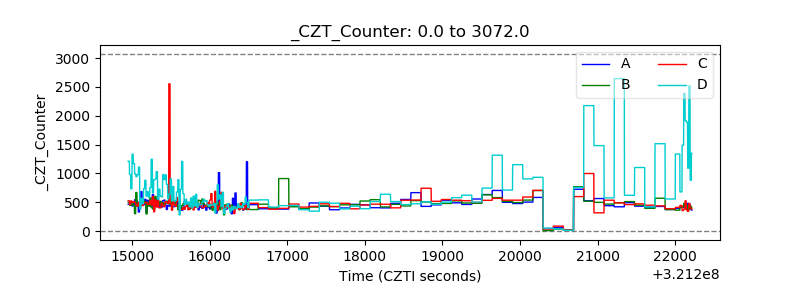 |
| +2.5 Volts monitor | 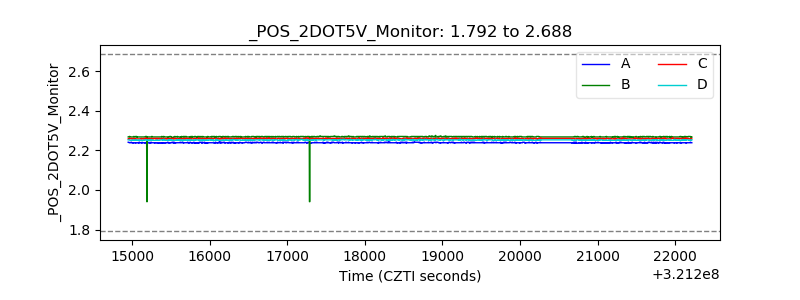 |
| +5 Volts monitor | 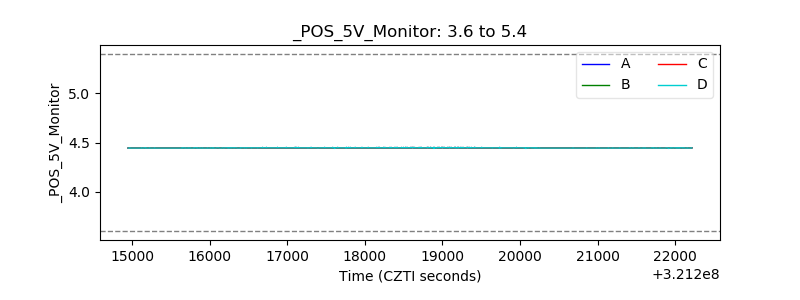 |
| _ROLL_ROT | 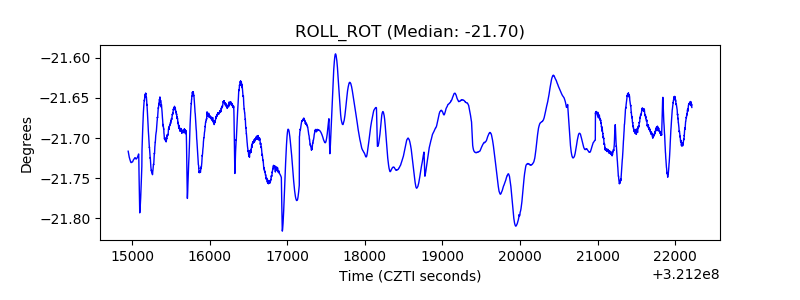 |
| _Roll_DEC | 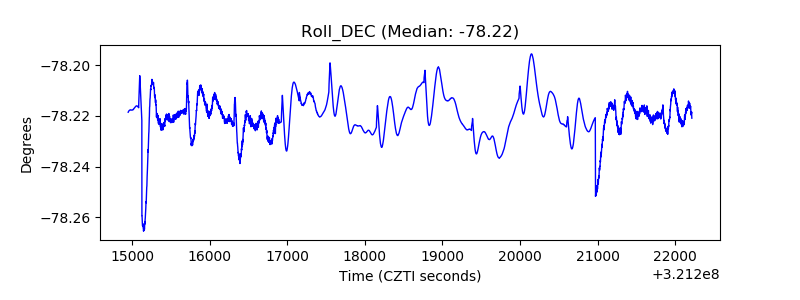 |
| _Roll_RA | 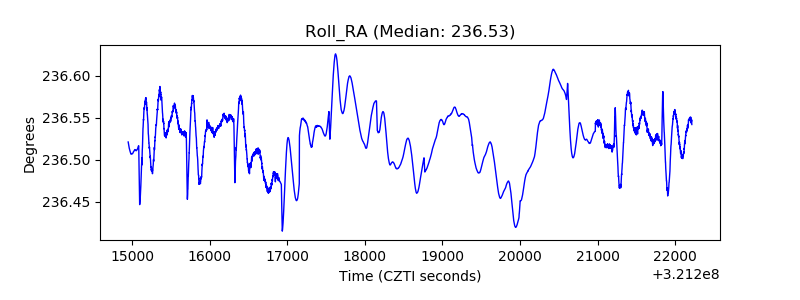 |
| Veto Counter | 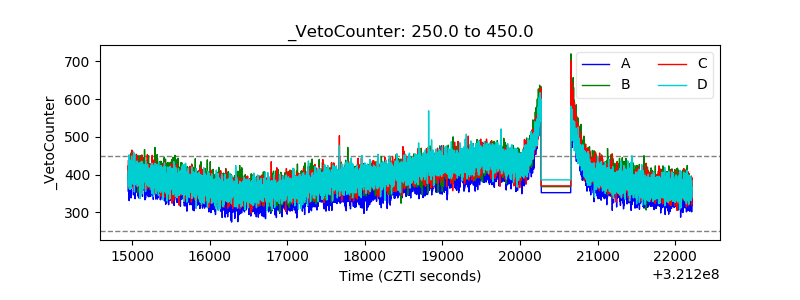 |