| Param | Original file | Final file |
|---|---|---|
| Filename | modeM0/AS1A07_165T01_9000003558_24007cztM0_level2.evt | modeM0/AS1A07_165T01_9000003558_24007cztM0_level2_quad_clean.evt |
| Size (bytes) | 791,043,840 | 213,658,560 |
| Size | 754.4 MB | 203.8 MB |
| Events in quadrant A | 5,228,799 | 1,449,460 |
| Events in quadrant B | 5,595,339 | 1,470,555 |
| Events in quadrant C | 5,568,023 | 1,395,188 |
| Events in quadrant D | 6,792,074 | 1,367,229 |
| Mode M9 | |||
|---|---|---|---|
| Quadrant | BADHDUFLAG | Total packets | Discarded packets |
| A | 0 | 4 | 0 |
| B | 0 | 5 | 0 |
| C | 0 | 5 | 0 |
| D | 0 | 5 | 0 |
| Mode M0 | |||
|---|---|---|---|
| Quadrant | BADHDUFLAG | Total packets | Discarded packets |
| A | 0 | 23213 | 2 |
| B | 0 | 24057 | 2 |
| C | 0 | 23883 | 2 |
| D | 0 | 27791 | 2 |
| Mode SS | |||
|---|---|---|---|
| Quadrant | BADHDUFLAG | Total packets | Discarded packets |
| A | 0 | 230 | 0 |
| B | 0 | 230 | 0 |
| C | 0 | 230 | 0 |
| D | 0 | 230 | 0 |
| Quadrant | Total seconds | Saturated seconds | Saturation percentage |
|---|---|---|---|
| A | 11408 | 70 | 0.613604% |
| B | 11408 | 113 | 0.990533% |
| C | 11408 | 186 | 1.630435% |
| D | 11408 | 205 | 1.796985% |
Noise dominated data is calculated using 1-second bins in cleaned event files. If a bin has >2000 counts, and if more than 50% of those come from <1% of pixels, then it is considered to be noise-dominated and hence unusable.
| Quadrant | # 1 sec bins | Bins with >0 counts | Bins with >2000 counts | High rate bins dominated by noise | Noise dominated (total time) | Noise dominated (detector-on time) | Marked lightcurve |
|---|---|---|---|---|---|---|---|
| A | 11833 | 11410 | 5 | 5 | 0.04% | 0.04% | 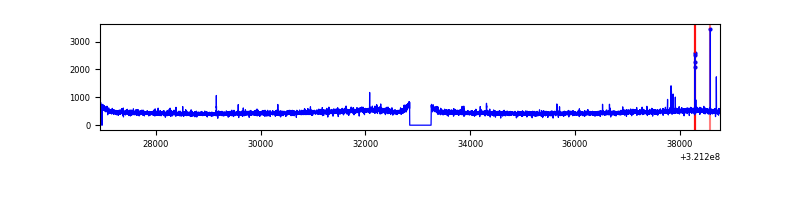 |
| B | 11833 | 11410 | 9 | 9 | 0.08% | 0.08% | 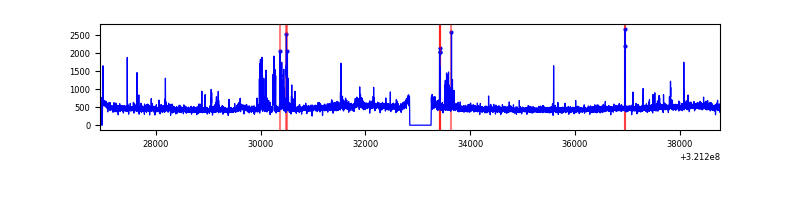 |
| C | 11833 | 11410 | 9 | 9 | 0.08% | 0.08% | 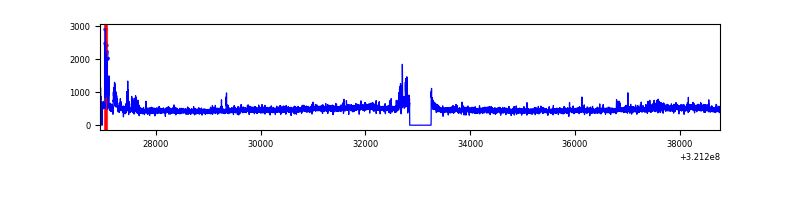 |
| D | 11833 | 11410 | 114 | 114 | 0.96% | 1.00% | 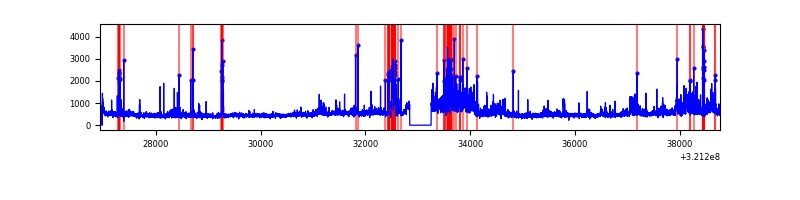 |
Top three noisy pixels from each quadrant. If the there are fewer than three noisy pixels in the level2.evt file, extra rows are filled as -1
| Pixel properties | Quadrant properties | ||||||
|---|---|---|---|---|---|---|---|
| Quadrant | DetID | PixID | Counts | Sigma | Mean | Median | Sigma |
| A | 6 | 16 | 34617 | 122.72 | 1347 | 1315 | 271.4 |
| A | 13 | 254 | 19436 | 66.78 | 1347 | 1315 | 271.4 |
| A | 0 | 226 | 11837 | 38.77 | 1347 | 1315 | 271.4 |
| B | 0 | 197 | 226320 | 897.0 | 1342 | 1308 | 250.9 |
| B | 7 | 202 | 47904 | 185.75 | 1342 | 1308 | 250.9 |
| B | 12 | 111 | 30211 | 115.22 | 1342 | 1308 | 250.9 |
| C | 14 | 238 | 205956 | 686.39 | 1287 | 1293 | 298.2 |
| C | 0 | 239 | 203384 | 677.76 | 1287 | 1293 | 298.2 |
| C | 7 | 247 | 119533 | 396.55 | 1287 | 1293 | 298.2 |
| D | 1 | 52 | 796785 | 2511.64 | 1304 | 1264 | 316.7 |
| D | 8 | 195 | 796159 | 2509.66 | 1304 | 1264 | 316.7 |
| D | 12 | 218 | 77051 | 239.28 | 1304 | 1264 | 316.7 |
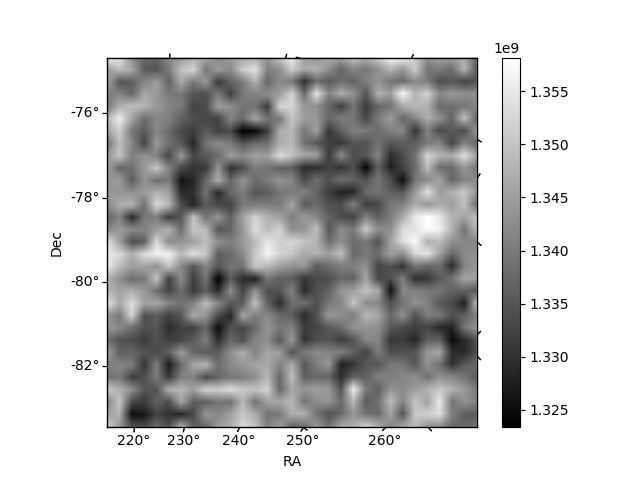
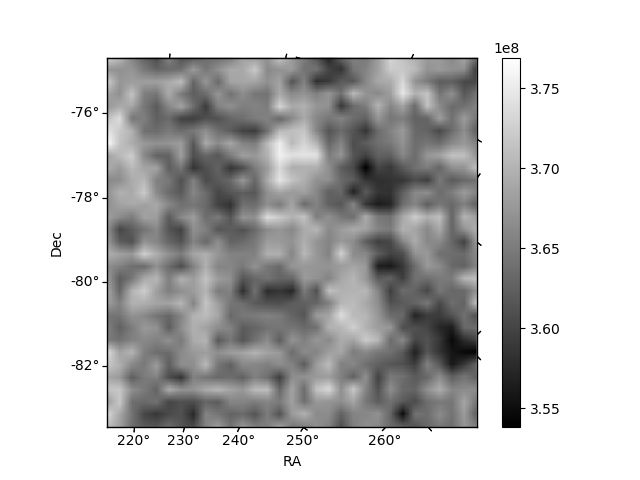
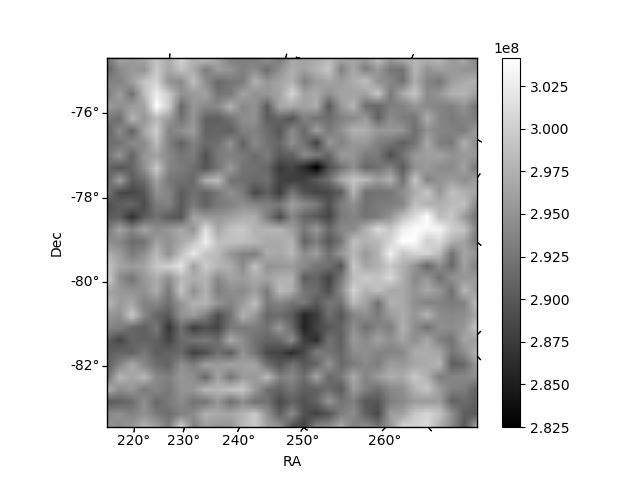
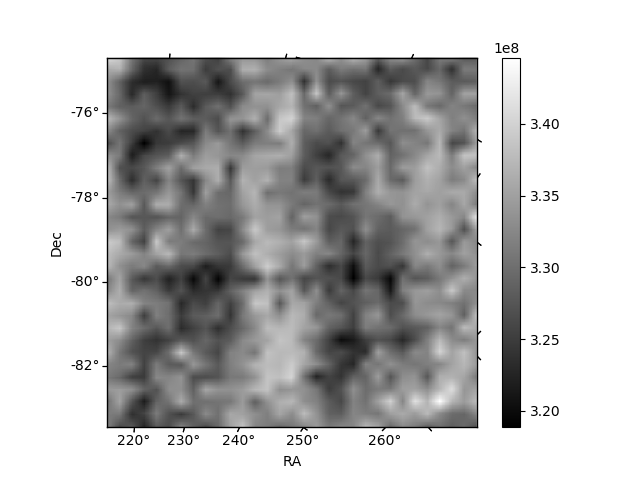
Histogram calculated using DETX and DETY for each event in the final _common_clean file
| Quadrant A | 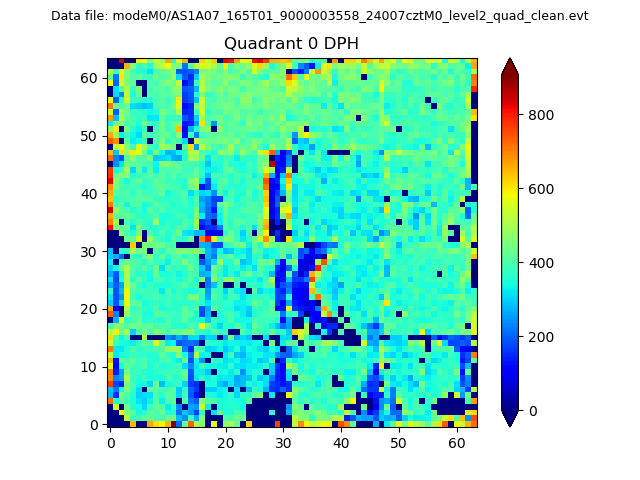 |
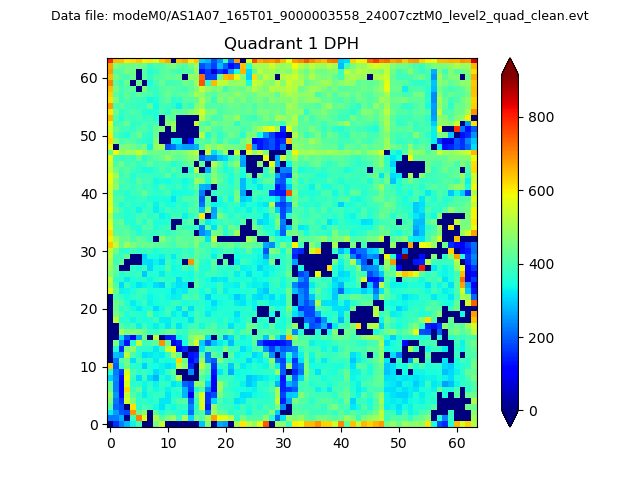 |
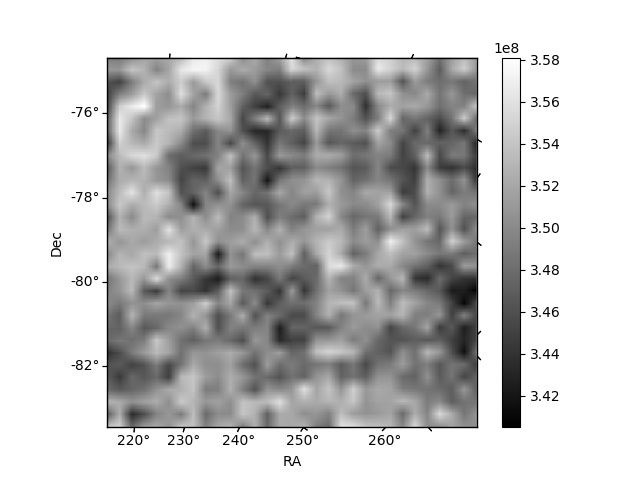
Quadrant B |
|---|---|---|---|
| Quadrant D | 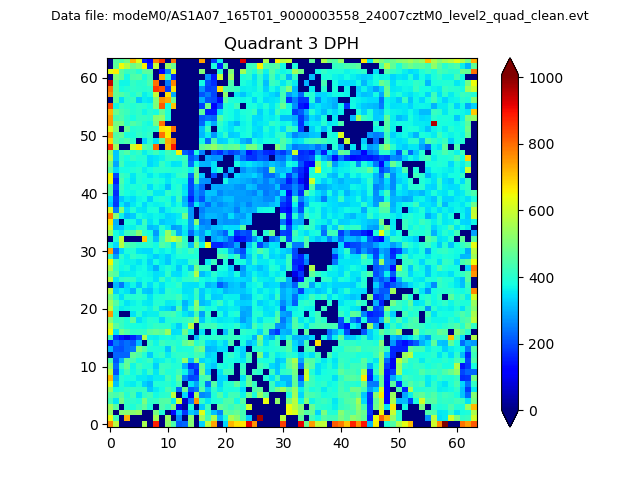 |
 |
Quadrant C |
| Plot type | Count rate plots | Images |
|---|---|---|
| Comparison with Poisson distribution Blue bars denote a histogram of data divided into 1 sec bins. Red curve is a Poisson curve with rate = median count rate of data. |
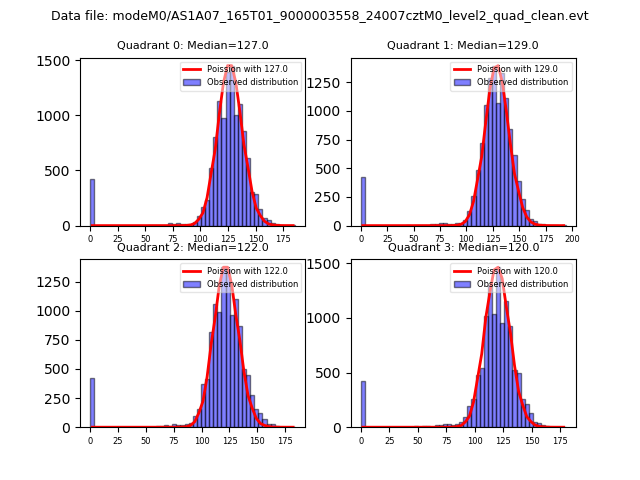 |
 |
| Quadrant-wise count rates Data is divided into 100 sec bins |
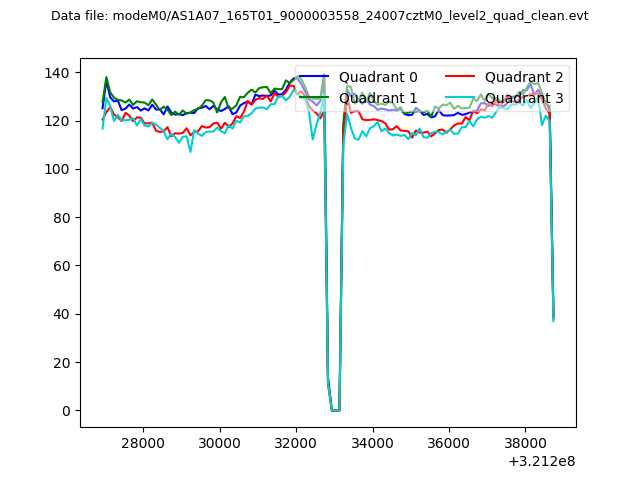 |
|
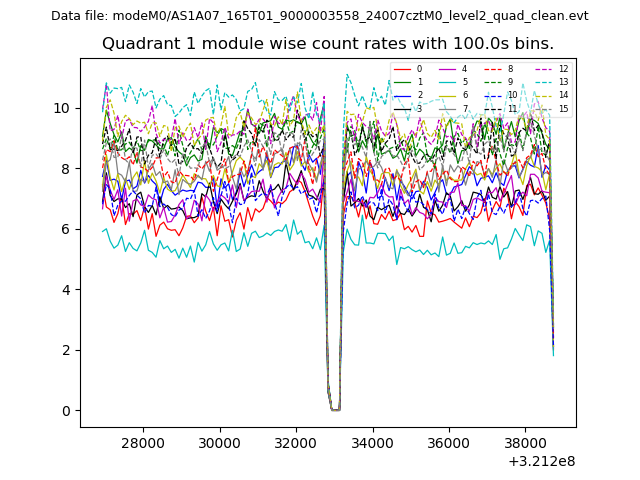
| Module-wise count rates for Quadrant A Data is divided into 100 sec bins |
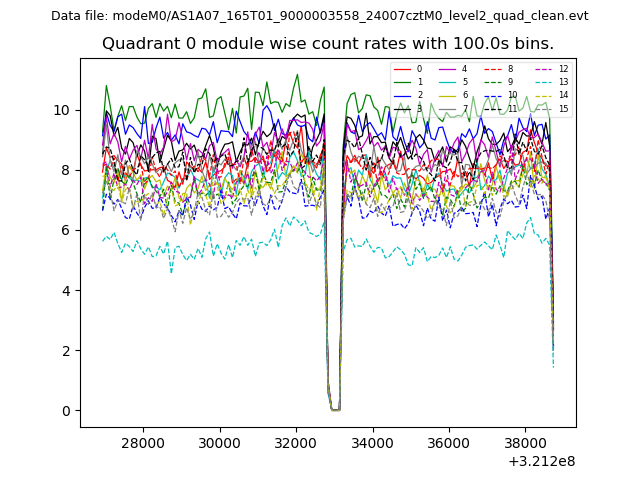 |
 |
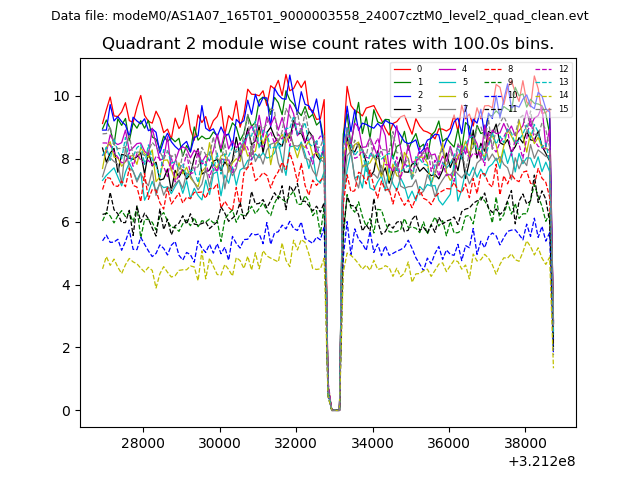
| Module-wise count rates for Quadrant B Data is divided into 100 sec bins |
 |
 |
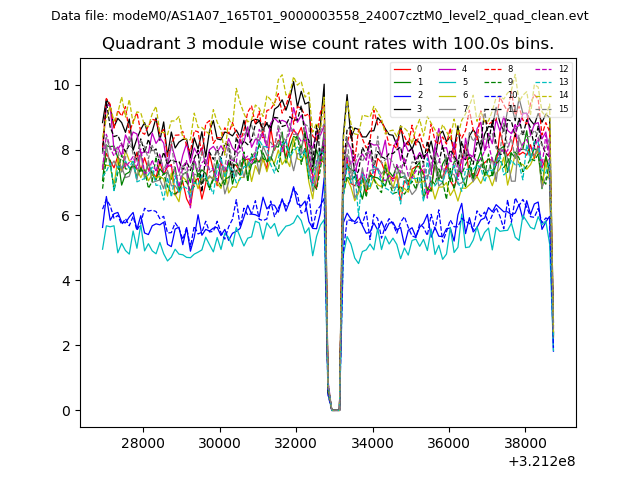
| Module-wise count rates for Quadrant C Data is divided into 100 sec bins |
 |
 |
| Module-wise count rates for Quadrant D Data is divided into 100 sec bins |
 |
 |
| Parameter | Plot |
|---|---|
| CZT HV Monitor | 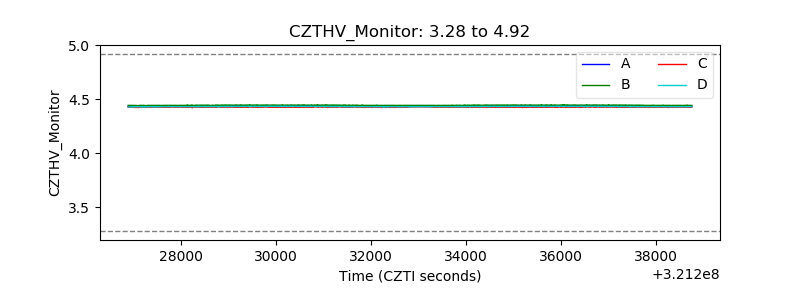 |
| D_VDD | 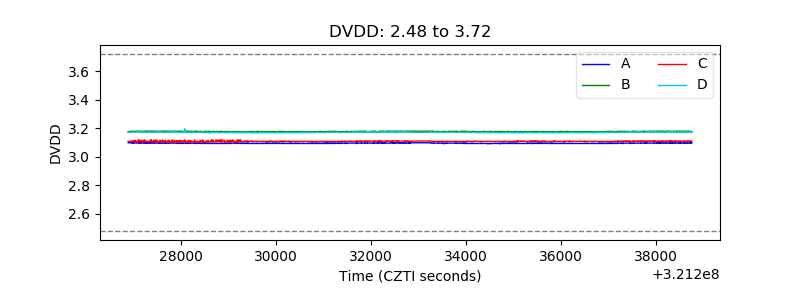 |
| Temperature 1 | 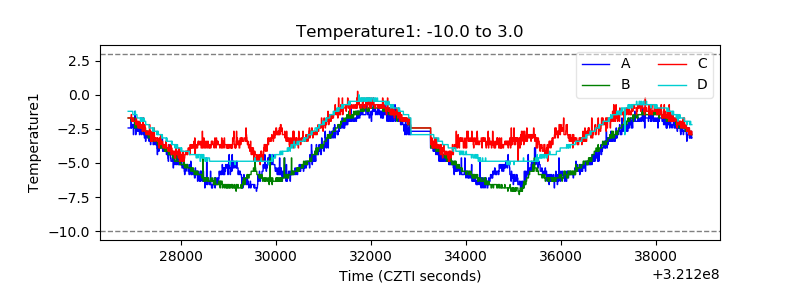 |
| Veto HV Monitor | 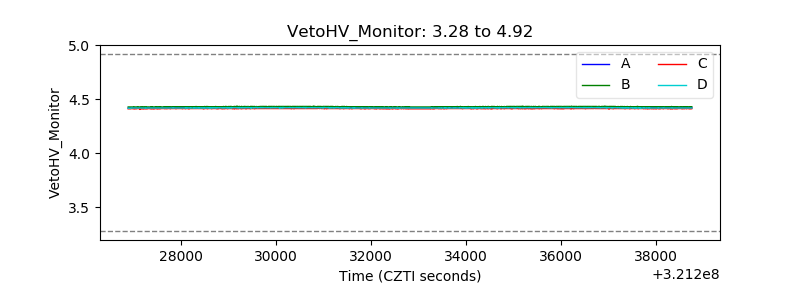 |
| Veto LLD | 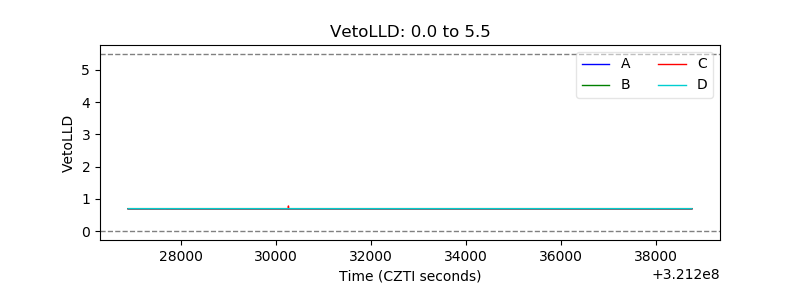 |
| Alpha Counter | 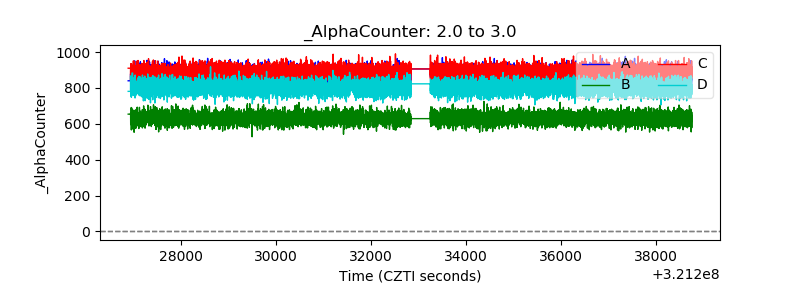 |
| _CPM_Rate | 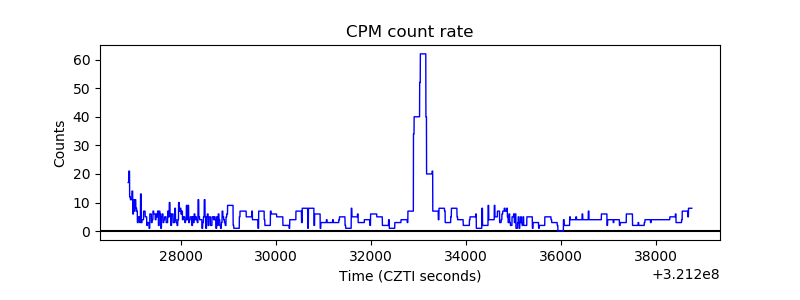 |
| CZT Counter | 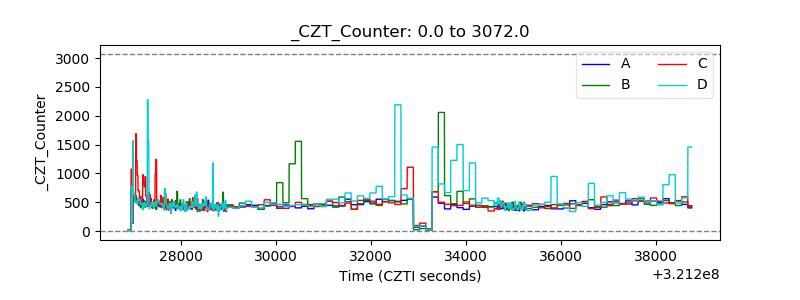 |
| +2.5 Volts monitor |  |
| +5 Volts monitor | 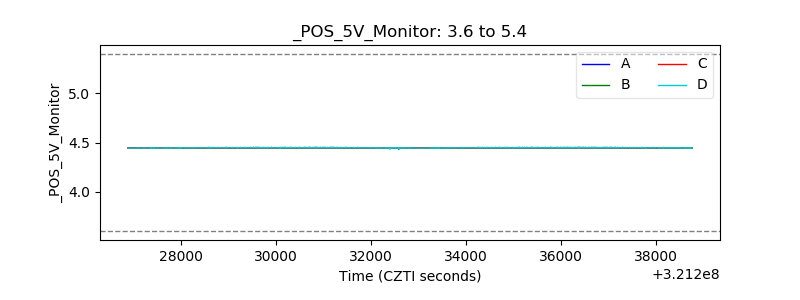 |
| _ROLL_ROT | 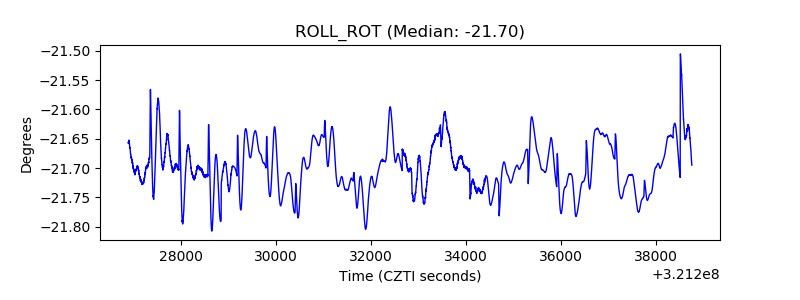 |
| _Roll_DEC | 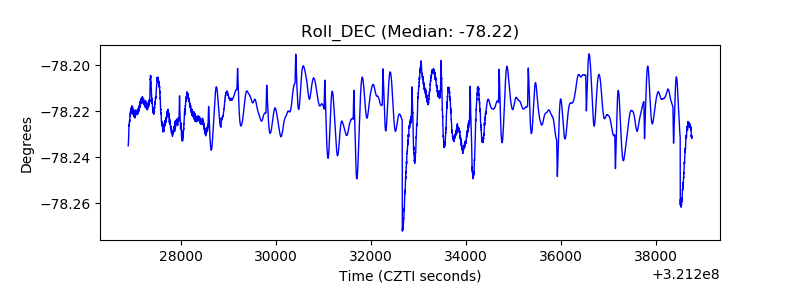 |
| _Roll_RA | 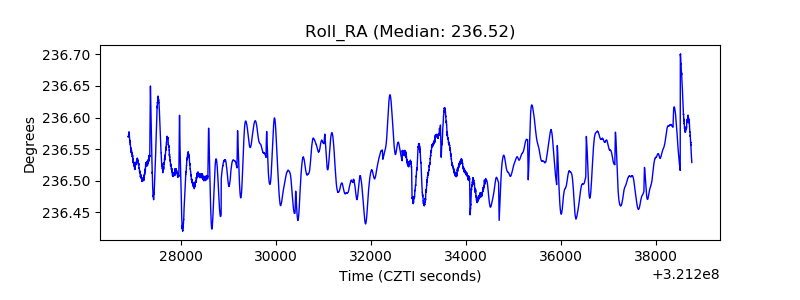 |
| Veto Counter | 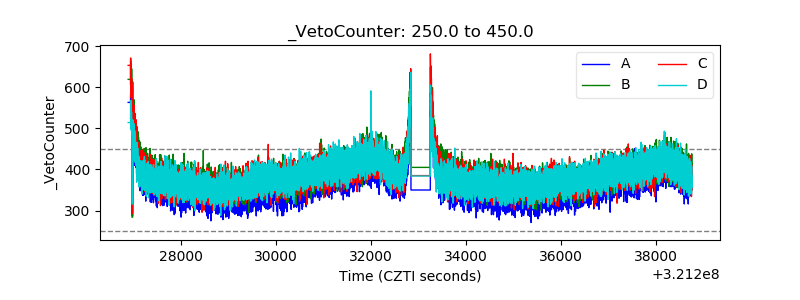 |