| Param | Original file | Final file |
|---|---|---|
| Filename | modeM0/AS1A07_165T01_9000003558_24008cztM0_level2.evt | modeM0/AS1A07_165T01_9000003558_24008cztM0_level2_quad_clean.evt |
| Size (bytes) | 978,379,200 | 248,232,960 |
| Size | 933.1 MB | 236.7 MB |
| Events in quadrant A | 6,295,673 | 1,677,889 |
| Events in quadrant B | 6,310,036 | 1,722,225 |
| Events in quadrant C | 6,347,376 | 1,642,459 |
| Events in quadrant D | 9,791,039 | 1,570,943 |
| Mode M9 | |||
|---|---|---|---|
| Quadrant | BADHDUFLAG | Total packets | Discarded packets |
| A | 0 | 22 | 0 |
| B | 0 | 22 | 0 |
| C | 0 | 22 | 0 |
| D | 0 | 22 | 0 |
| Mode M0 | |||
|---|---|---|---|
| Quadrant | BADHDUFLAG | Total packets | Discarded packets |
| A | 0 | 27280 | 3 |
| B | 0 | 27001 | 3 |
| C | 0 | 26905 | 3 |
| D | 0 | 37950 | 3 |
| Mode SS | |||
|---|---|---|---|
| Quadrant | BADHDUFLAG | Total packets | Discarded packets |
| A | 0 | 268 | 0 |
| B | 0 | 268 | 0 |
| C | 0 | 268 | 0 |
| D | 0 | 268 | 0 |
| Quadrant | Total seconds | Saturated seconds | Saturation percentage |
|---|---|---|---|
| A | 13105 | 112 | 0.854636% |
| B | 13106 | 93 | 0.709599% |
| C | 13106 | 169 | 1.289486% |
| D | 13106 | 652 | 4.974821% |
Noise dominated data is calculated using 1-second bins in cleaned event files. If a bin has >2000 counts, and if more than 50% of those come from <1% of pixels, then it is considered to be noise-dominated and hence unusable.
| Quadrant | # 1 sec bins | Bins with >0 counts | Bins with >2000 counts | High rate bins dominated by noise | Noise dominated (total time) | Noise dominated (detector-on time) | Marked lightcurve |
|---|---|---|---|---|---|---|---|
| A | 15365 | 13108 | 24 | 24 | 0.16% | 0.18% | 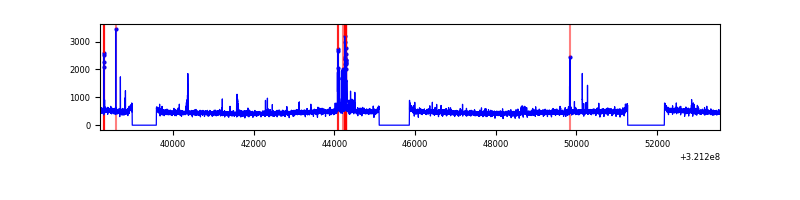 |
| B | 15366 | 13109 | 12 | 12 | 0.08% | 0.09% | 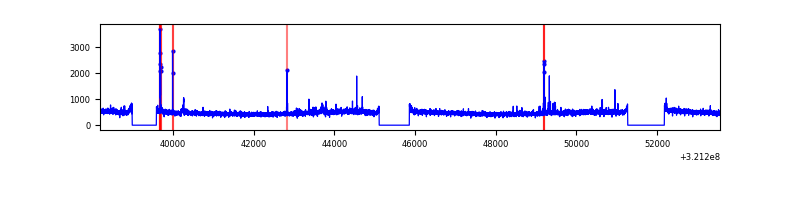 |
| C | 15366 | 13109 | 9 | 9 | 0.06% | 0.07% | 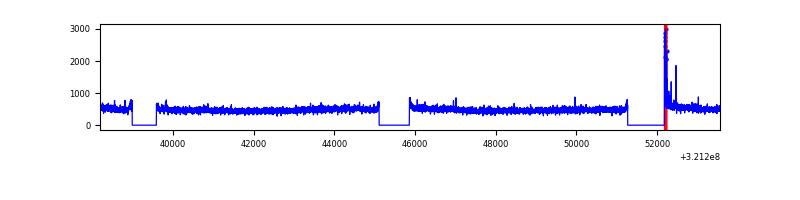 |
| D | 15366 | 13109 | 453 | 453 | 2.95% | 3.46% | 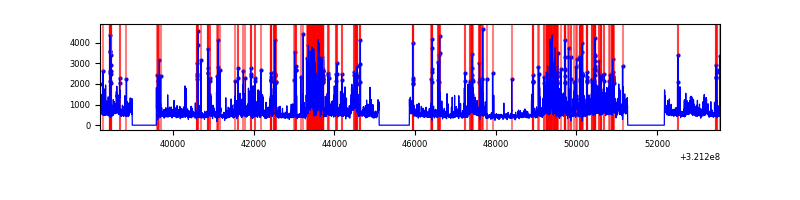 |
Top three noisy pixels from each quadrant. If the there are fewer than three noisy pixels in the level2.evt file, extra rows are filled as -1
| Pixel properties | Quadrant properties | ||||||
|---|---|---|---|---|---|---|---|
| Quadrant | DetID | PixID | Counts | Sigma | Mean | Median | Sigma |
| A | 6 | 16 | 228560 | 721.36 | 1571 | 1535 | 314.7 |
| A | 13 | 254 | 20253 | 59.48 | 1571 | 1535 | 314.7 |
| A | 3 | 137 | 13734 | 38.76 | 1571 | 1535 | 314.7 |
| B | 0 | 197 | 74753 | 247.54 | 1571 | 1531 | 295.8 |
| B | 0 | 190 | 48053 | 157.27 | 1571 | 1531 | 295.8 |
| B | 12 | 111 | 36378 | 117.8 | 1571 | 1531 | 295.8 |
| C | 14 | 238 | 241098 | 681.64 | 1515 | 1523 | 351.5 |
| C | 7 | 247 | 135172 | 380.26 | 1515 | 1523 | 351.5 |
| C | 0 | 239 | 67254 | 187.02 | 1515 | 1523 | 351.5 |
| D | 8 | 195 | 1545915 | 4255.77 | 1508 | 1467 | 362.9 |
| D | 1 | 52 | 1292893 | 3558.56 | 1508 | 1467 | 362.9 |
| D | 12 | 218 | 967432 | 2661.74 | 1508 | 1467 | 362.9 |
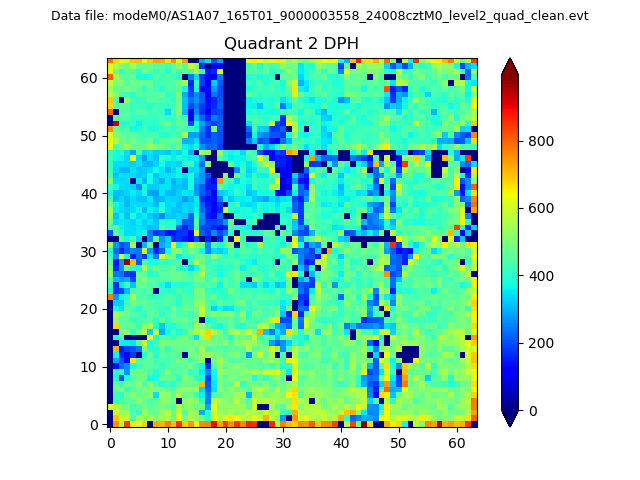
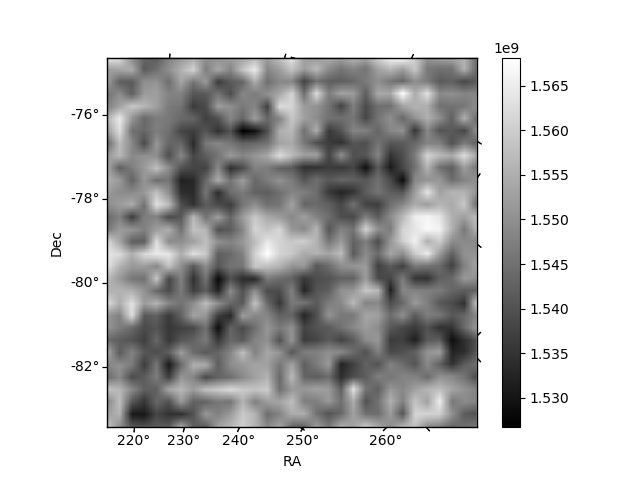
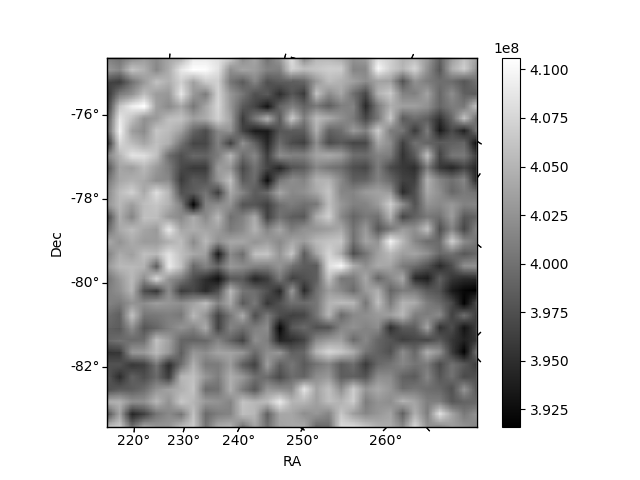
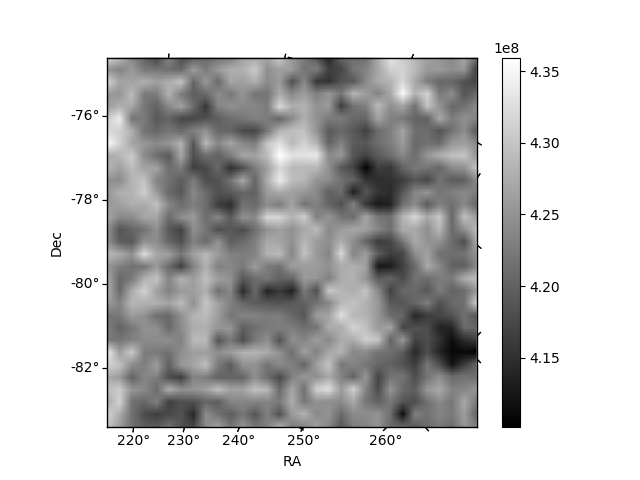
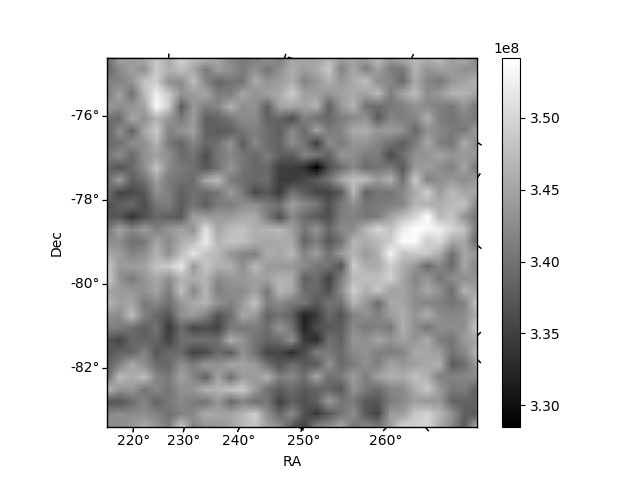
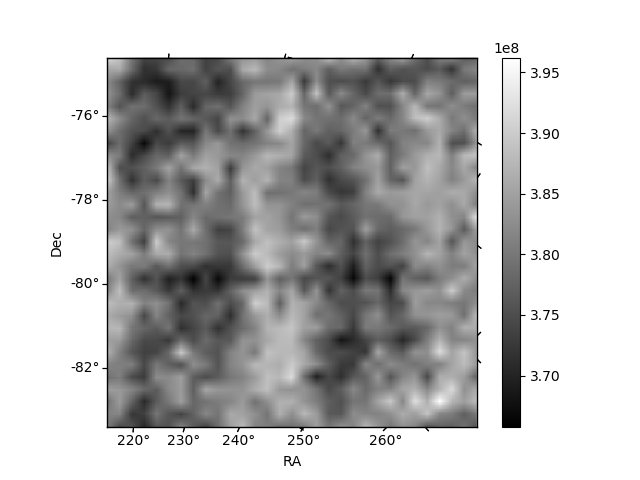
Histogram calculated using DETX and DETY for each event in the final _common_clean file
| Quadrant A | 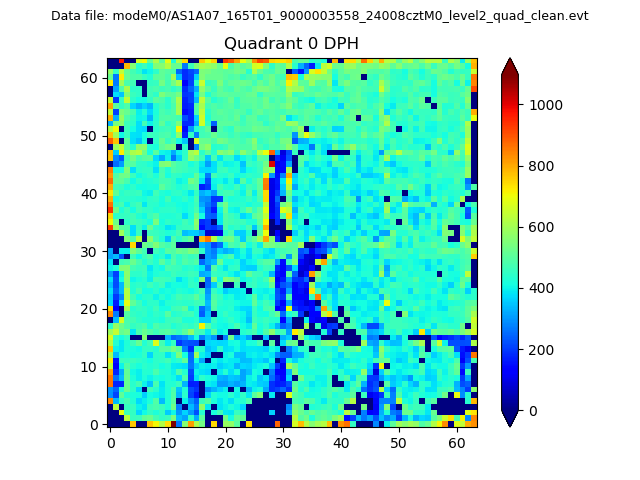 |
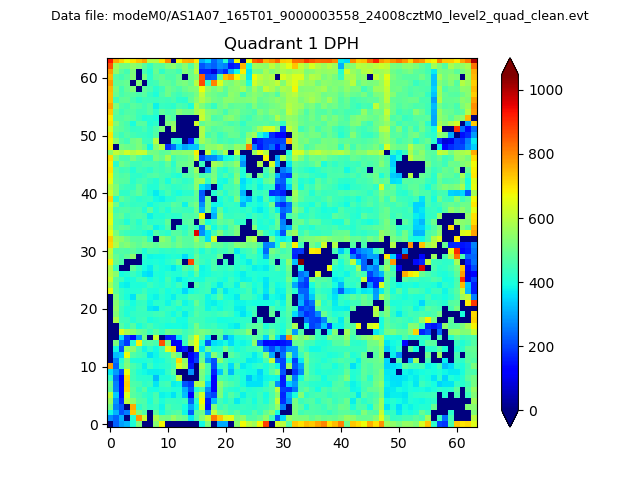 |
Quadrant B |
|---|---|---|---|
| Quadrant D | 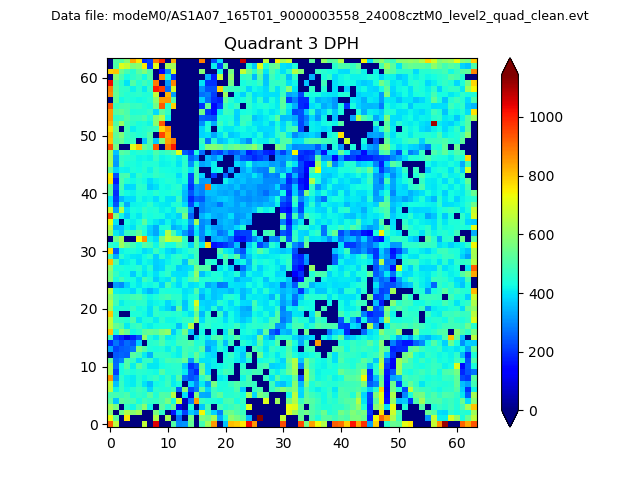 |
 |
Quadrant C |
| Plot type | Count rate plots | Images |
|---|---|---|
| Comparison with Poisson distribution Blue bars denote a histogram of data divided into 1 sec bins. Red curve is a Poisson curve with rate = median count rate of data. |
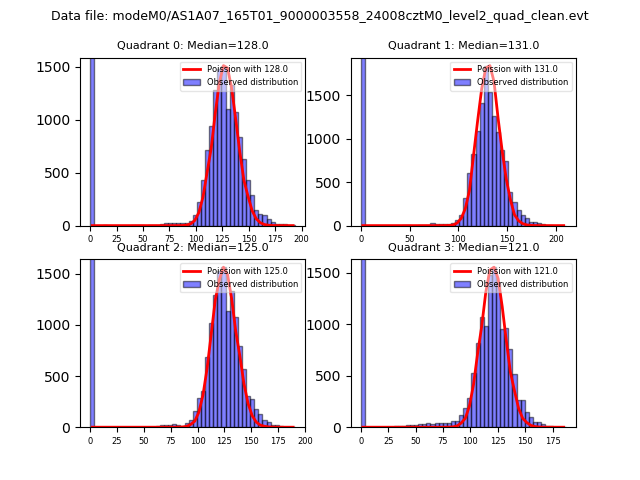 |
 |
| Quadrant-wise count rates Data is divided into 100 sec bins |
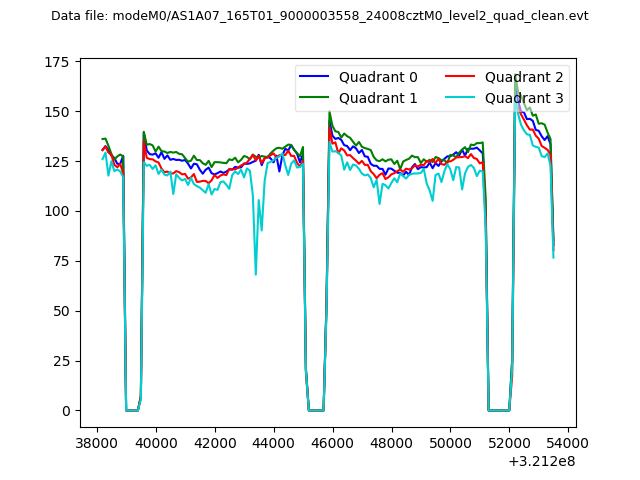 |
|
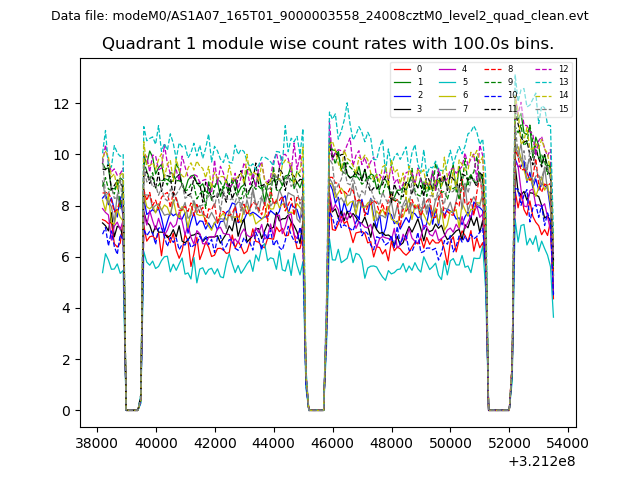
| Module-wise count rates for Quadrant A Data is divided into 100 sec bins |
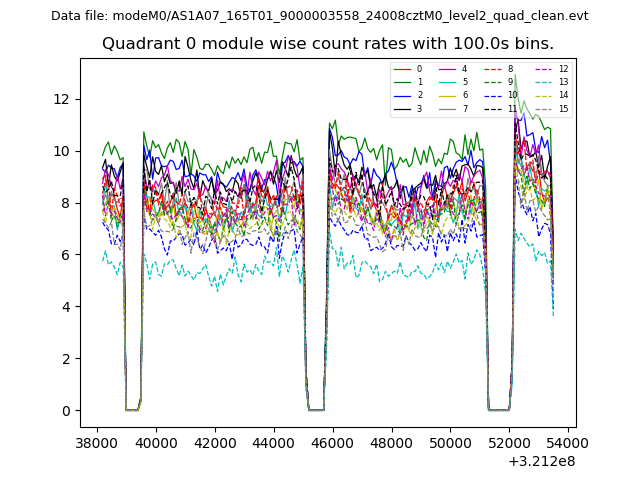 |
 |
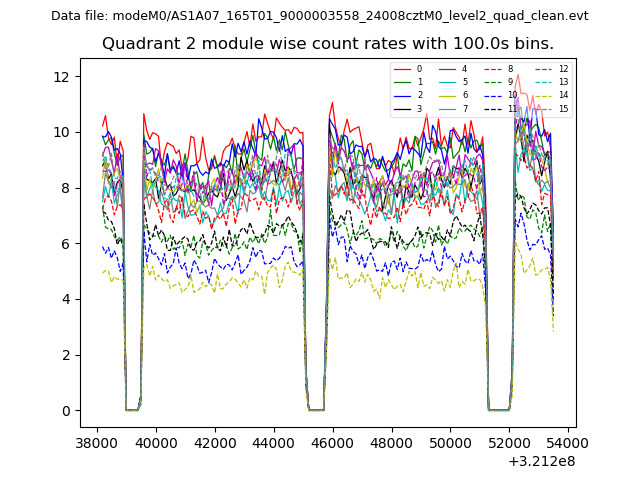
| Module-wise count rates for Quadrant B Data is divided into 100 sec bins |
 |
 |
| Module-wise count rates for Quadrant C Data is divided into 100 sec bins |
 |
 |
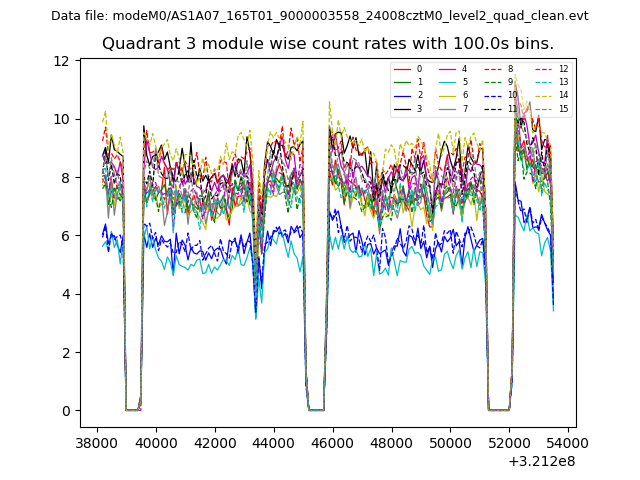
| Module-wise count rates for Quadrant D Data is divided into 100 sec bins |
 |
 |
| Parameter | Plot |
|---|---|
| CZT HV Monitor | 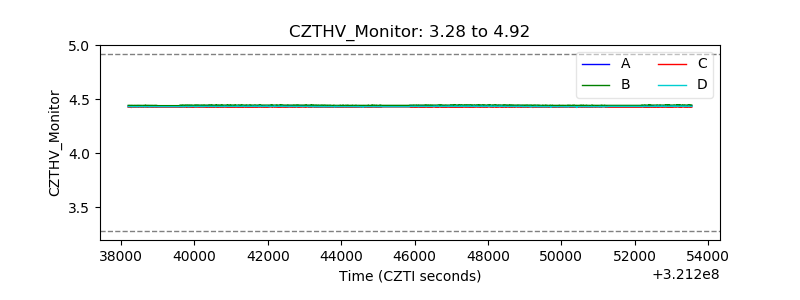 |
| D_VDD | 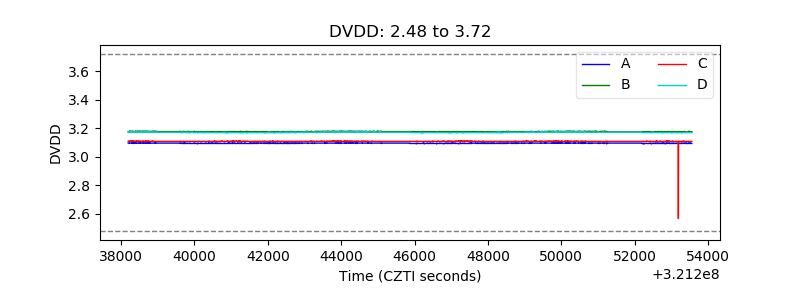 |
| Temperature 1 | 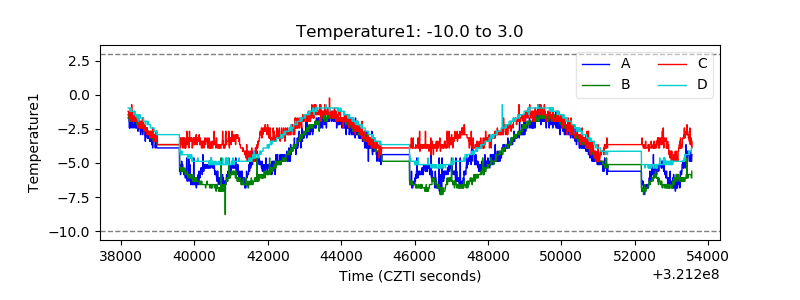 |
| Veto HV Monitor |  |
| Veto LLD | 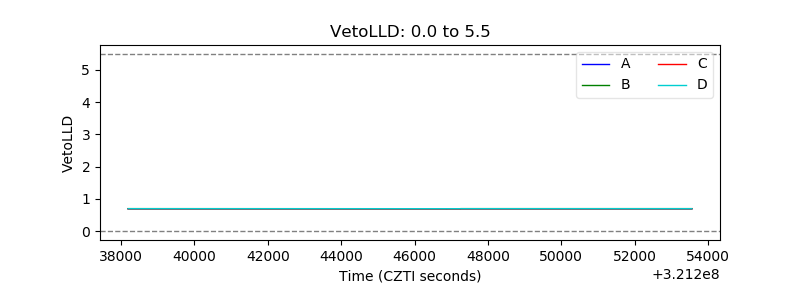 |
| Alpha Counter |  |
| _CPM_Rate | 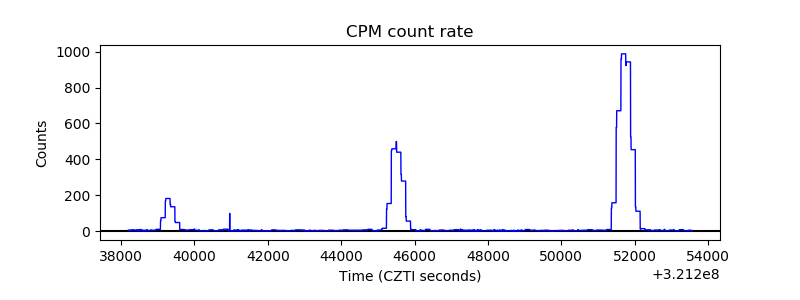 |
| CZT Counter | 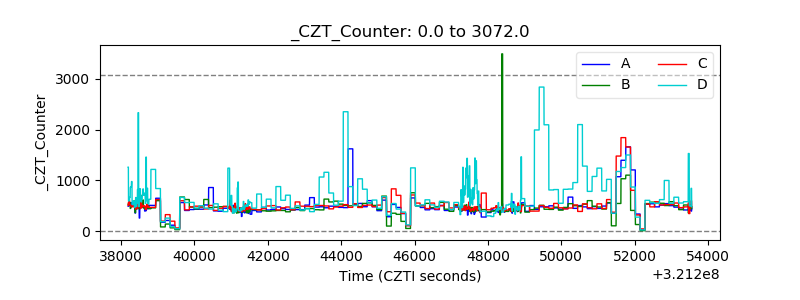 |
| +2.5 Volts monitor |  |
| +5 Volts monitor |  |
| _ROLL_ROT | 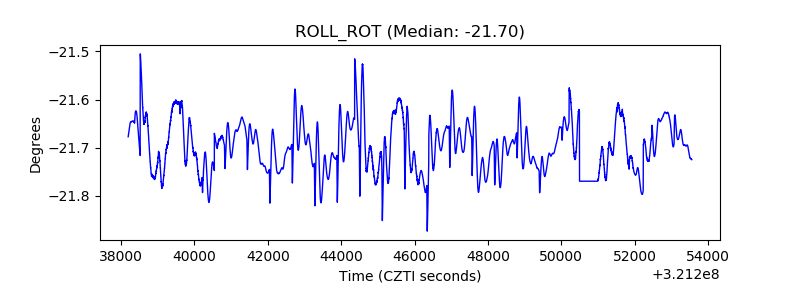 |
| _Roll_DEC | 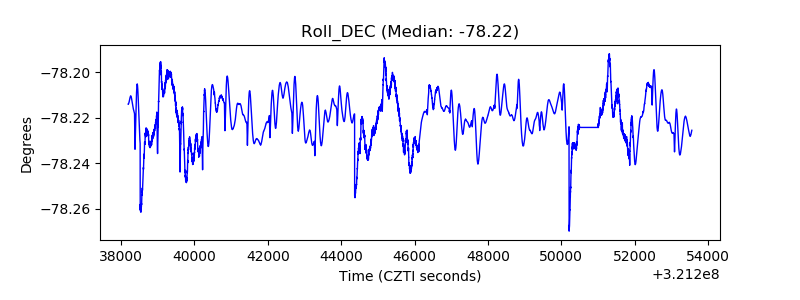 |
| _Roll_RA | 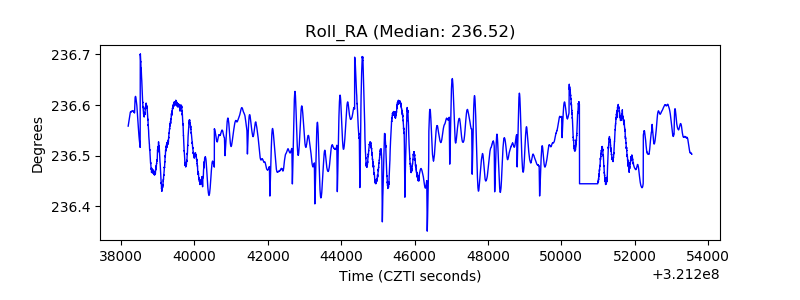 |
| Veto Counter | 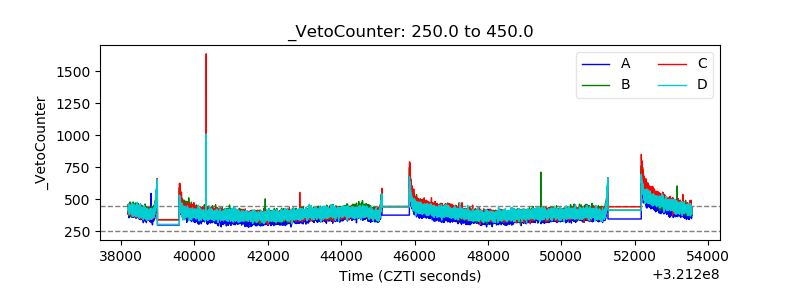 |