| Param | Original file | Final file |
|---|---|---|
| Filename | modeM0/AS1A07_165T01_9000003558_24009cztM0_level2.evt | modeM0/AS1A07_165T01_9000003558_24009cztM0_level2_quad_clean.evt |
| Size (bytes) | 498,674,880 | 134,461,440 |
| Size | 475.6 MB | 128.2 MB |
| Events in quadrant A | 3,229,697 | 916,674 |
| Events in quadrant B | 3,438,165 | 936,251 |
| Events in quadrant C | 3,397,691 | 897,230 |
| Events in quadrant D | 4,585,985 | 859,302 |
| Mode M9 | |||
|---|---|---|---|
| Quadrant | BADHDUFLAG | Total packets | Discarded packets |
| A | 0 | 14 | 0 |
| B | 0 | 15 | 0 |
| C | 0 | 15 | 0 |
| D | 0 | 15 | 0 |
| Mode M0 | |||
|---|---|---|---|
| Quadrant | BADHDUFLAG | Total packets | Discarded packets |
| A | 0 | 13802 | 2 |
| B | 0 | 14382 | 2 |
| C | 0 | 14232 | 2 |
| D | 0 | 17861 | 2 |
| Mode SS | |||
|---|---|---|---|
| Quadrant | BADHDUFLAG | Total packets | Discarded packets |
| A | 0 | 136 | 0 |
| B | 0 | 136 | 0 |
| C | 0 | 136 | 0 |
| D | 0 | 136 | 0 |
| Quadrant | Total seconds | Saturated seconds | Saturation percentage |
|---|---|---|---|
| A | 6641 | 33 | 0.496913% |
| B | 6641 | 63 | 0.948652% |
| C | 6640 | 95 | 1.430723% |
| D | 6640 | 321 | 4.834337% |
Noise dominated data is calculated using 1-second bins in cleaned event files. If a bin has >2000 counts, and if more than 50% of those come from <1% of pixels, then it is considered to be noise-dominated and hence unusable.
| Quadrant | # 1 sec bins | Bins with >0 counts | Bins with >2000 counts | High rate bins dominated by noise | Noise dominated (total time) | Noise dominated (detector-on time) | Marked lightcurve |
|---|---|---|---|---|---|---|---|
| A | 7671 | 6642 | 3 | 3 | 0.04% | 0.05% | 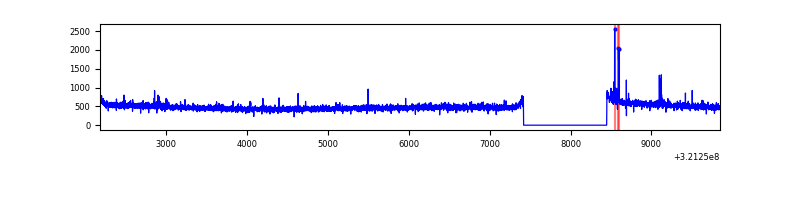 |
| B | 7671 | 6642 | 21 | 21 | 0.27% | 0.32% | 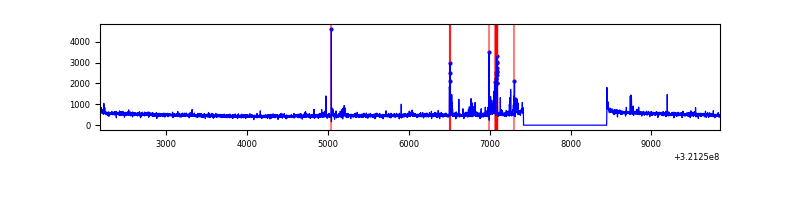 |
| C | 7670 | 6641 | 9 | 9 | 0.12% | 0.14% | 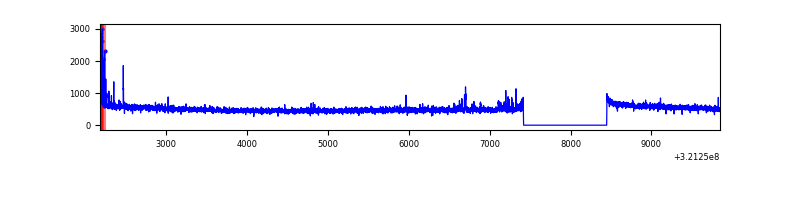 |
| D | 7670 | 6641 | 222 | 222 | 2.89% | 3.34% | 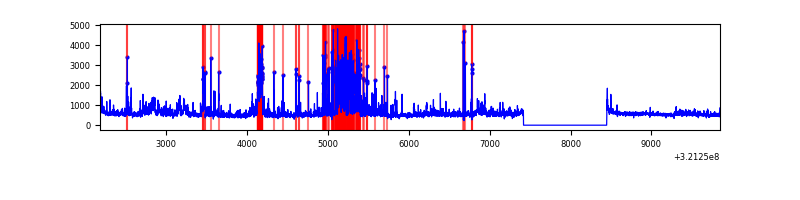 |
Top three noisy pixels from each quadrant. If the there are fewer than three noisy pixels in the level2.evt file, extra rows are filled as -1
| Pixel properties | Quadrant properties | ||||||
|---|---|---|---|---|---|---|---|
| Quadrant | DetID | PixID | Counts | Sigma | Mean | Median | Sigma |
| A | 6 | 16 | 35767 | 209.51 | 829 | 810 | 166.9 |
| A | 13 | 254 | 10072 | 55.51 | 829 | 810 | 166.9 |
| A | 0 | 226 | 6971 | 36.93 | 829 | 810 | 166.9 |
| B | 0 | 197 | 168305 | 1084.61 | 825 | 805 | 154.4 |
| B | 0 | 190 | 24158 | 151.22 | 825 | 805 | 154.4 |
| B | 12 | 111 | 18471 | 114.39 | 825 | 805 | 154.4 |
| C | 14 | 238 | 129903 | 694.55 | 806 | 811 | 185.9 |
| C | 0 | 239 | 81122 | 432.09 | 806 | 811 | 185.9 |
| C | 7 | 247 | 48479 | 256.47 | 806 | 811 | 185.9 |
| D | 1 | 52 | 1049941 | 5392.1 | 804 | 780 | 194.6 |
| D | 8 | 195 | 436064 | 2237.11 | 804 | 780 | 194.6 |
| D | 2 | 234 | 30308 | 151.76 | 804 | 780 | 194.6 |
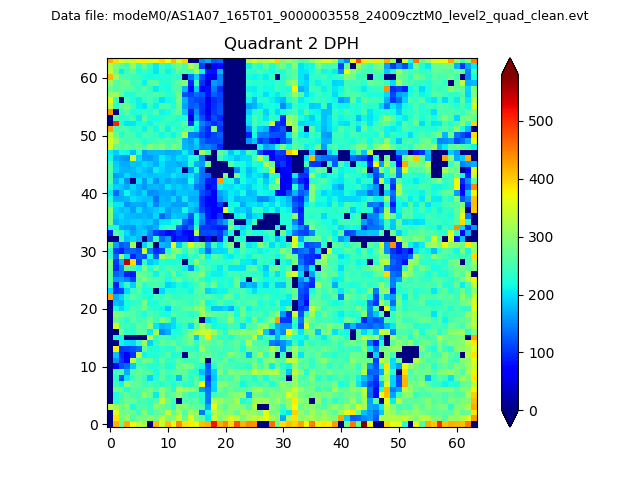
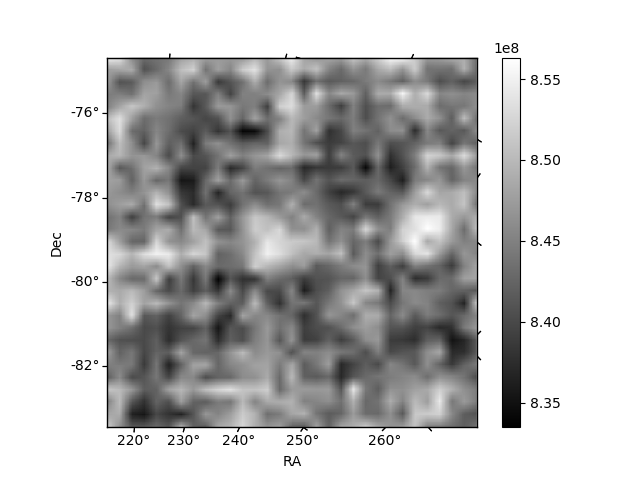
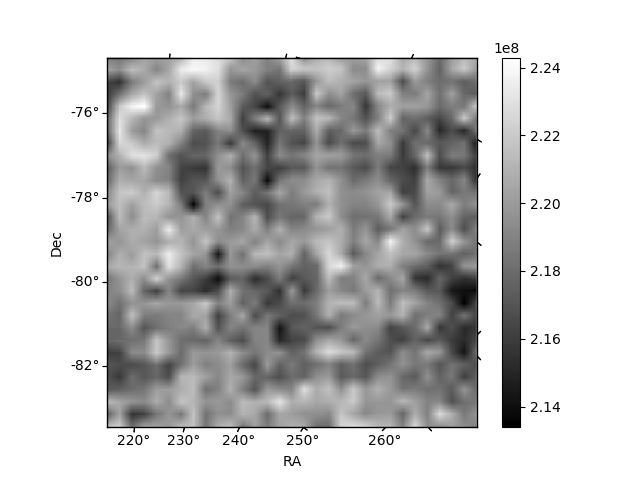
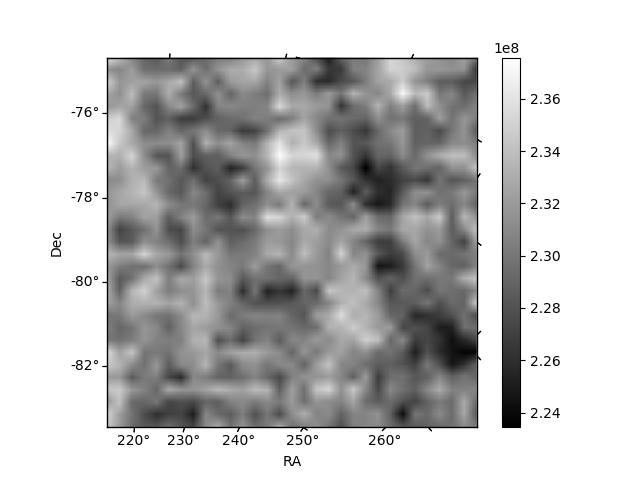
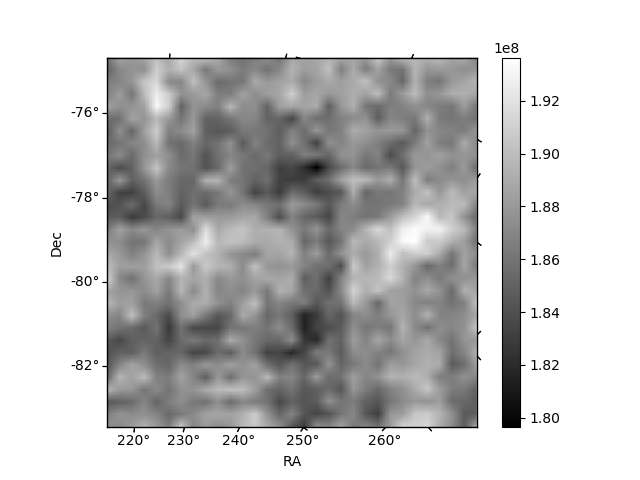
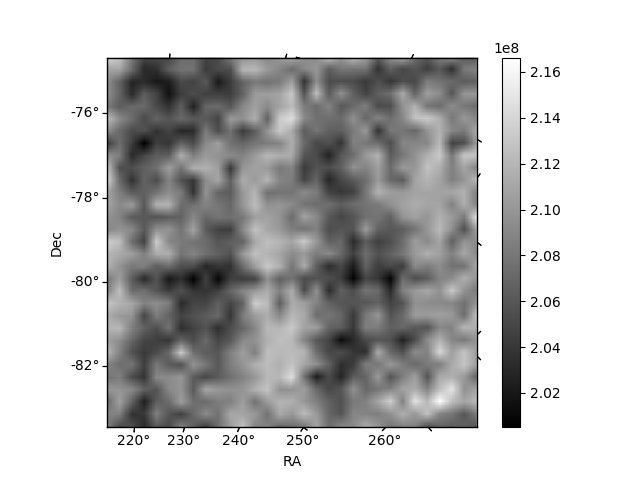
Histogram calculated using DETX and DETY for each event in the final _common_clean file
| Quadrant A | 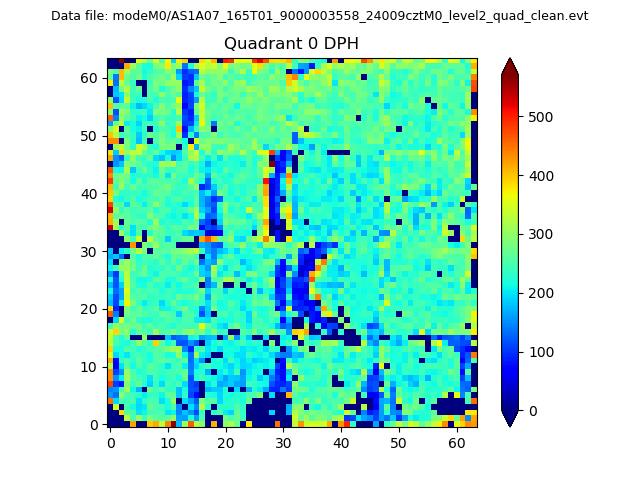 |
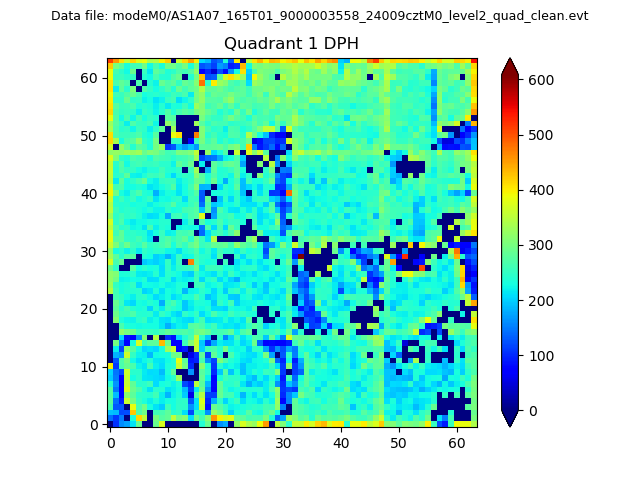 |
Quadrant B |
|---|---|---|---|
| Quadrant D | 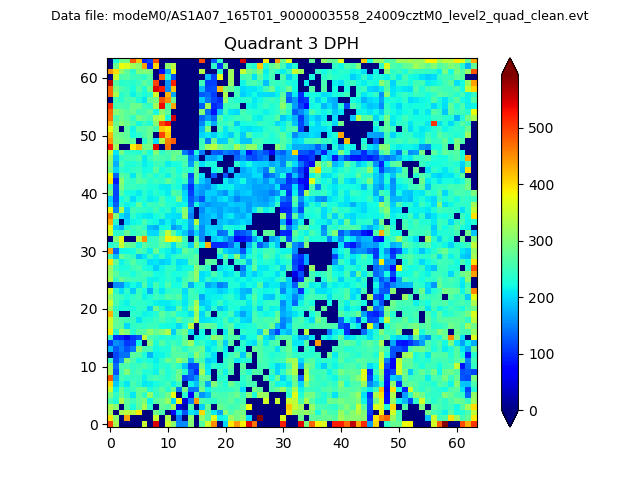 |
 |
Quadrant C |
| Plot type | Count rate plots | Images |
|---|---|---|
| Comparison with Poisson distribution Blue bars denote a histogram of data divided into 1 sec bins. Red curve is a Poisson curve with rate = median count rate of data. |
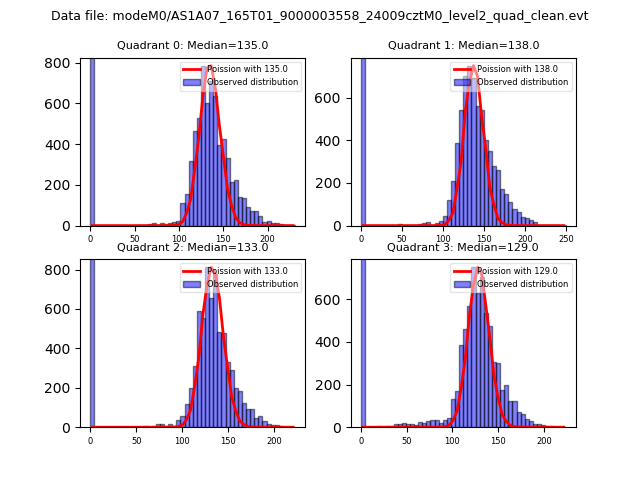 |
 |
| Quadrant-wise count rates Data is divided into 100 sec bins |
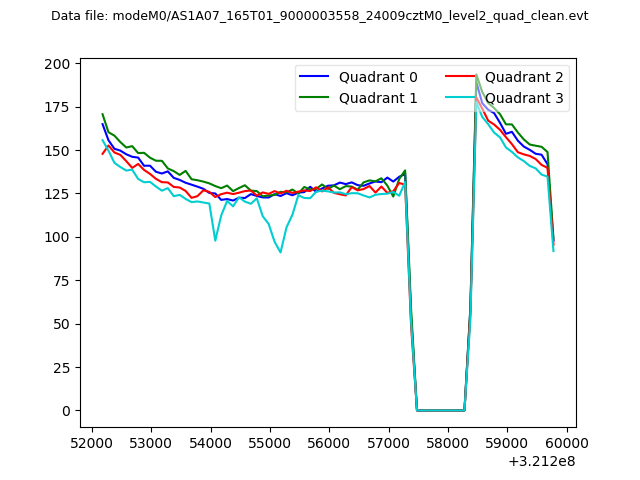 |
|
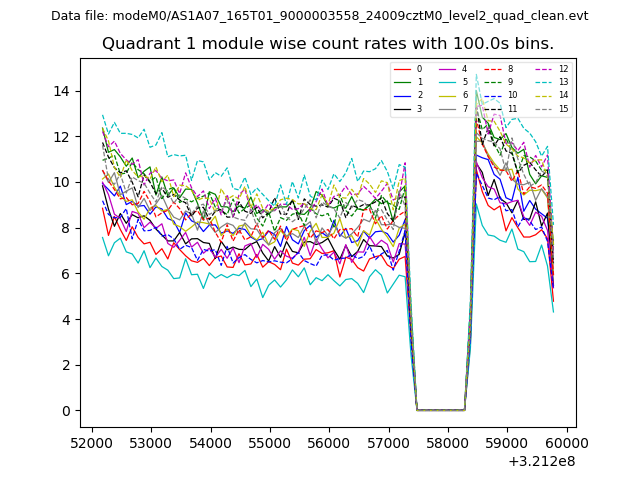
| Module-wise count rates for Quadrant A Data is divided into 100 sec bins |
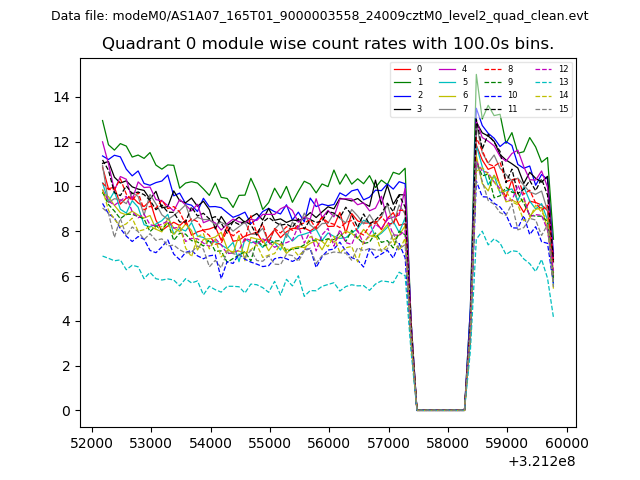 |
 |
| Module-wise count rates for Quadrant B Data is divided into 100 sec bins |
 |
 |
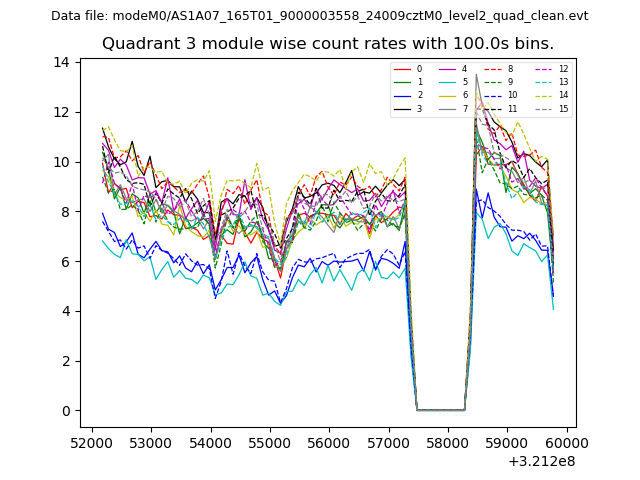
| Module-wise count rates for Quadrant C Data is divided into 100 sec bins |
 |
 |
| Module-wise count rates for Quadrant D Data is divided into 100 sec bins |
 |
 |
| Parameter | Plot |
|---|---|
| CZT HV Monitor |  |
| D_VDD | 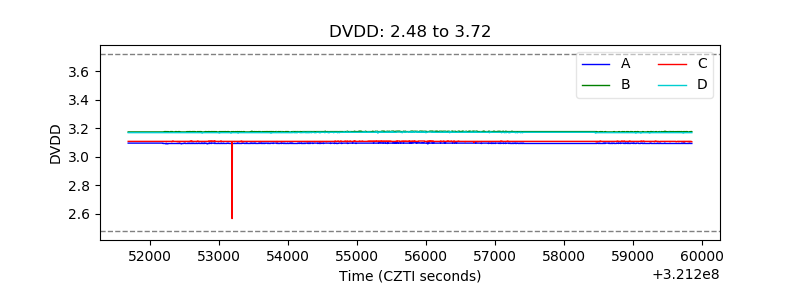 |
| Temperature 1 | 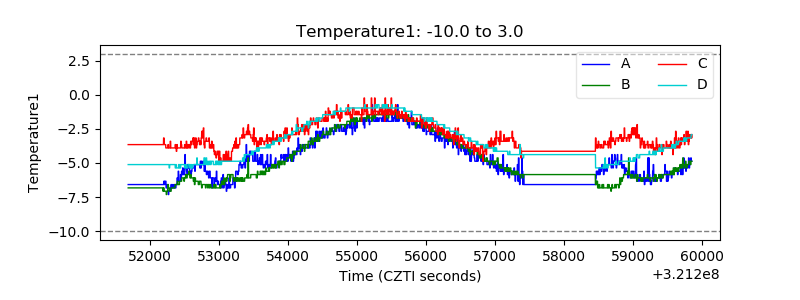 |
| Veto HV Monitor | 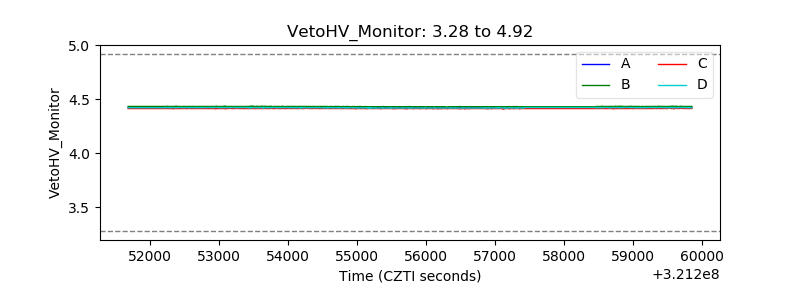 |
| Veto LLD | 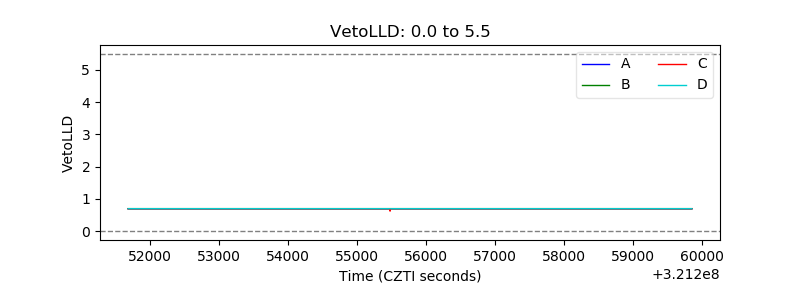 |
| Alpha Counter | 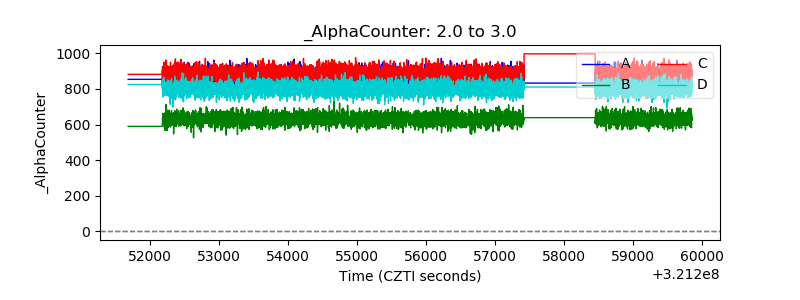 |
| _CPM_Rate | 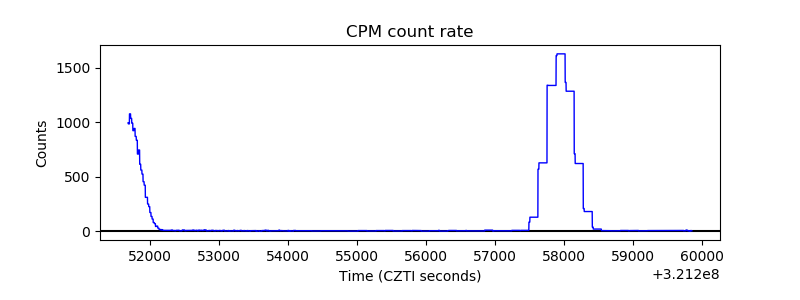 |
| CZT Counter | 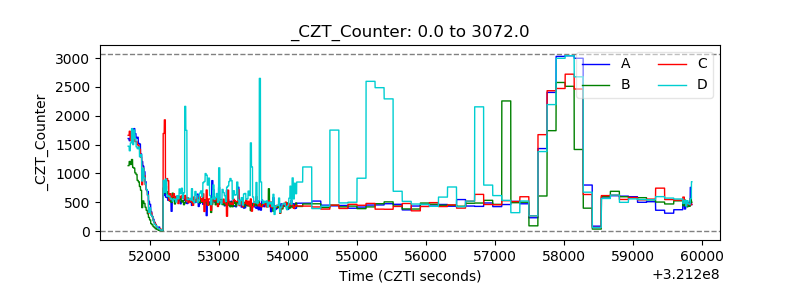 |
| +2.5 Volts monitor |  |
| +5 Volts monitor |  |
| _ROLL_ROT | 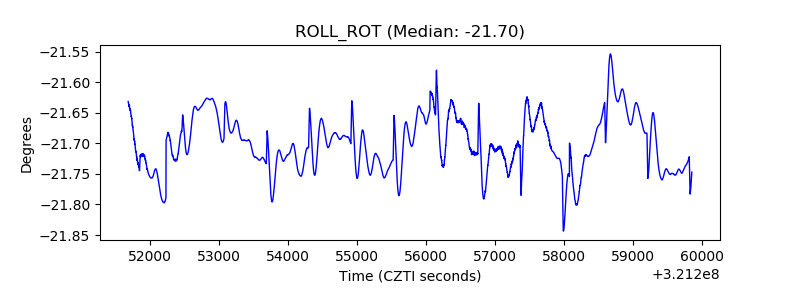 |
| _Roll_DEC | 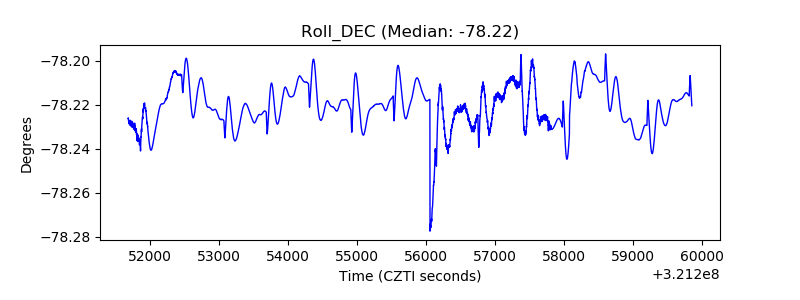 |
| _Roll_RA | 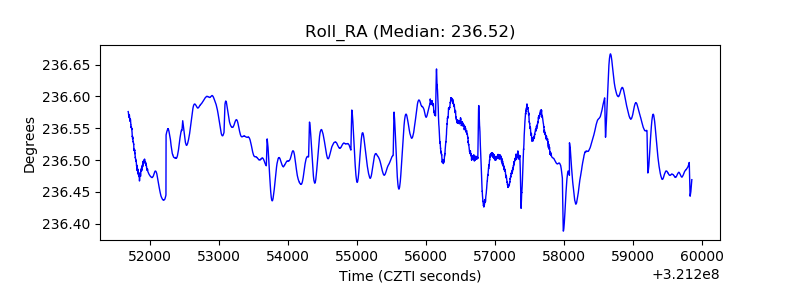 |
| Veto Counter | 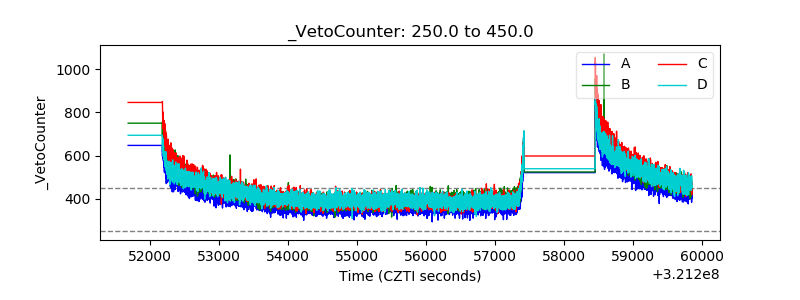 |