| Param | Original file | Final file |
|---|---|---|
| Filename | modeM0/AS1A07_165T01_9000003558_24011cztM0_level2.evt | modeM0/AS1A07_165T01_9000003558_24011cztM0_level2_quad_clean.evt |
| Size (bytes) | 487,238,400 | 134,542,080 |
| Size | 464.7 MB | 128.3 MB |
| Events in quadrant A | 3,437,896 | 922,721 |
| Events in quadrant B | 3,249,221 | 945,136 |
| Events in quadrant C | 3,271,790 | 903,540 |
| Events in quadrant D | 4,370,630 | 865,217 |
| Mode M9 | |||
|---|---|---|---|
| Quadrant | BADHDUFLAG | Total packets | Discarded packets |
| A | 0 | 12 | 0 |
| B | 0 | 12 | 0 |
| C | 0 | 12 | 0 |
| D | 0 | 12 | 0 |
| Mode M0 | |||
|---|---|---|---|
| Quadrant | BADHDUFLAG | Total packets | Discarded packets |
| A | 0 | 14209 | 1 |
| B | 0 | 13548 | 1 |
| C | 0 | 13691 | 1 |
| D | 0 | 17004 | 1 |
| Mode SS | |||
|---|---|---|---|
| Quadrant | BADHDUFLAG | Total packets | Discarded packets |
| A | 0 | 126 | 0 |
| B | 0 | 126 | 0 |
| C | 0 | 126 | 0 |
| D | 0 | 126 | 0 |
| Quadrant | Total seconds | Saturated seconds | Saturation percentage |
|---|---|---|---|
| A | 6290 | 47 | 0.747218% |
| B | 6291 | 33 | 0.524559% |
| C | 6291 | 81 | 1.287554% |
| D | 6291 | 313 | 4.975362% |
Noise dominated data is calculated using 1-second bins in cleaned event files. If a bin has >2000 counts, and if more than 50% of those come from <1% of pixels, then it is considered to be noise-dominated and hence unusable.
| Quadrant | # 1 sec bins | Bins with >0 counts | Bins with >2000 counts | High rate bins dominated by noise | Noise dominated (total time) | Noise dominated (detector-on time) | Marked lightcurve |
|---|---|---|---|---|---|---|---|
| A | 7435 | 6291 | 9 | 9 | 0.12% | 0.14% | 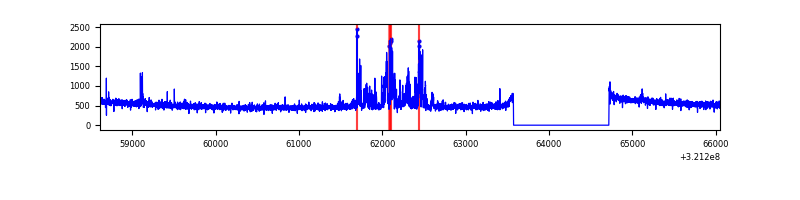 |
| B | 7436 | 6292 | 0 | 0 | 0.00% | 0.00% | 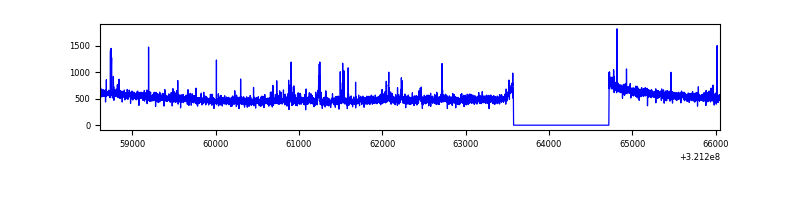 |
| C | 7436 | 6292 | 0 | 0 | 0.00% | 0.00% | 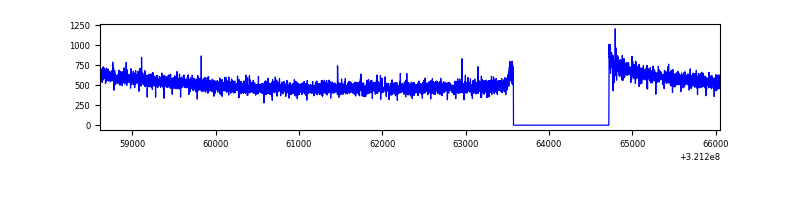 |
| D | 7436 | 6292 | 200 | 200 | 2.69% | 3.18% | 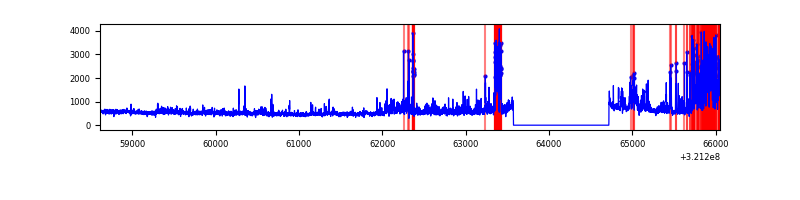 |
Top three noisy pixels from each quadrant. If the there are fewer than three noisy pixels in the level2.evt file, extra rows are filled as -1
| Pixel properties | Quadrant properties | ||||||
|---|---|---|---|---|---|---|---|
| Quadrant | DetID | PixID | Counts | Sigma | Mean | Median | Sigma |
| A | 6 | 16 | 286535 | 1762.46 | 818 | 805 | 162.1 |
| A | 13 | 254 | 10031 | 56.91 | 818 | 805 | 162.1 |
| A | 0 | 226 | 7078 | 38.69 | 818 | 805 | 162.1 |
| B | 0 | 190 | 36667 | 238.06 | 810 | 792 | 150.7 |
| B | 0 | 197 | 21173 | 135.24 | 810 | 792 | 150.7 |
| B | 12 | 111 | 17276 | 109.38 | 810 | 792 | 150.7 |
| C | 14 | 238 | 127825 | 701.77 | 789 | 795 | 181.0 |
| C | 7 | 247 | 61277 | 334.13 | 789 | 795 | 181.0 |
| C | 13 | 61 | 5385 | 25.36 | 789 | 795 | 181.0 |
| D | 12 | 218 | 657243 | 3444.69 | 790 | 766 | 190.6 |
| D | 8 | 195 | 384821 | 2015.23 | 790 | 766 | 190.6 |
| D | 7 | 223 | 153110 | 799.39 | 790 | 766 | 190.6 |
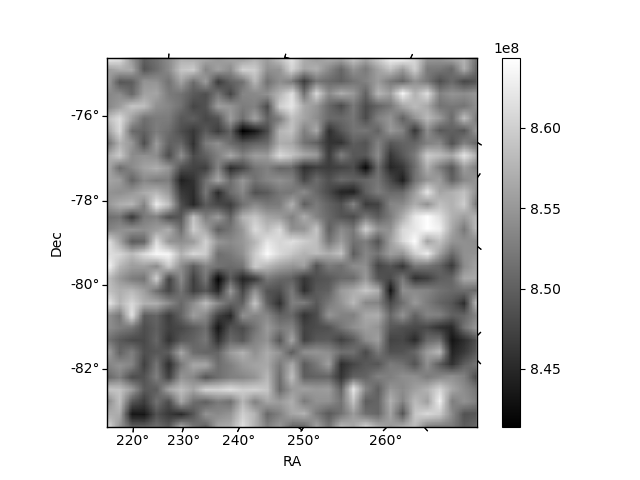
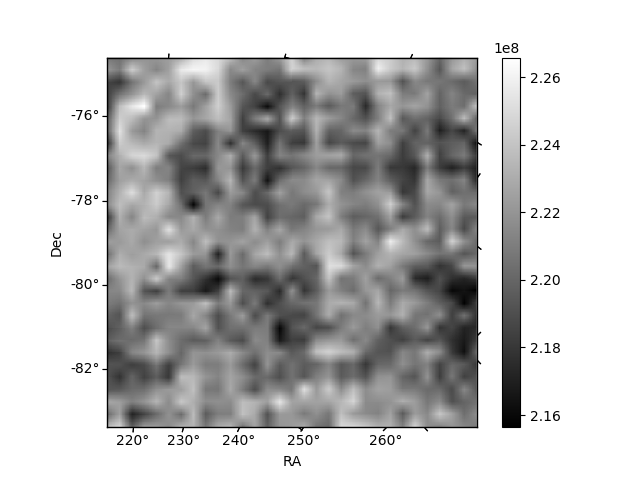
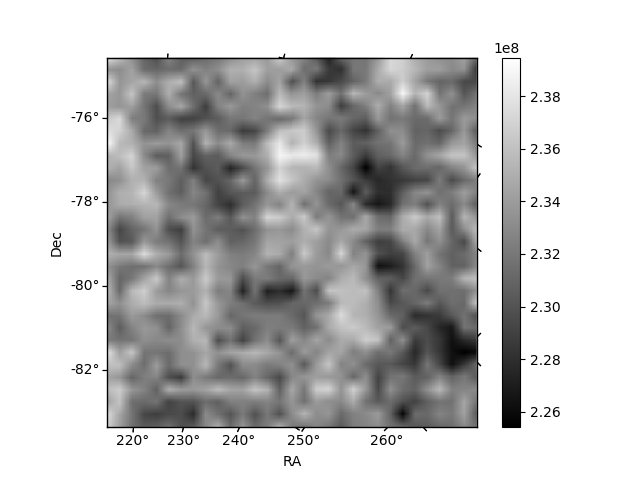
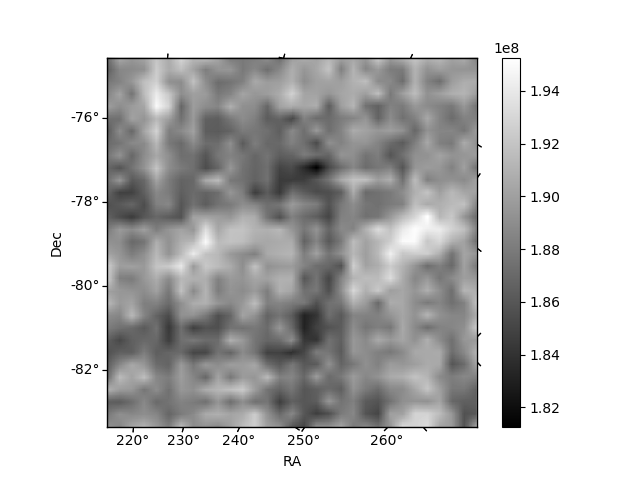
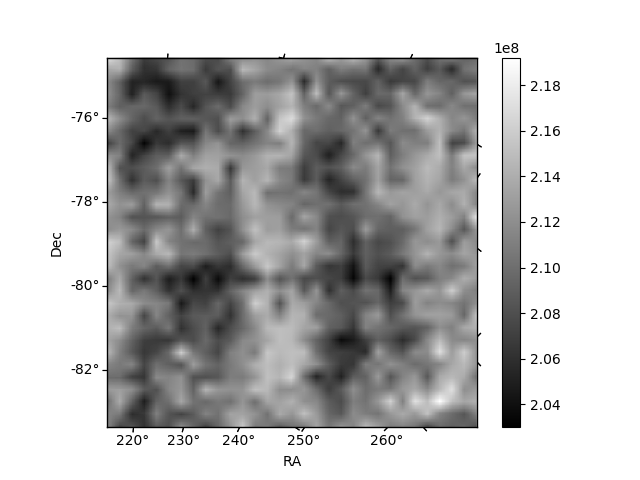
Histogram calculated using DETX and DETY for each event in the final _common_clean file
| Quadrant A | 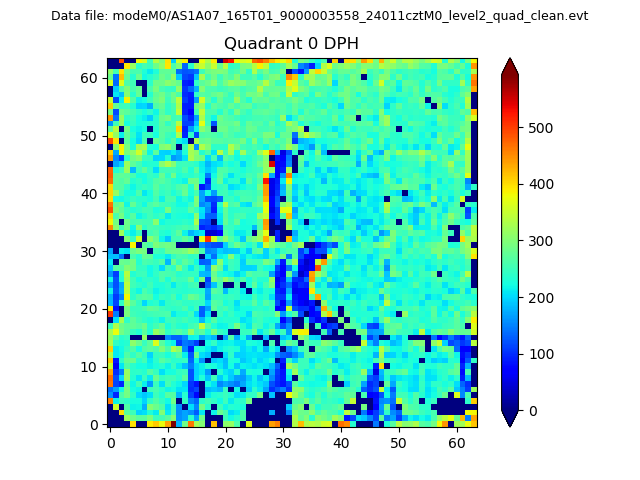 |
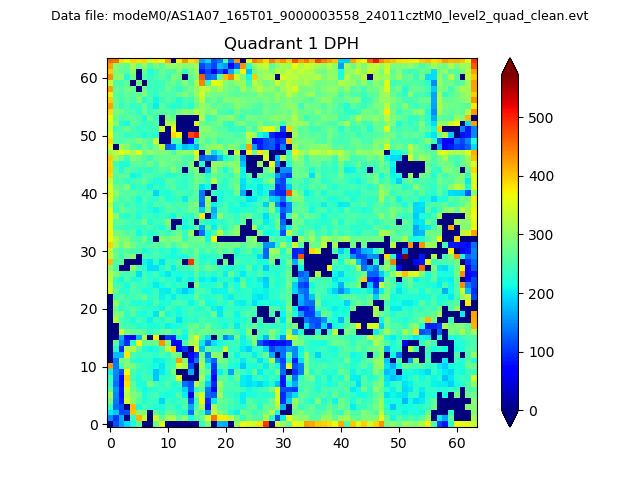 |
Quadrant B |
|---|---|---|---|
| Quadrant D |  |
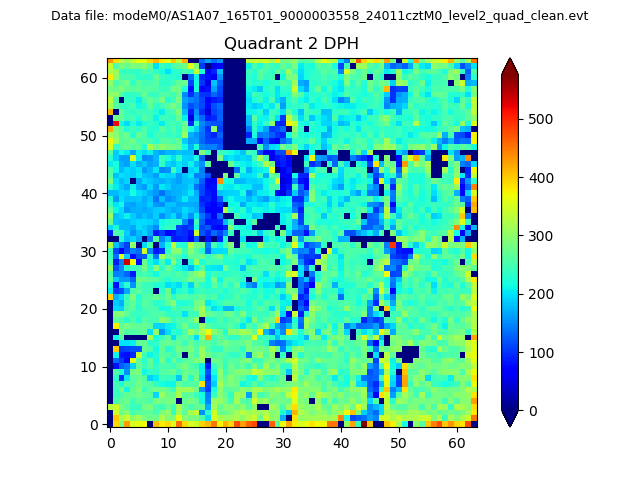 |
Quadrant C |
| Plot type | Count rate plots | Images |
|---|---|---|
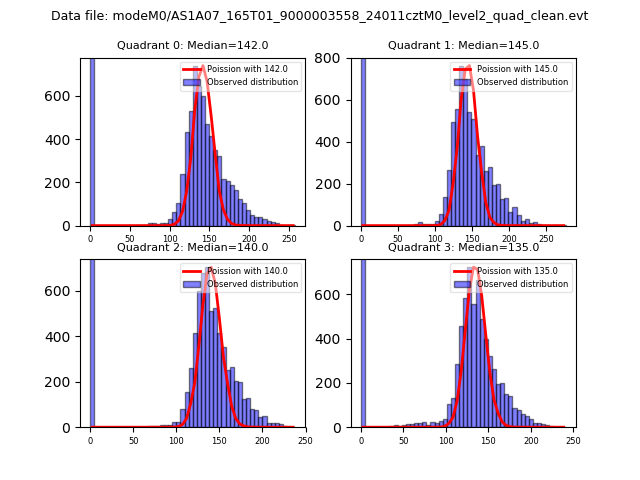
| Comparison with Poisson distribution Blue bars denote a histogram of data divided into 1 sec bins. Red curve is a Poisson curve with rate = median count rate of data. |
 |
 |
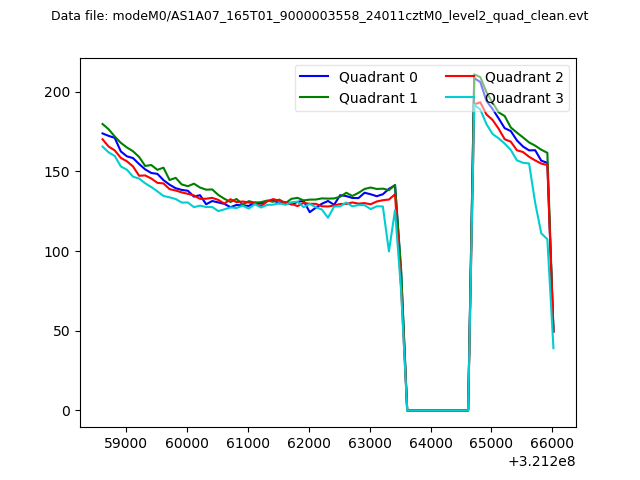
| Quadrant-wise count rates Data is divided into 100 sec bins |
 |
|
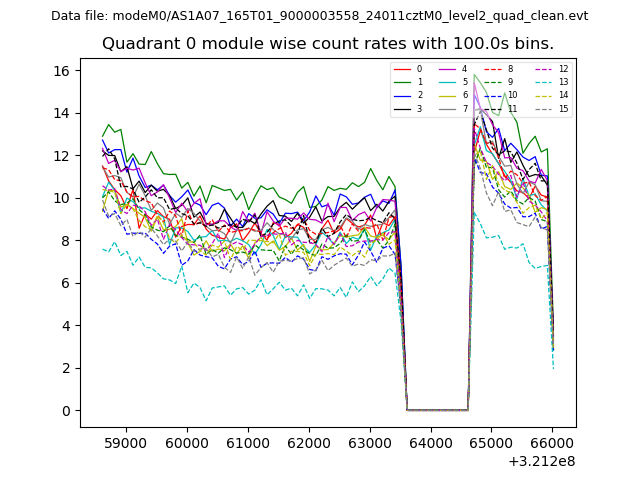
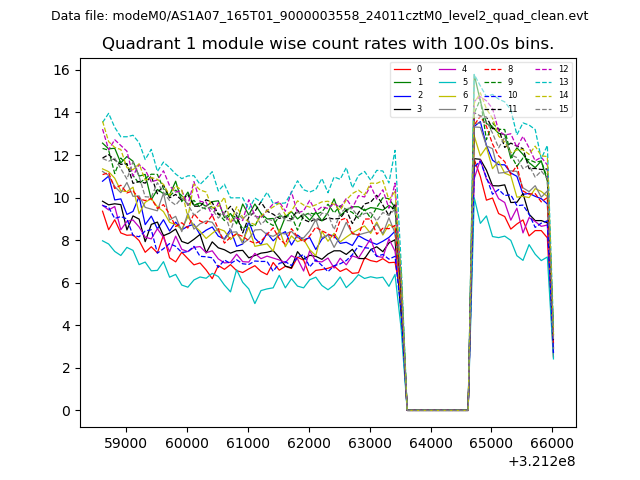
| Module-wise count rates for Quadrant A Data is divided into 100 sec bins |
 |
 |
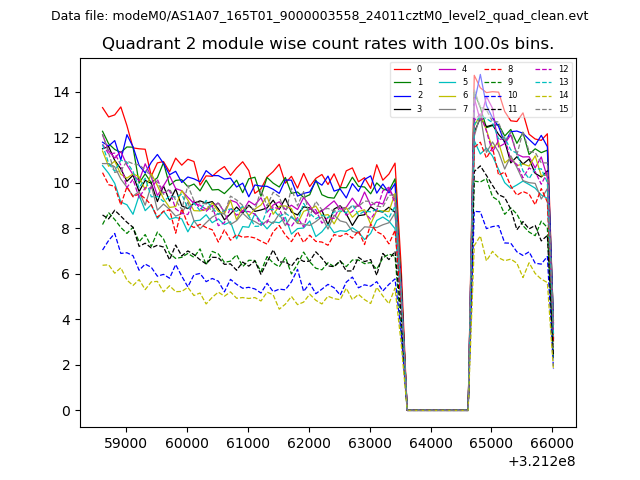
| Module-wise count rates for Quadrant B Data is divided into 100 sec bins |
 |
 |
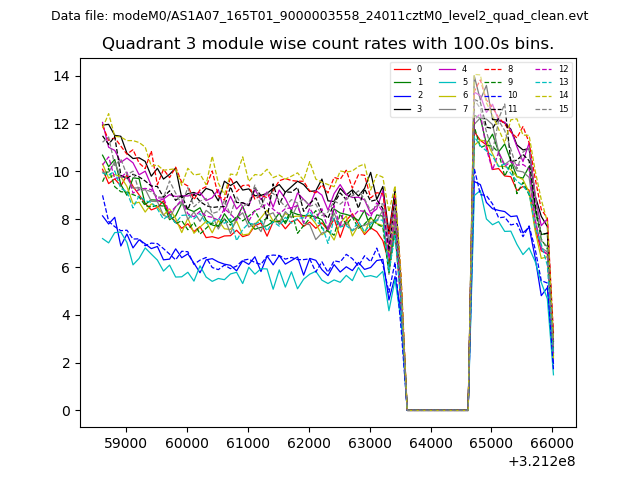
| Module-wise count rates for Quadrant C Data is divided into 100 sec bins |
 |
 |
| Module-wise count rates for Quadrant D Data is divided into 100 sec bins |
 |
 |
| Parameter | Plot |
|---|---|
| CZT HV Monitor | 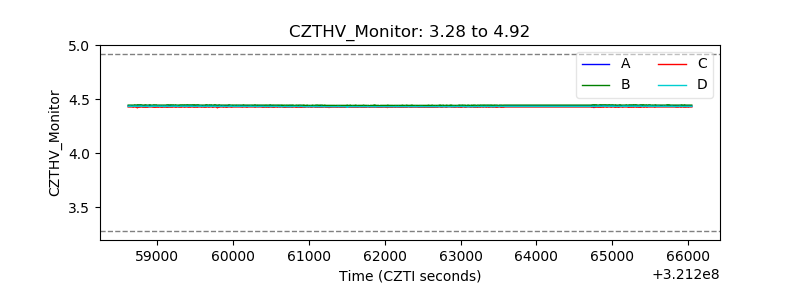 |
| D_VDD | 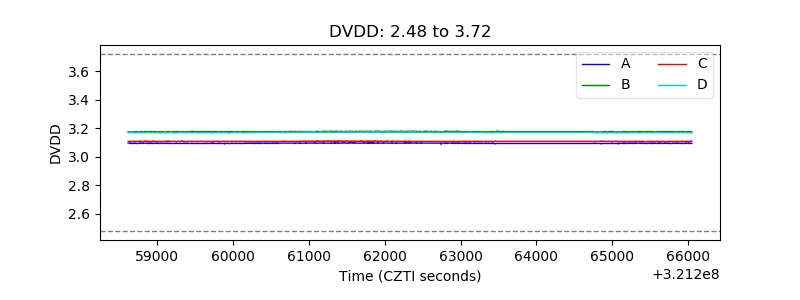 |
| Temperature 1 | 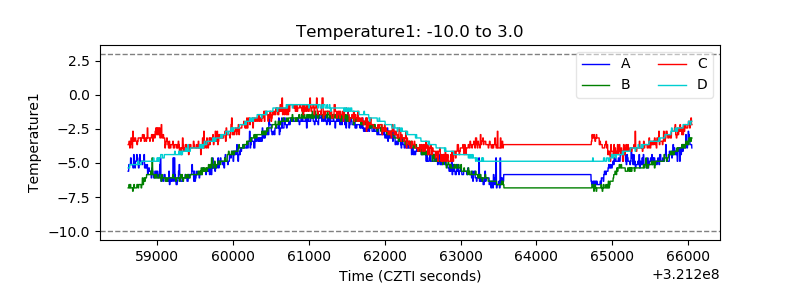 |
| Veto HV Monitor |  |
| Veto LLD | 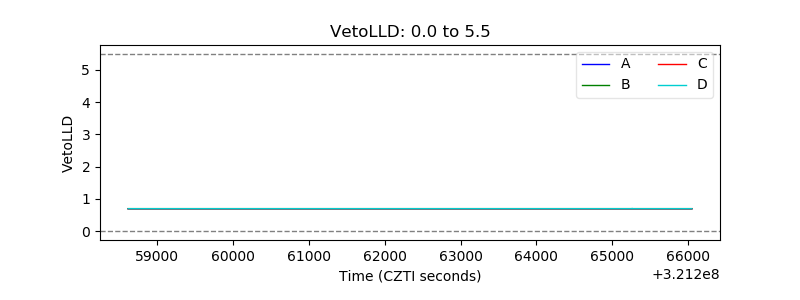 |
| Alpha Counter | 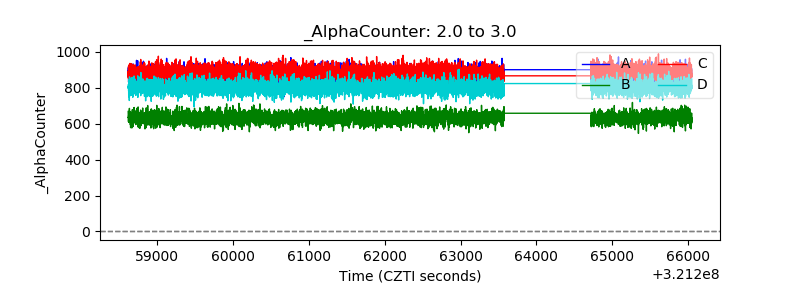 |
| _CPM_Rate |  |
| CZT Counter | 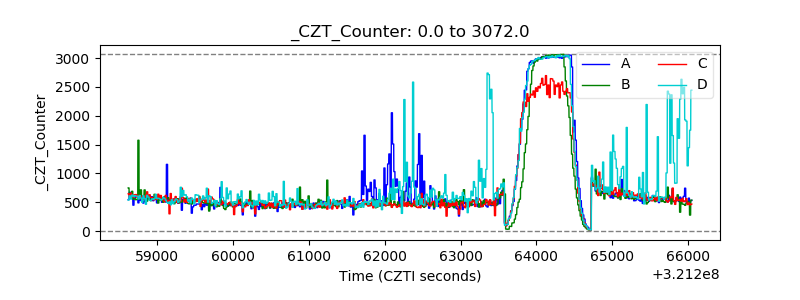 |
| +2.5 Volts monitor | 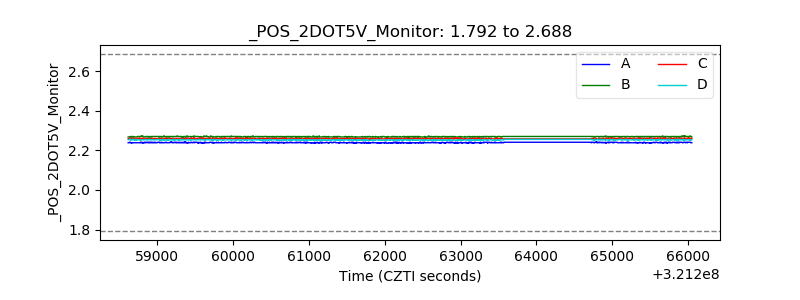 |
| +5 Volts monitor | 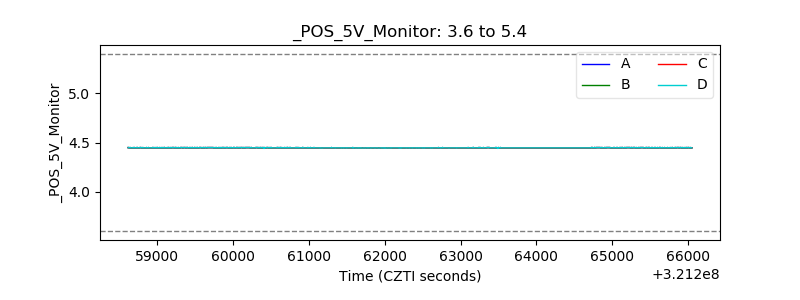 |
| _ROLL_ROT | 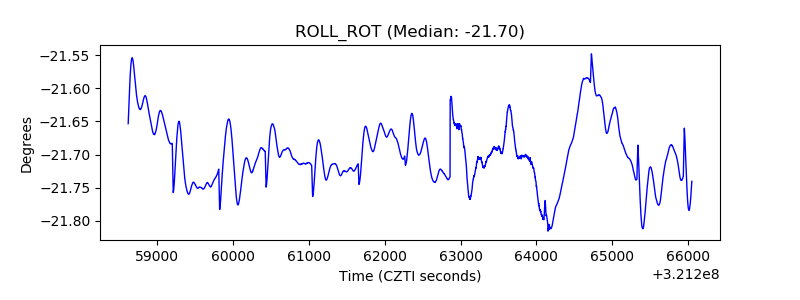 |
| _Roll_DEC | 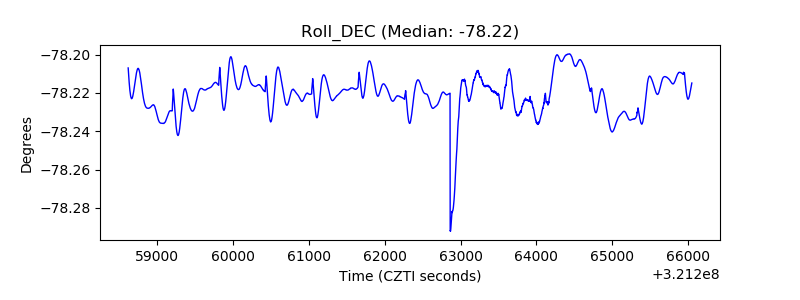 |
| _Roll_RA | 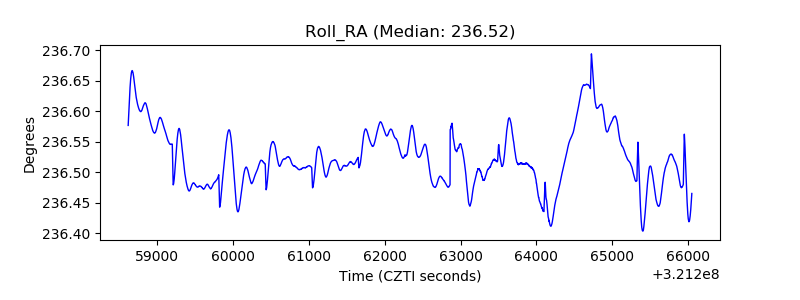 |
| Veto Counter | 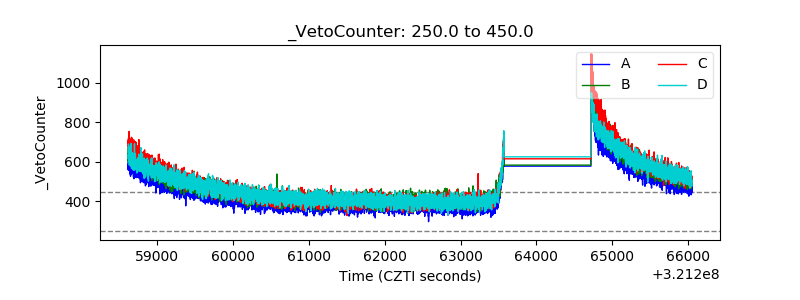 |