| Param | Original file | Final file |
|---|---|---|
| Filename | modeM0/AS1A07_165T01_9000003558_24012cztM0_level2.evt | modeM0/AS1A07_165T01_9000003558_24012cztM0_level2_quad_clean.evt |
| Size (bytes) | 558,547,200 | 141,511,680 |
| Size | 532.7 MB | 135.0 MB |
| Events in quadrant A | 3,340,140 | 993,285 |
| Events in quadrant B | 3,439,011 | 1,008,129 |
| Events in quadrant C | 3,398,436 | 964,404 |
| Events in quadrant D | 6,312,339 | 881,739 |
| Mode M9 | |||
|---|---|---|---|
| Quadrant | BADHDUFLAG | Total packets | Discarded packets |
| A | 0 | 14 | 0 |
| B | 0 | 15 | 0 |
| C | 0 | 15 | 0 |
| D | 0 | 15 | 0 |
| Mode M0 | |||
|---|---|---|---|
| Quadrant | BADHDUFLAG | Total packets | Discarded packets |
| A | 0 | 13923 | 2 |
| B | 0 | 14169 | 2 |
| C | 0 | 14168 | 2 |
| D | 0 | 23150 | 2 |
| Mode SS | |||
|---|---|---|---|
| Quadrant | BADHDUFLAG | Total packets | Discarded packets |
| A | 0 | 128 | 0 |
| B | 0 | 128 | 0 |
| C | 0 | 128 | 0 |
| D | 0 | 128 | 0 |
| Quadrant | Total seconds | Saturated seconds | Saturation percentage |
|---|---|---|---|
| A | 6281 | 48 | 0.764210% |
| B | 6281 | 61 | 0.971183% |
| C | 6281 | 103 | 1.639866% |
| D | 6281 | 998 | 15.889190% |
Noise dominated data is calculated using 1-second bins in cleaned event files. If a bin has >2000 counts, and if more than 50% of those come from <1% of pixels, then it is considered to be noise-dominated and hence unusable.
| Quadrant | # 1 sec bins | Bins with >0 counts | Bins with >2000 counts | High rate bins dominated by noise | Noise dominated (total time) | Noise dominated (detector-on time) | Marked lightcurve |
|---|---|---|---|---|---|---|---|
| A | 7531 | 6282 | 1 | 1 | 0.01% | 0.02% | 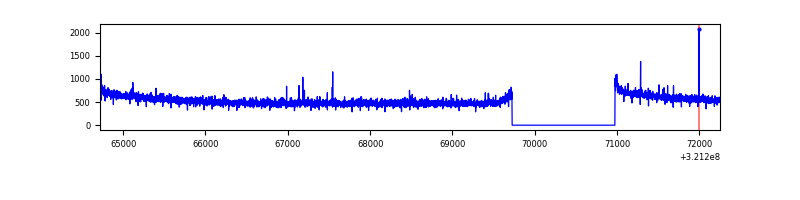 |
| B | 7531 | 6282 | 9 | 9 | 0.12% | 0.14% |  |
| C | 7531 | 6282 | 0 | 0 | 0.00% | 0.00% | 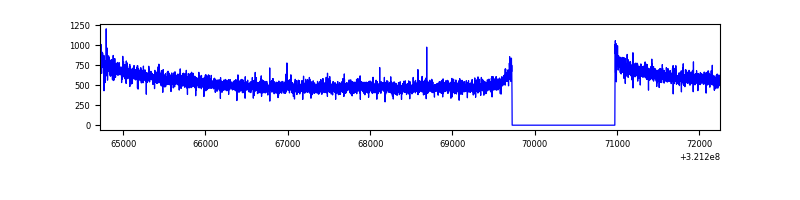 |
| D | 7531 | 6282 | 759 | 759 | 10.08% | 12.08% | 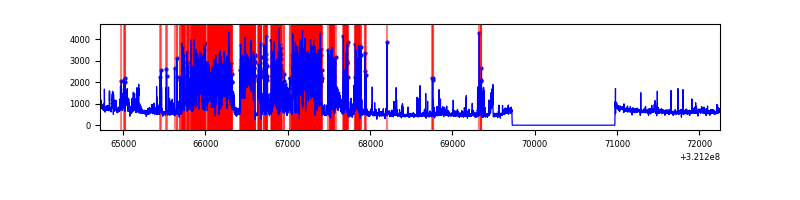 |
Top three noisy pixels from each quadrant. If the there are fewer than three noisy pixels in the level2.evt file, extra rows are filled as -1
| Pixel properties | Quadrant properties | ||||||
|---|---|---|---|---|---|---|---|
| Quadrant | DetID | PixID | Counts | Sigma | Mean | Median | Sigma |
| A | 6 | 16 | 22416 | 126.39 | 860 | 846 | 170.7 |
| A | 13 | 254 | 9744 | 52.14 | 860 | 846 | 170.7 |
| A | 0 | 226 | 7449 | 38.69 | 860 | 846 | 170.7 |
| B | 5 | 172 | 57148 | 364.42 | 846 | 829 | 154.5 |
| B | 7 | 202 | 21303 | 132.48 | 846 | 829 | 154.5 |
| B | 0 | 190 | 19096 | 118.2 | 846 | 829 | 154.5 |
| C | 14 | 238 | 133801 | 710.67 | 821 | 829 | 187.1 |
| C | 7 | 247 | 50485 | 265.39 | 821 | 829 | 187.1 |
| C | 0 | 239 | 7602 | 36.2 | 821 | 829 | 187.1 |
| D | 12 | 218 | 2703252 | 14134.86 | 798 | 777 | 191.2 |
| D | 8 | 195 | 202161 | 1053.31 | 798 | 777 | 191.2 |
| D | 12 | 250 | 161169 | 838.9 | 798 | 777 | 191.2 |
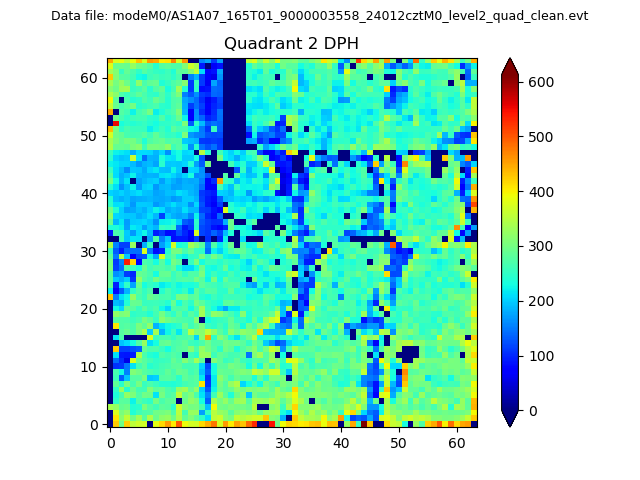
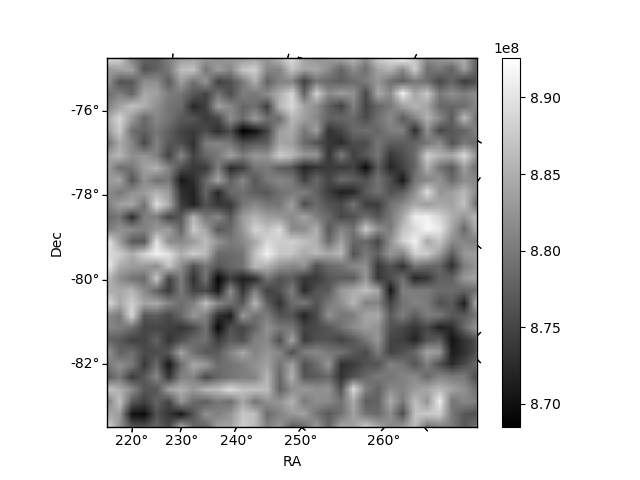
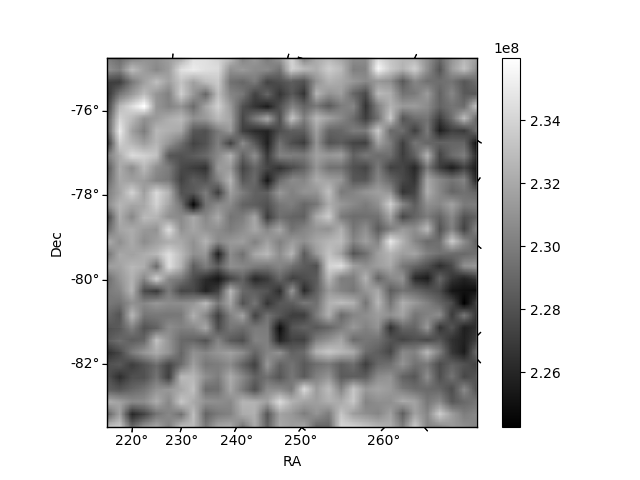
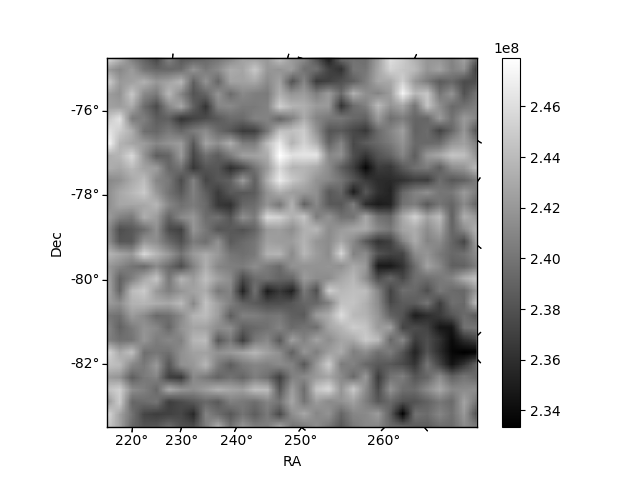
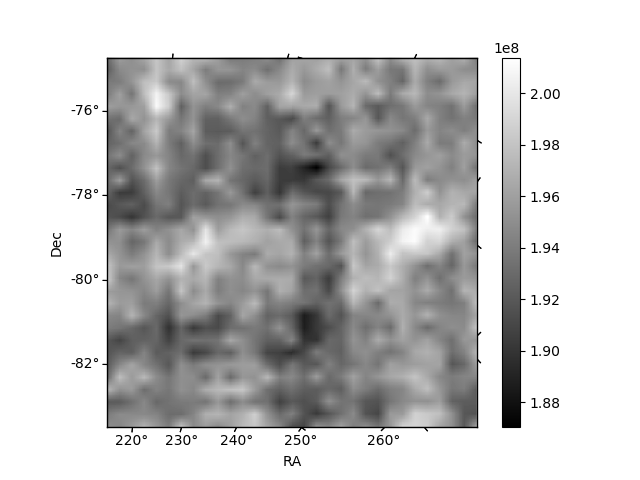
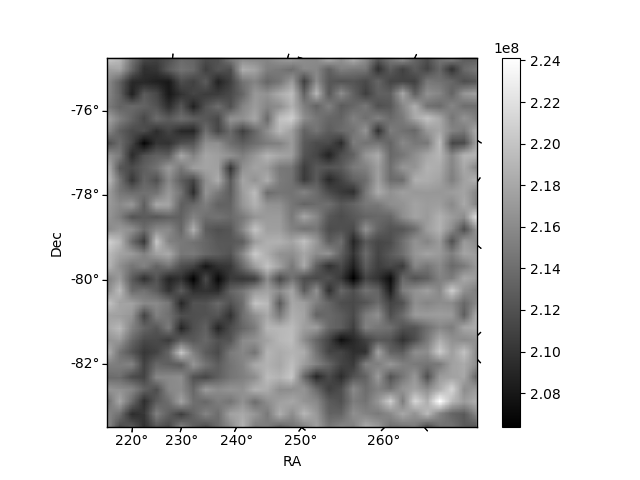
Histogram calculated using DETX and DETY for each event in the final _common_clean file
| Quadrant A | 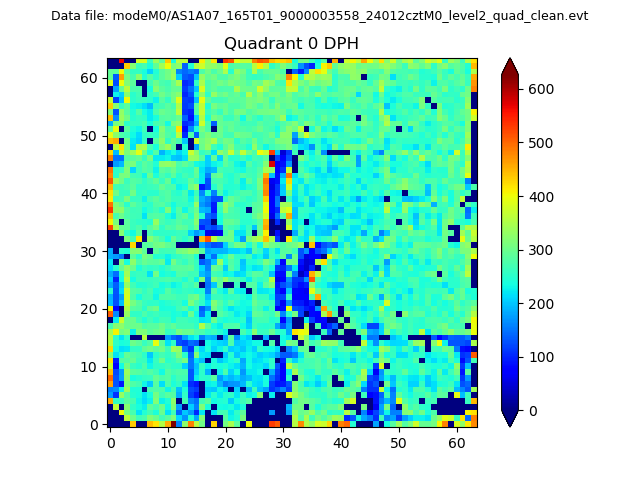 |
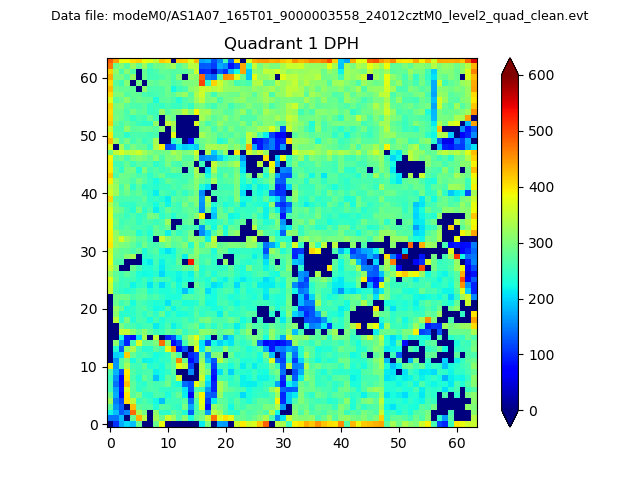 |
Quadrant B |
|---|---|---|---|
| Quadrant D | 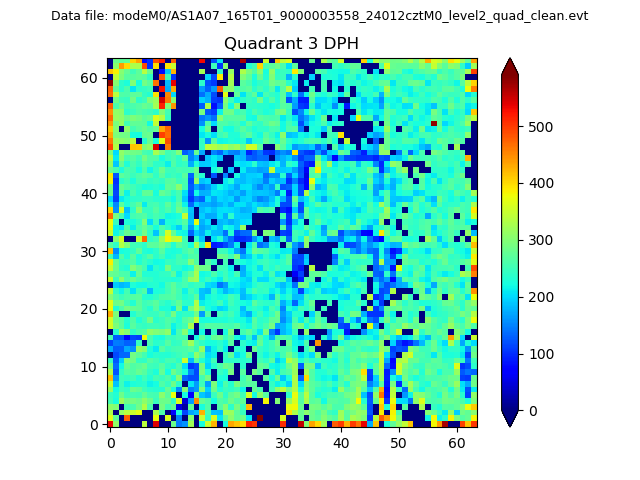 |
 |
Quadrant C |
| Plot type | Count rate plots | Images |
|---|---|---|
| Comparison with Poisson distribution Blue bars denote a histogram of data divided into 1 sec bins. Red curve is a Poisson curve with rate = median count rate of data. |
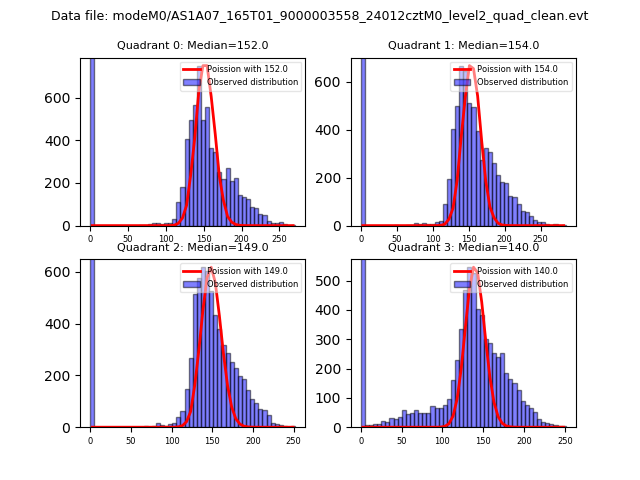 |
 |
| Quadrant-wise count rates Data is divided into 100 sec bins |
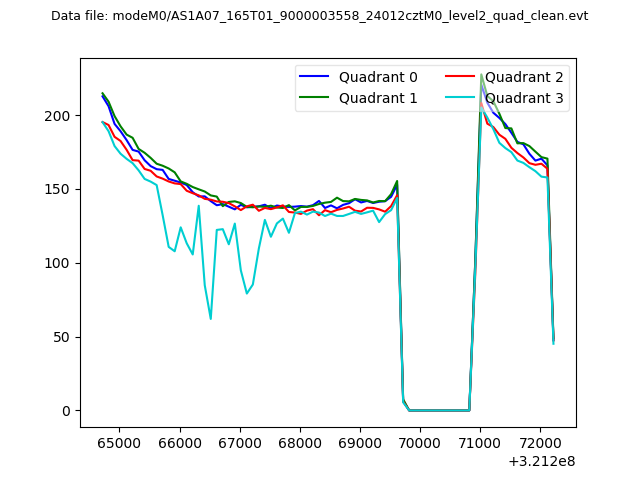 |
|
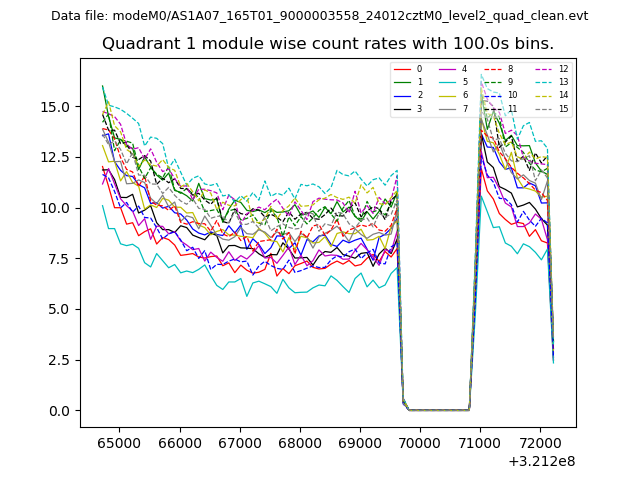
| Module-wise count rates for Quadrant A Data is divided into 100 sec bins |
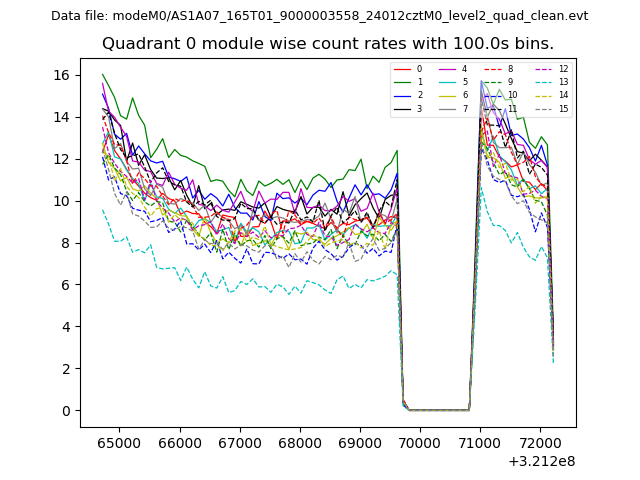 |
 |
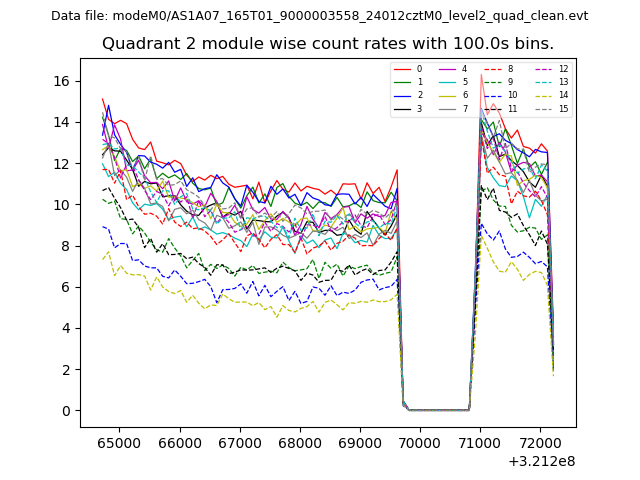
| Module-wise count rates for Quadrant B Data is divided into 100 sec bins |
 |
 |
| Module-wise count rates for Quadrant C Data is divided into 100 sec bins |
 |
 |
| Module-wise count rates for Quadrant D Data is divided into 100 sec bins |
 |
 |
| Parameter | Plot |
|---|---|
| CZT HV Monitor | 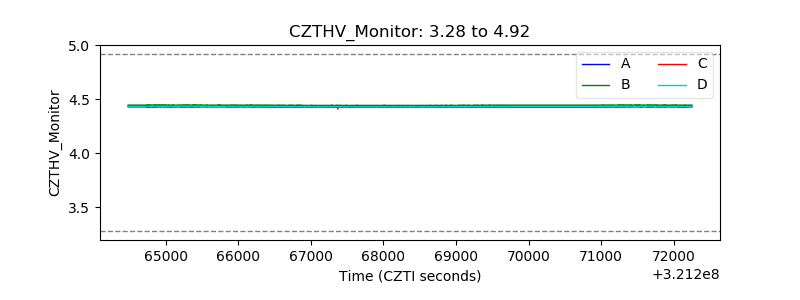 |
| D_VDD | 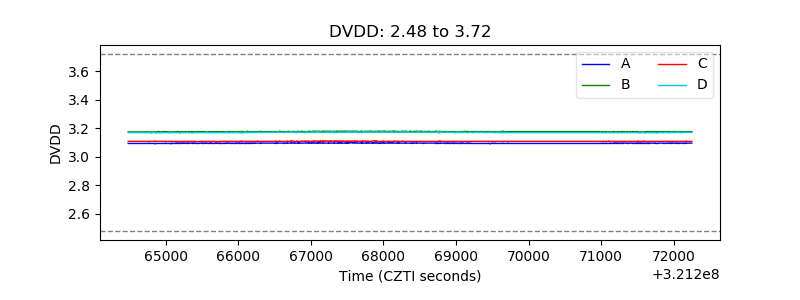 |
| Temperature 1 | 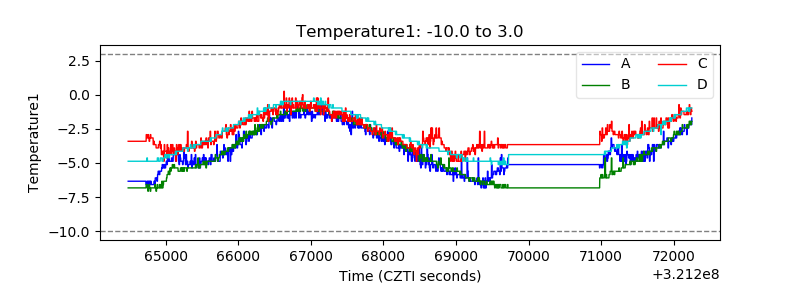 |
| Veto HV Monitor | 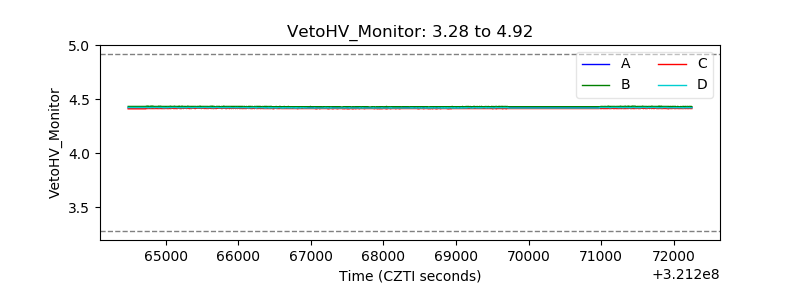 |
| Veto LLD | 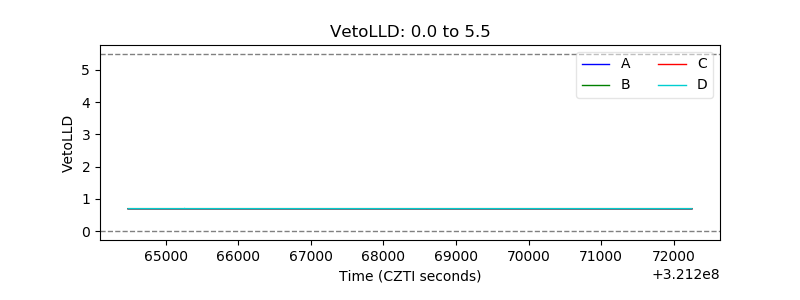 |
| Alpha Counter | 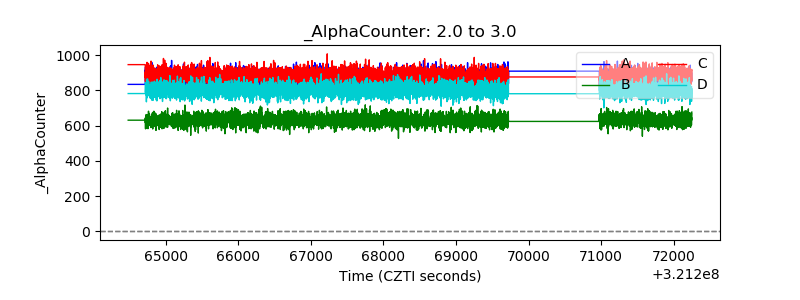 |
| _CPM_Rate | 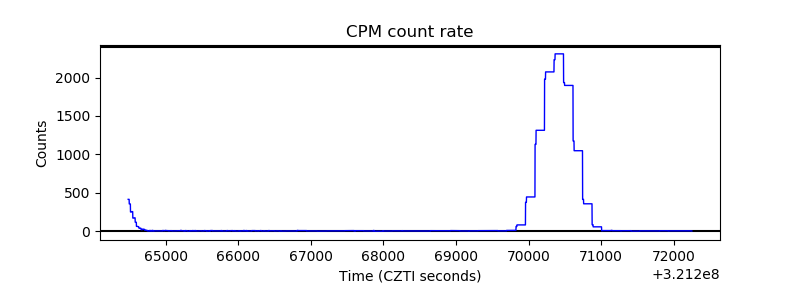 |
| CZT Counter | 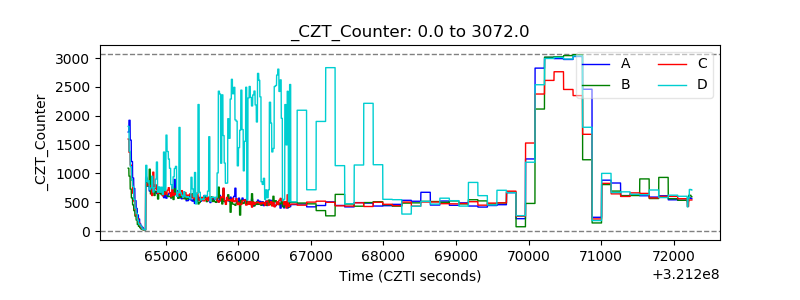 |
| +2.5 Volts monitor | 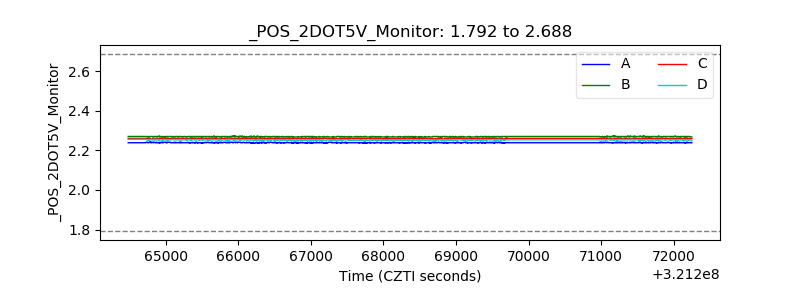 |
| +5 Volts monitor | 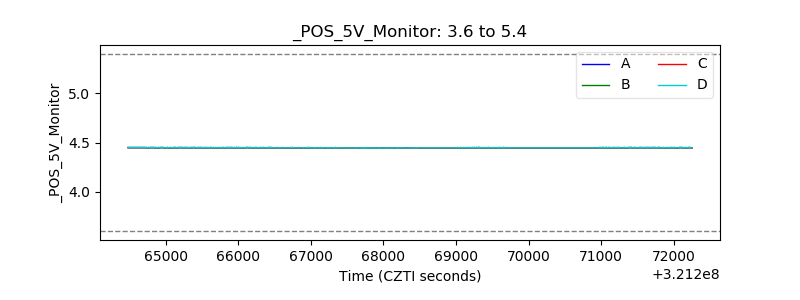 |
| _ROLL_ROT | 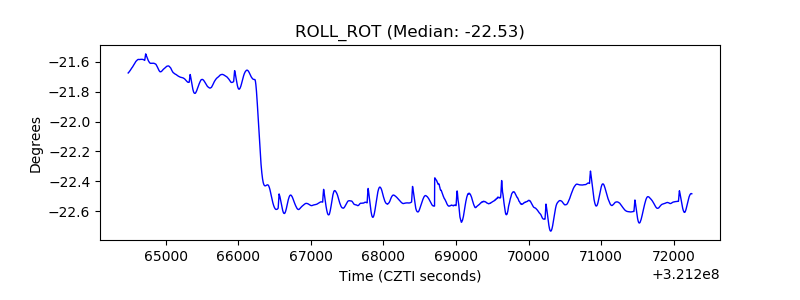 |
| _Roll_DEC | 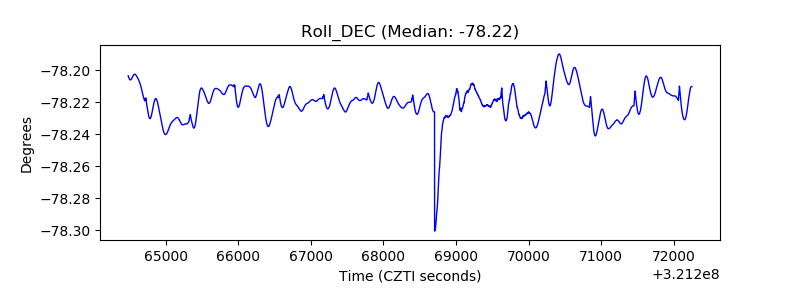 |
| _Roll_RA | 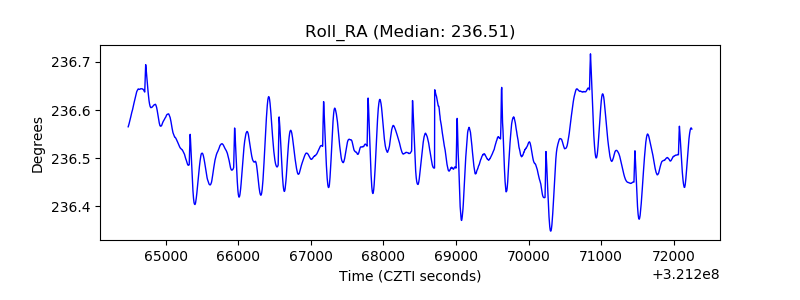 |
| Veto Counter | 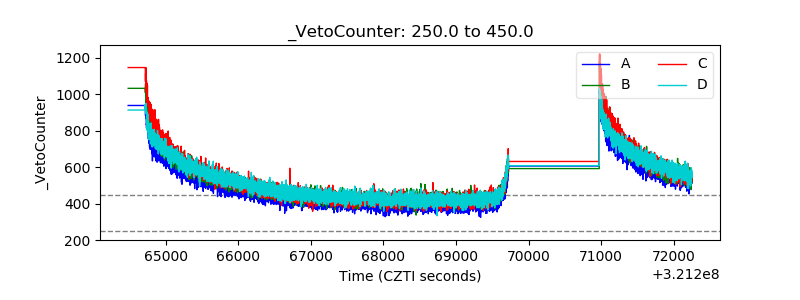 |