| Param | Original file | Final file |
|---|---|---|
| Filename | modeM0/AS1A07_165T01_9000003558_24016cztM0_level2.evt | modeM0/AS1A07_165T01_9000003558_24016cztM0_level2_quad_clean.evt |
| Size (bytes) | 455,647,680 | 133,263,360 |
| Size | 434.5 MB | 127.1 MB |
| Events in quadrant A | 3,210,975 | 910,624 |
| Events in quadrant B | 3,243,270 | 921,172 |
| Events in quadrant C | 3,160,205 | 879,323 |
| Events in quadrant D | 3,735,521 | 864,197 |
| Mode M9 | |||
|---|---|---|---|
| Quadrant | BADHDUFLAG | Total packets | Discarded packets |
| A | 0 | 9 | 0 |
| B | 0 | 9 | 0 |
| C | 0 | 9 | 0 |
| D | 0 | 9 | 0 |
| Mode M0 | |||
|---|---|---|---|
| Quadrant | BADHDUFLAG | Total packets | Discarded packets |
| A | 0 | 13704 | 1 |
| B | 0 | 13706 | 1 |
| C | 0 | 13553 | 1 |
| D | 0 | 15393 | 1 |
| Mode SS | |||
|---|---|---|---|
| Quadrant | BADHDUFLAG | Total packets | Discarded packets |
| A | 0 | 134 | 0 |
| B | 0 | 134 | 0 |
| C | 0 | 134 | 0 |
| D | 0 | 134 | 0 |
| Quadrant | Total seconds | Saturated seconds | Saturation percentage |
|---|---|---|---|
| A | 6613 | 51 | 0.771208% |
| B | 6614 | 59 | 0.892047% |
| C | 6614 | 72 | 1.088600% |
| D | 6614 | 85 | 1.285153% |
Noise dominated data is calculated using 1-second bins in cleaned event files. If a bin has >2000 counts, and if more than 50% of those come from <1% of pixels, then it is considered to be noise-dominated and hence unusable.
| Quadrant | # 1 sec bins | Bins with >0 counts | Bins with >2000 counts | High rate bins dominated by noise | Noise dominated (total time) | Noise dominated (detector-on time) | Marked lightcurve |
|---|---|---|---|---|---|---|---|
| A | 7538 | 6614 | 5 | 5 | 0.07% | 0.08% | 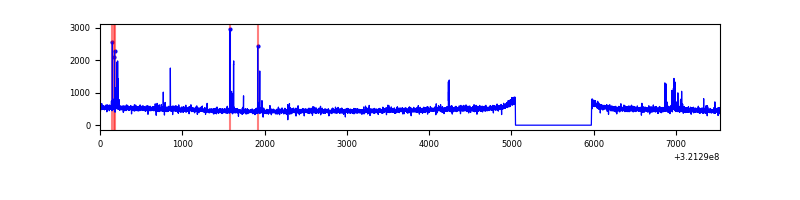 |
| B | 7539 | 6615 | 4 | 4 | 0.05% | 0.06% | 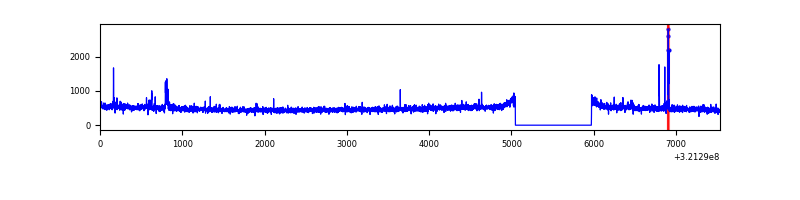 |
| C | 7539 | 6615 | 0 | 0 | 0.00% | 0.00% | 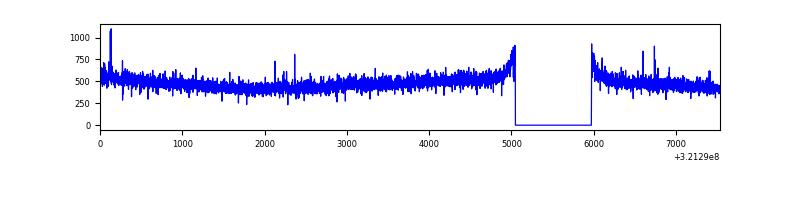 |
| D | 7539 | 6615 | 23 | 23 | 0.31% | 0.35% | 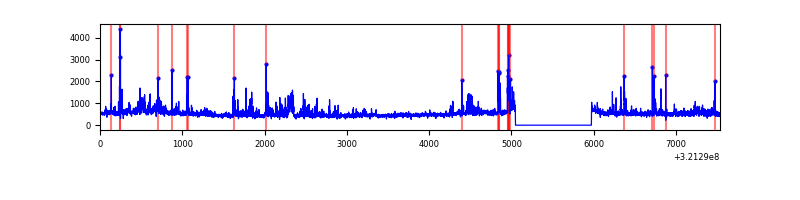 |
Top three noisy pixels from each quadrant. If the there are fewer than three noisy pixels in the level2.evt file, extra rows are filled as -1
| Pixel properties | Quadrant properties | ||||||
|---|---|---|---|---|---|---|---|
| Quadrant | DetID | PixID | Counts | Sigma | Mean | Median | Sigma |
| A | 6 | 16 | 75532 | 459.0 | 813 | 796 | 162.8 |
| A | 13 | 254 | 11056 | 63.01 | 813 | 796 | 162.8 |
| A | 0 | 226 | 7054 | 38.43 | 813 | 796 | 162.8 |
| B | 7 | 202 | 26657 | 172.41 | 806 | 785 | 150.1 |
| B | 10 | 247 | 21347 | 137.02 | 806 | 785 | 150.1 |
| B | 5 | 172 | 20785 | 133.28 | 806 | 785 | 150.1 |
| C | 14 | 238 | 124888 | 704.32 | 770 | 775 | 176.2 |
| C | 7 | 247 | 13997 | 75.03 | 770 | 775 | 176.2 |
| C | 3 | 233 | 13829 | 74.08 | 770 | 775 | 176.2 |
| D | 1 | 52 | 230589 | 1212.69 | 784 | 763 | 189.5 |
| D | 12 | 218 | 228107 | 1199.59 | 784 | 763 | 189.5 |
| D | 8 | 195 | 208837 | 1097.91 | 784 | 763 | 189.5 |
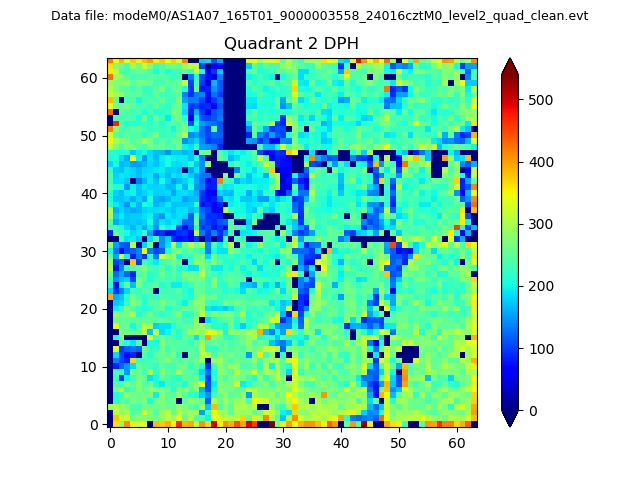
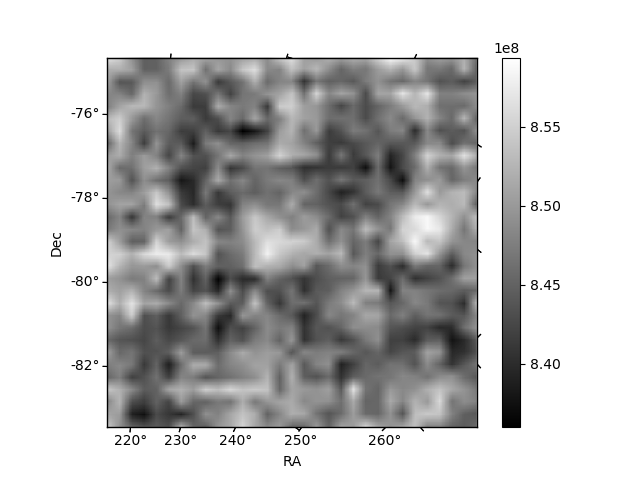
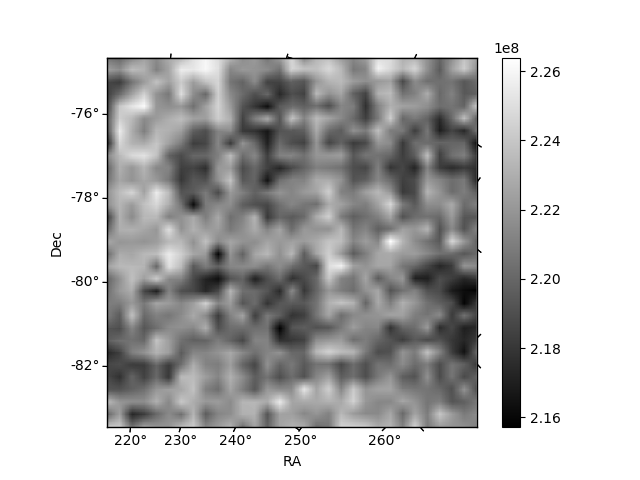
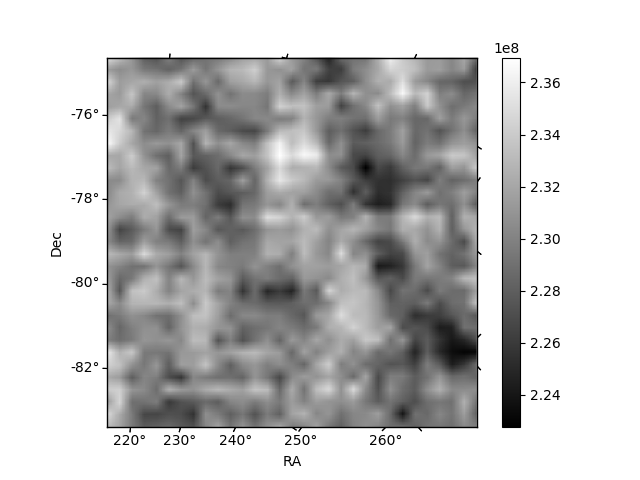
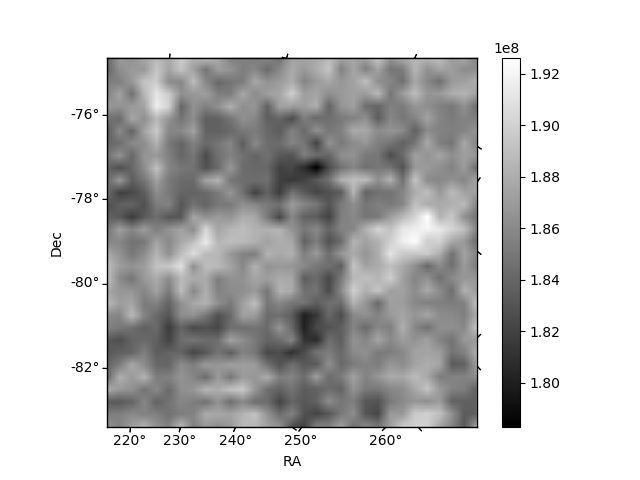
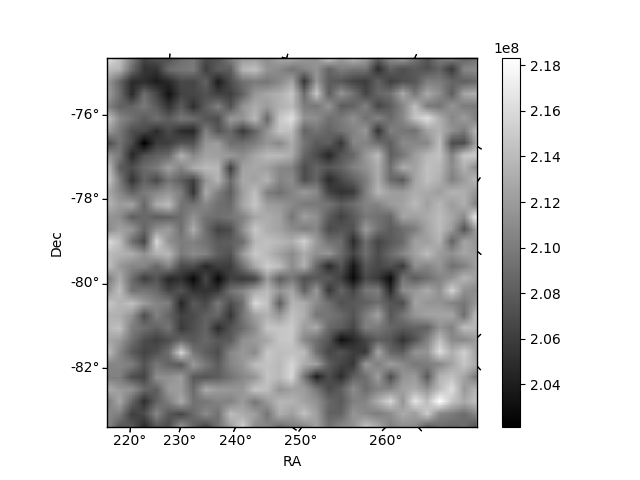
Histogram calculated using DETX and DETY for each event in the final _common_clean file
| Quadrant A | 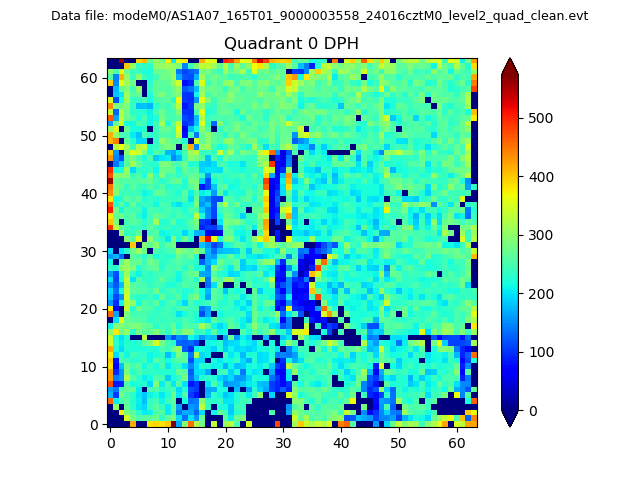 |
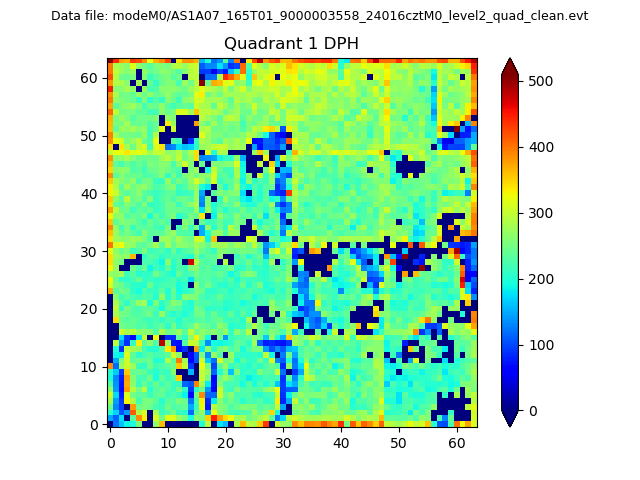 |
Quadrant B |
|---|---|---|---|
| Quadrant D | 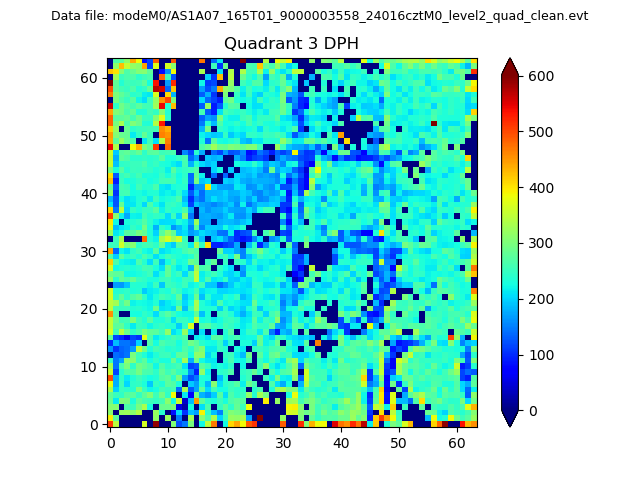 |
 |
Quadrant C |
| Plot type | Count rate plots | Images |
|---|---|---|
| Comparison with Poisson distribution Blue bars denote a histogram of data divided into 1 sec bins. Red curve is a Poisson curve with rate = median count rate of data. |
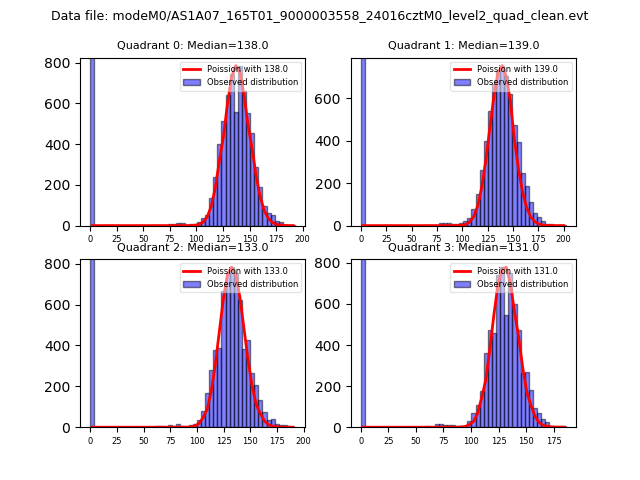 |
 |
| Quadrant-wise count rates Data is divided into 100 sec bins |
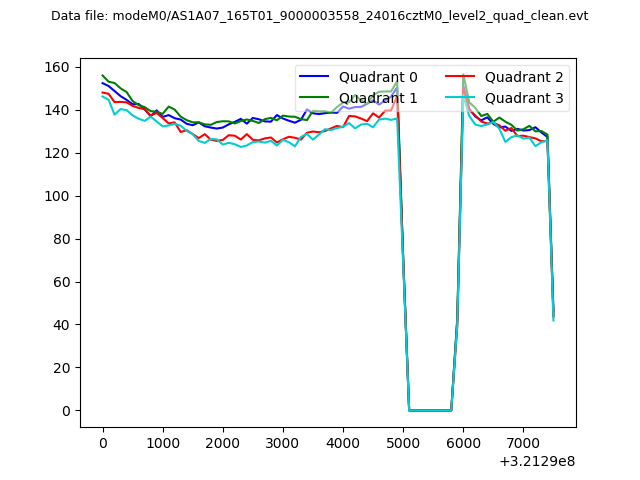 |
|
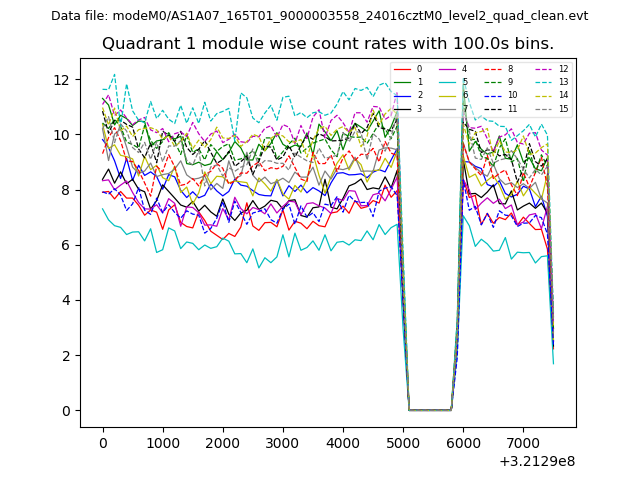
| Module-wise count rates for Quadrant A Data is divided into 100 sec bins |
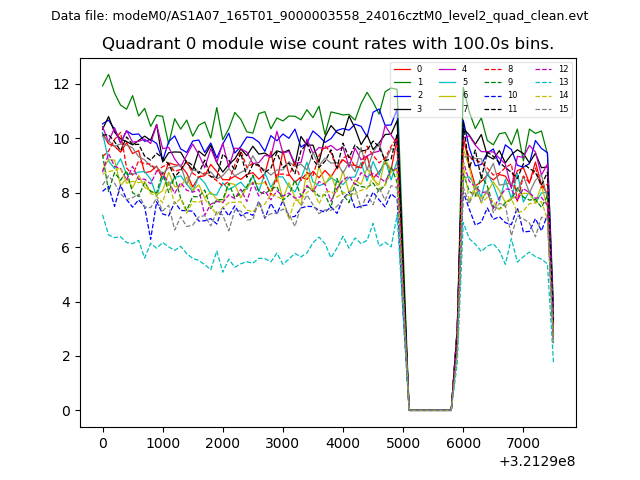 |
 |
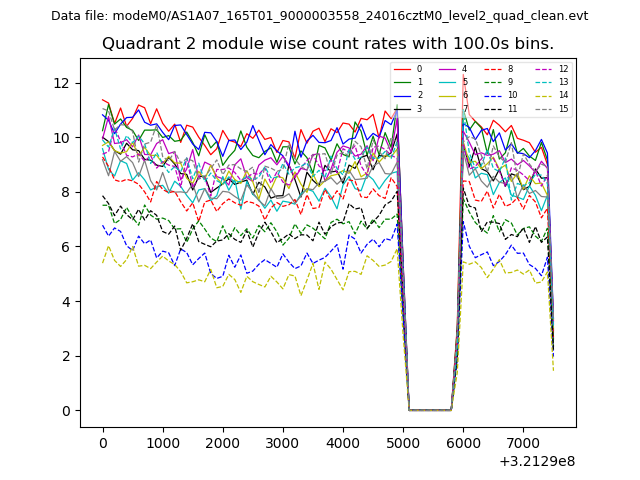
| Module-wise count rates for Quadrant B Data is divided into 100 sec bins |
 |
 |
| Module-wise count rates for Quadrant C Data is divided into 100 sec bins |
 |
 |
| Module-wise count rates for Quadrant D Data is divided into 100 sec bins |
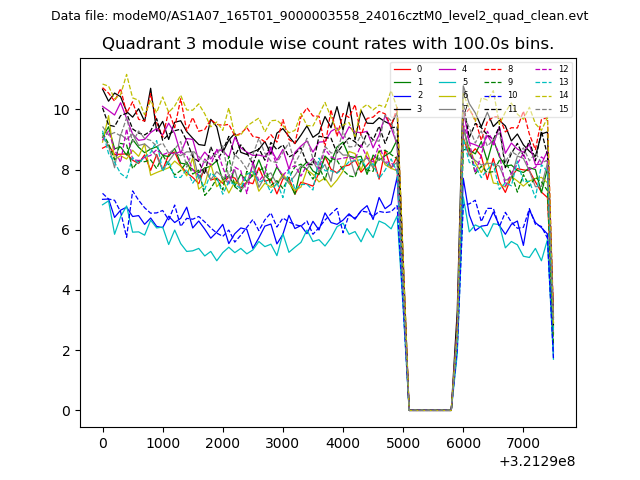 |
 |
| Parameter | Plot |
|---|---|
| CZT HV Monitor | 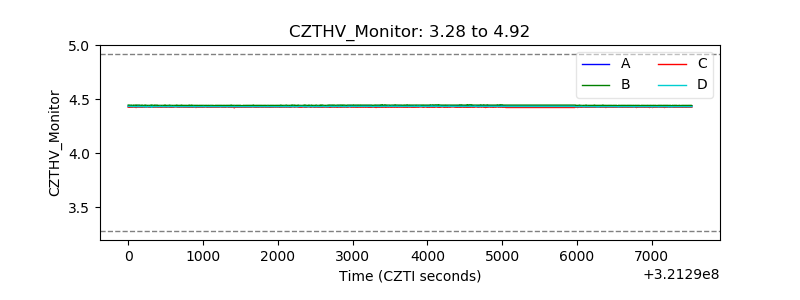 |
| D_VDD | 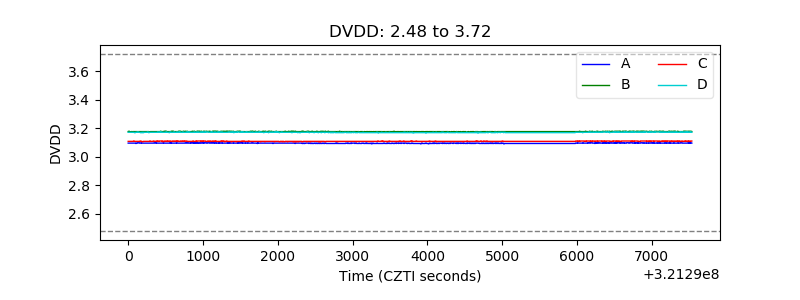 |
| Temperature 1 | 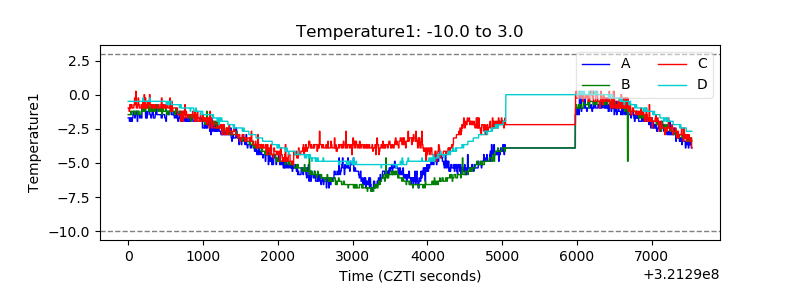 |
| Veto HV Monitor |  |
| Veto LLD | 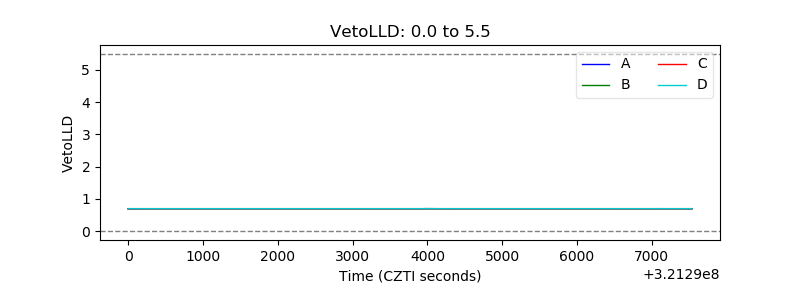 |
| Alpha Counter | 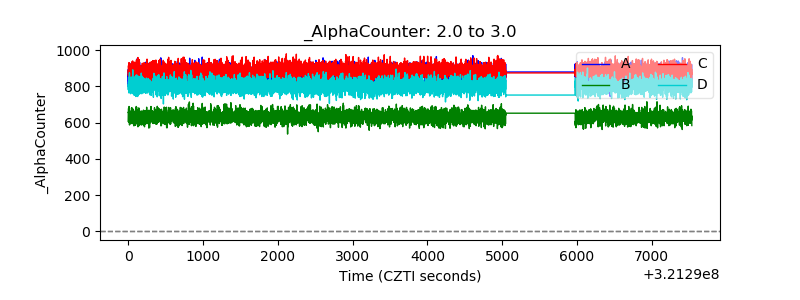 |
| _CPM_Rate | 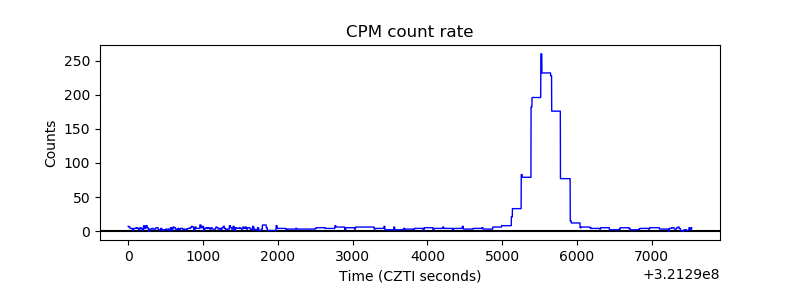 |
| CZT Counter | 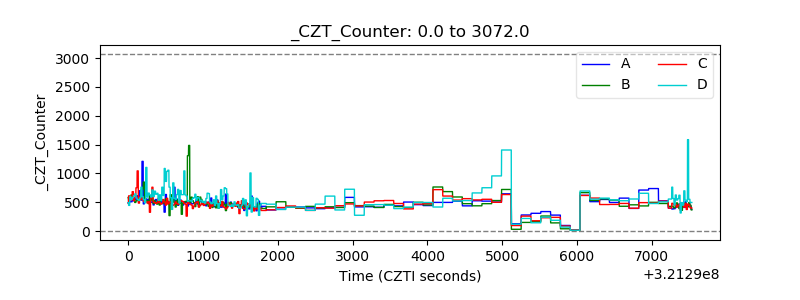 |
| +2.5 Volts monitor | 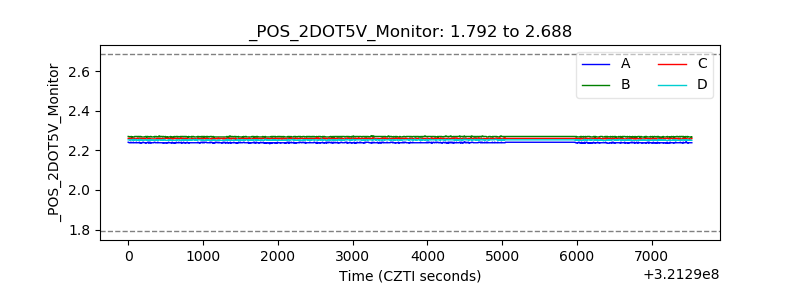 |
| +5 Volts monitor |  |
| _ROLL_ROT | 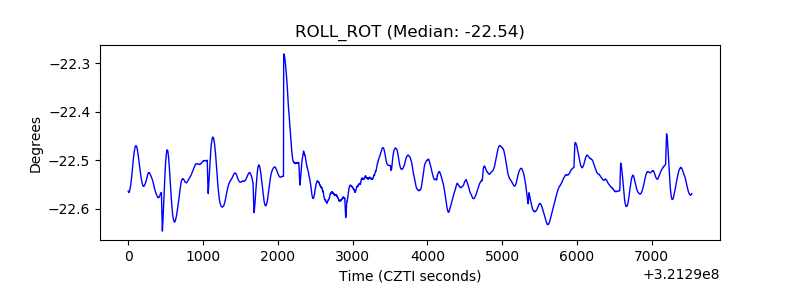 |
| _Roll_DEC | 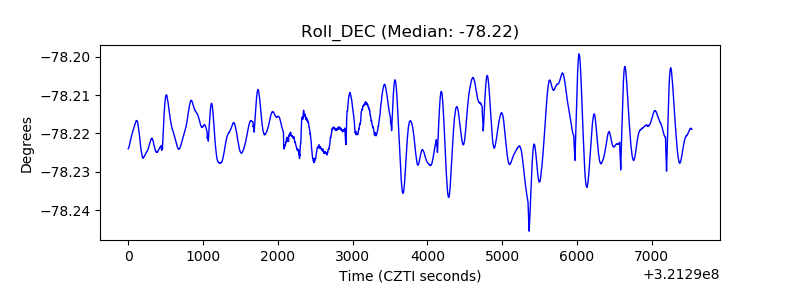 |
| _Roll_RA | 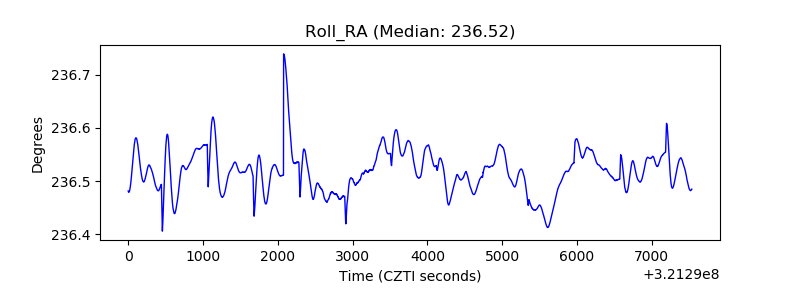 |
| Veto Counter | 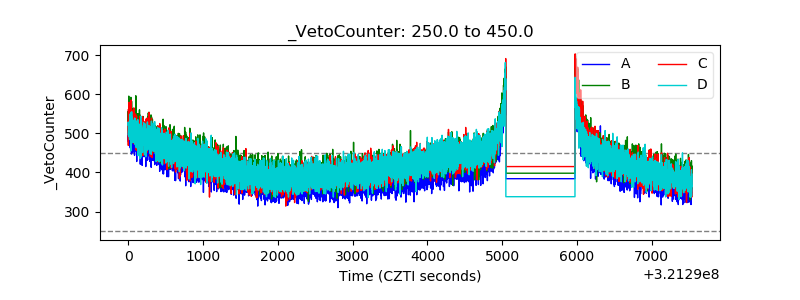 |