| Param | Original file | Final file |
|---|---|---|
| Filename | modeM0/AS1A07_165T01_9000003558_24017cztM0_level2.evt | modeM0/AS1A07_165T01_9000003558_24017cztM0_level2_quad_clean.evt |
| Size (bytes) | 532,486,080 | 140,783,040 |
| Size | 507.8 MB | 134.3 MB |
| Events in quadrant A | 3,707,927 | 953,610 |
| Events in quadrant B | 3,543,013 | 972,254 |
| Events in quadrant C | 3,509,789 | 926,917 |
| Events in quadrant D | 4,873,079 | 906,121 |
| Mode M9 | |||
|---|---|---|---|
| Quadrant | BADHDUFLAG | Total packets | Discarded packets |
| A | 0 | 5 | 0 |
| B | 0 | 5 | 0 |
| C | 0 | 5 | 0 |
| D | 0 | 5 | 0 |
| Mode M0 | |||
|---|---|---|---|
| Quadrant | BADHDUFLAG | Total packets | Discarded packets |
| A | 0 | 15728 | 2 |
| B | 0 | 15209 | 2 |
| C | 0 | 15155 | 2 |
| D | 0 | 19270 | 2 |
| Mode SS | |||
|---|---|---|---|
| Quadrant | BADHDUFLAG | Total packets | Discarded packets |
| A | 0 | 148 | 0 |
| B | 0 | 148 | 0 |
| C | 0 | 148 | 0 |
| D | 0 | 148 | 0 |
| Quadrant | Total seconds | Saturated seconds | Saturation percentage |
|---|---|---|---|
| A | 7251 | 139 | 1.916977% |
| B | 7252 | 125 | 1.723662% |
| C | 7252 | 132 | 1.820188% |
| D | 7252 | 150 | 2.068395% |
Noise dominated data is calculated using 1-second bins in cleaned event files. If a bin has >2000 counts, and if more than 50% of those come from <1% of pixels, then it is considered to be noise-dominated and hence unusable.
| Quadrant | # 1 sec bins | Bins with >0 counts | Bins with >2000 counts | High rate bins dominated by noise | Noise dominated (total time) | Noise dominated (detector-on time) | Marked lightcurve |
|---|---|---|---|---|---|---|---|
| A | 7746 | 7252 | 50 | 50 | 0.65% | 0.69% | 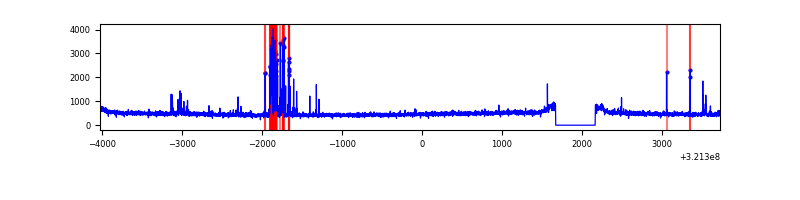 |
| B | 7747 | 7253 | 5 | 5 | 0.06% | 0.07% | 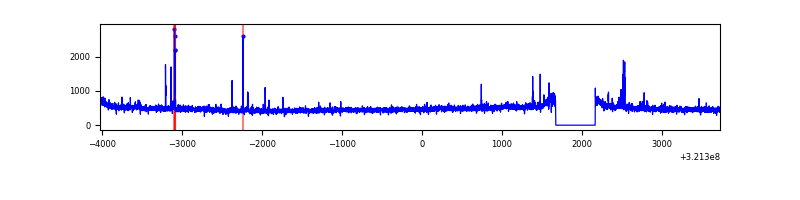 |
| C | 7747 | 7253 | 9 | 9 | 0.12% | 0.12% | 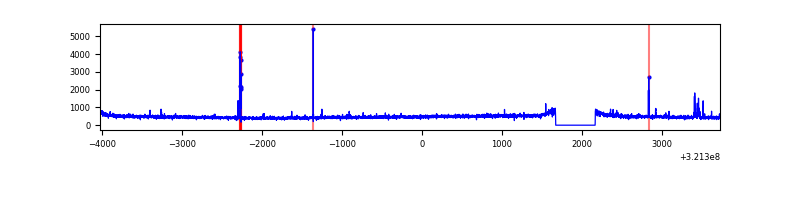 |
| D | 7747 | 7253 | 68 | 68 | 0.88% | 0.94% | 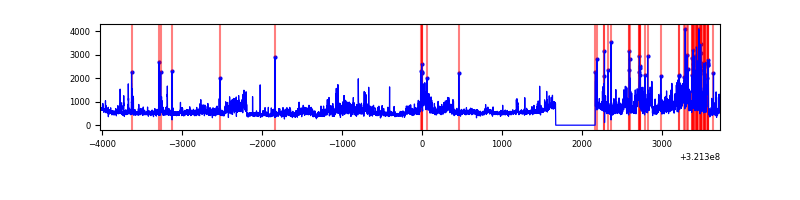 |
Top three noisy pixels from each quadrant. If the there are fewer than three noisy pixels in the level2.evt file, extra rows are filled as -1
| Pixel properties | Quadrant properties | ||||||
|---|---|---|---|---|---|---|---|
| Quadrant | DetID | PixID | Counts | Sigma | Mean | Median | Sigma |
| A | 6 | 16 | 304423 | 1706.76 | 880 | 860 | 177.9 |
| A | 13 | 254 | 12410 | 64.94 | 880 | 860 | 177.9 |
| A | 0 | 226 | 7812 | 39.08 | 880 | 860 | 177.9 |
| B | 10 | 247 | 28686 | 168.83 | 878 | 857 | 164.8 |
| B | 7 | 219 | 19667 | 114.12 | 878 | 857 | 164.8 |
| B | 12 | 111 | 19322 | 112.02 | 878 | 857 | 164.8 |
| C | 14 | 238 | 132839 | 683.3 | 838 | 842 | 193.2 |
| C | 0 | 239 | 50364 | 256.35 | 838 | 842 | 193.2 |
| C | 10 | 9 | 45567 | 231.52 | 838 | 842 | 193.2 |
| D | 8 | 195 | 785703 | 3802.59 | 850 | 824 | 206.4 |
| D | 1 | 52 | 569946 | 2757.29 | 850 | 824 | 206.4 |
| D | 12 | 218 | 84412 | 404.97 | 850 | 824 | 206.4 |
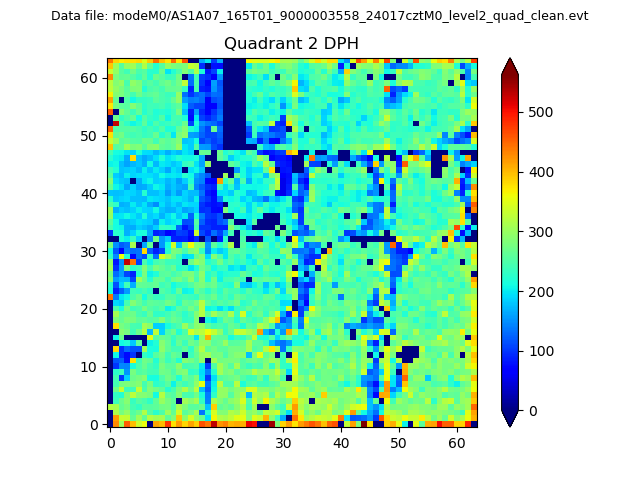
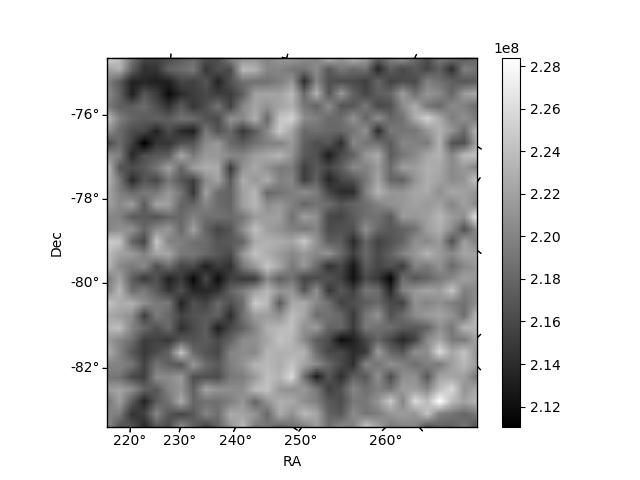
Histogram calculated using DETX and DETY for each event in the final _common_clean file
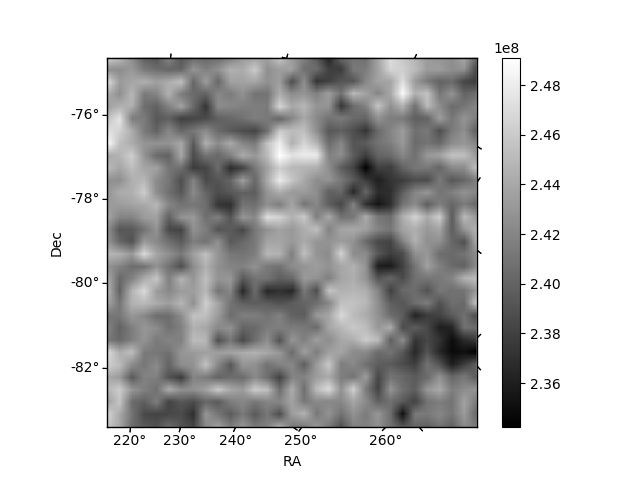
| Quadrant A | 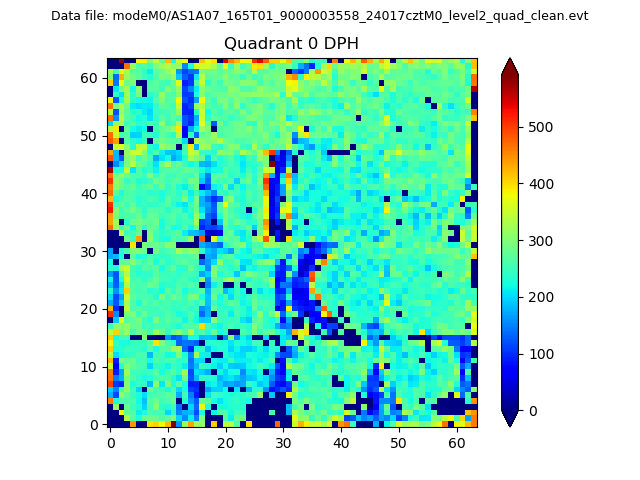 |
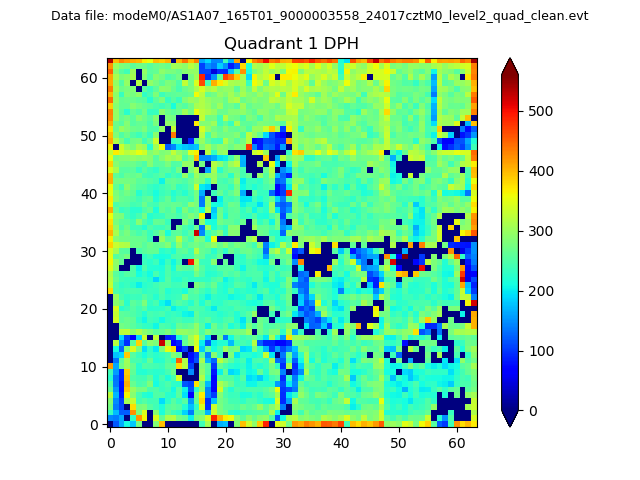 |
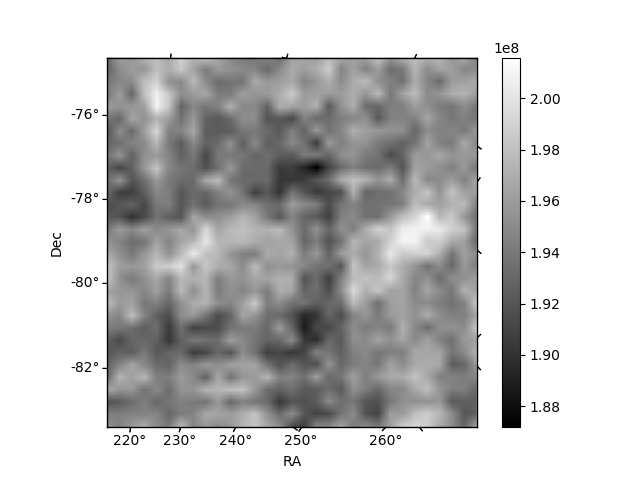
Quadrant B |
|---|---|---|---|
| Quadrant D | 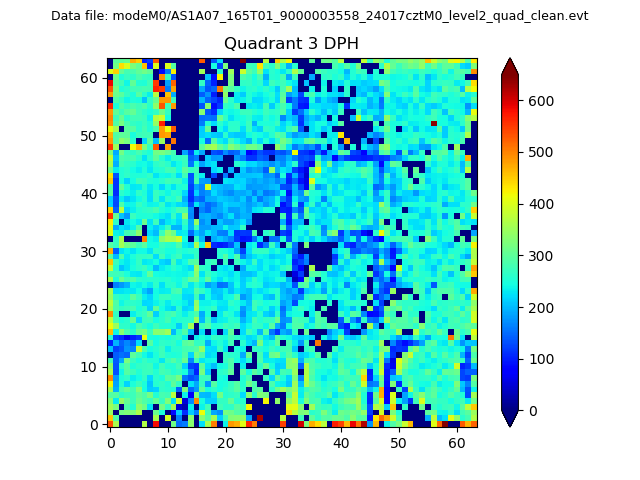 |
 |
Quadrant C |
| Plot type | Count rate plots | Images |
|---|---|---|
| Comparison with Poisson distribution Blue bars denote a histogram of data divided into 1 sec bins. Red curve is a Poisson curve with rate = median count rate of data. |
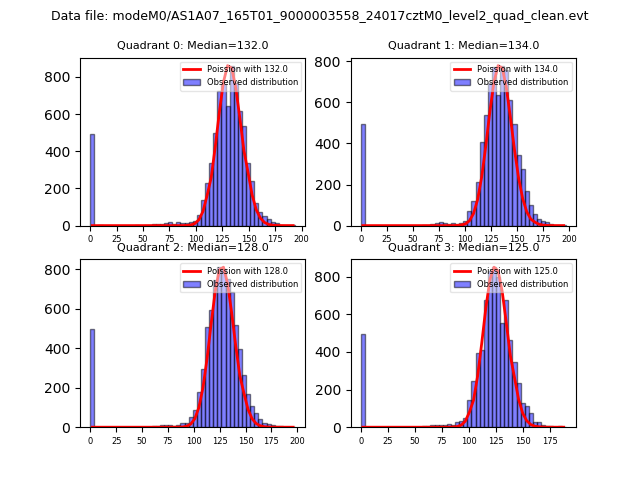 |
 |
| Quadrant-wise count rates Data is divided into 100 sec bins |
 |
|
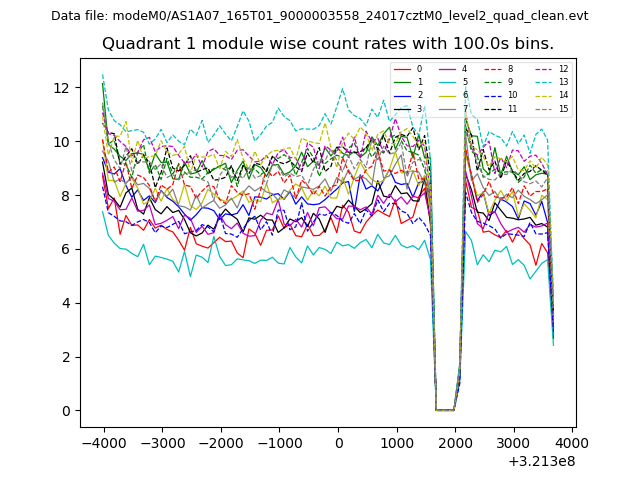
| Module-wise count rates for Quadrant A Data is divided into 100 sec bins |
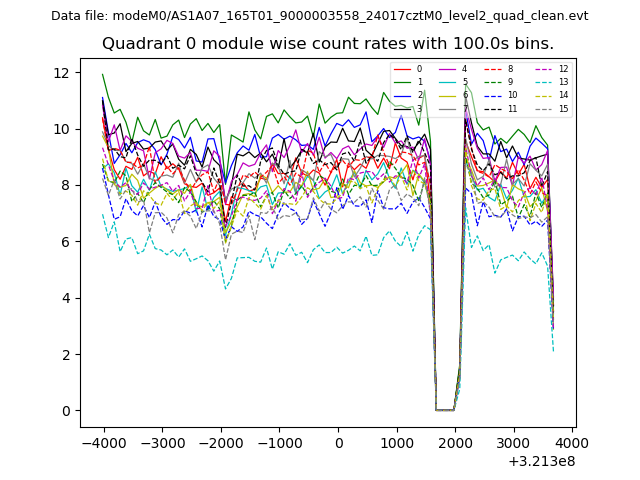 |
 |
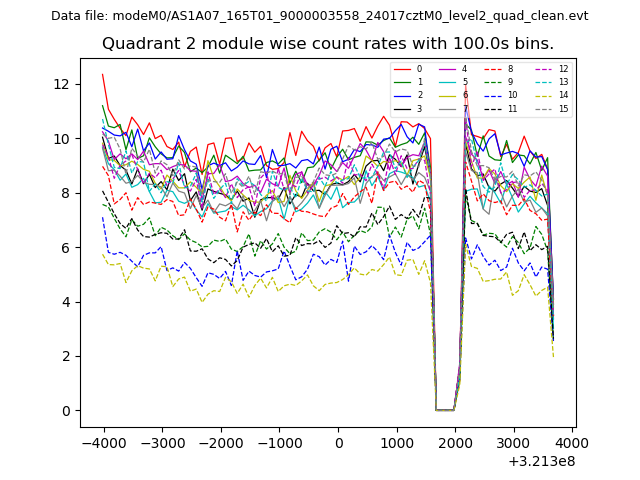
| Module-wise count rates for Quadrant B Data is divided into 100 sec bins |
 |
 |
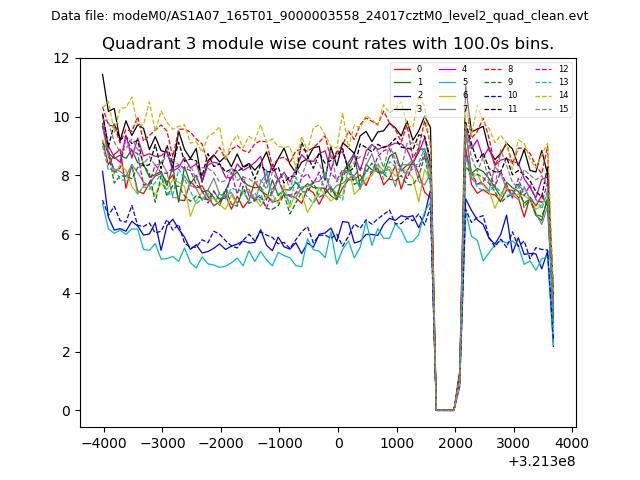
| Module-wise count rates for Quadrant C Data is divided into 100 sec bins |
 |
 |
| Module-wise count rates for Quadrant D Data is divided into 100 sec bins |
 |
 |
| Parameter | Plot |
|---|---|
| CZT HV Monitor | 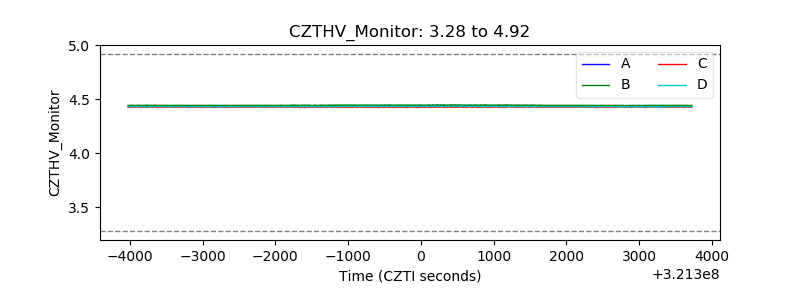 |
| D_VDD | 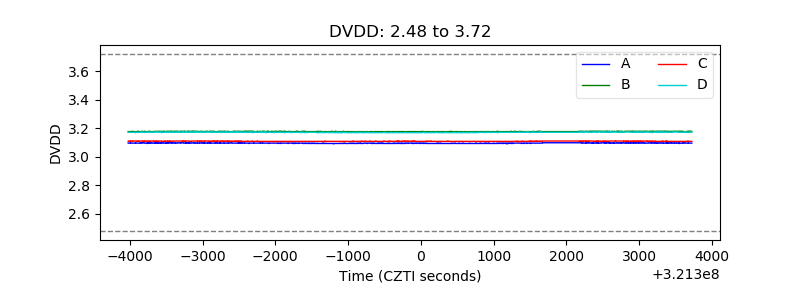 |
| Temperature 1 | 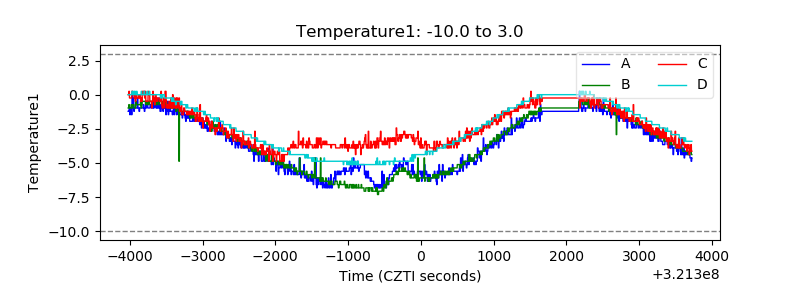 |
| Veto HV Monitor |  |
| Veto LLD | 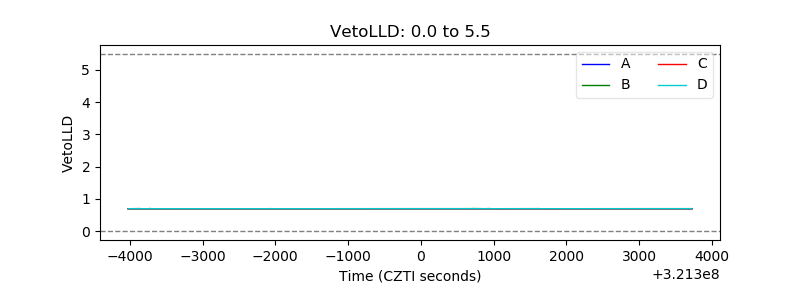 |
| Alpha Counter | 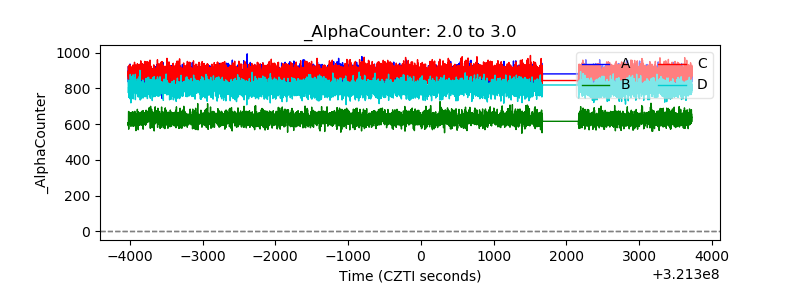 |
| _CPM_Rate | 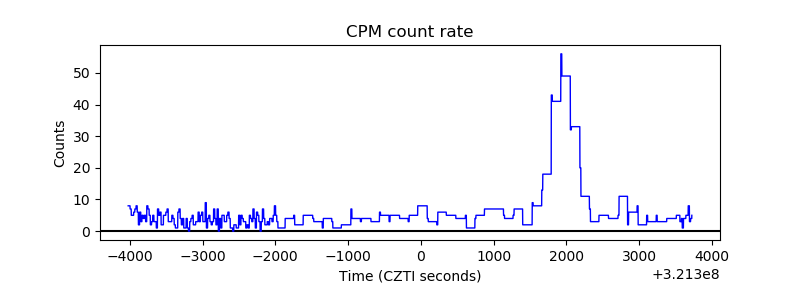 |
| CZT Counter | 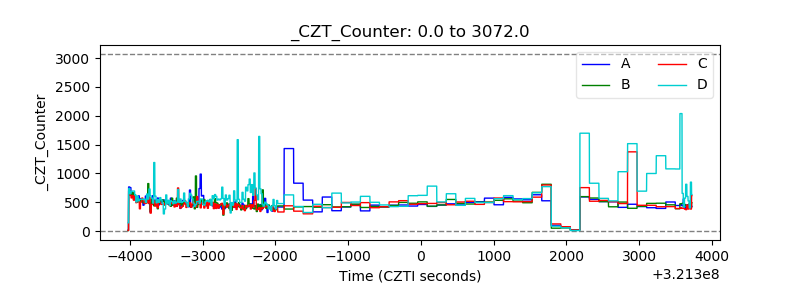 |
| +2.5 Volts monitor |  |
| +5 Volts monitor |  |
| _ROLL_ROT | 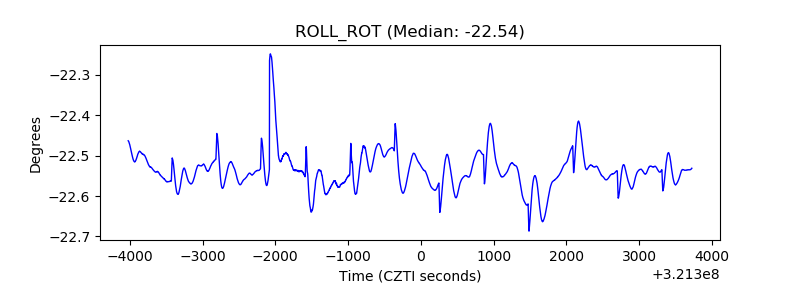 |
| _Roll_DEC | 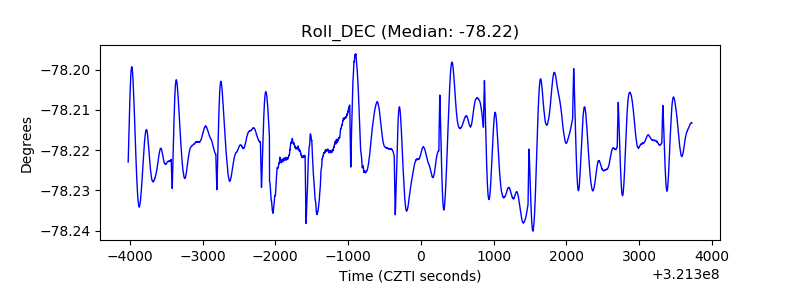 |
| _Roll_RA | 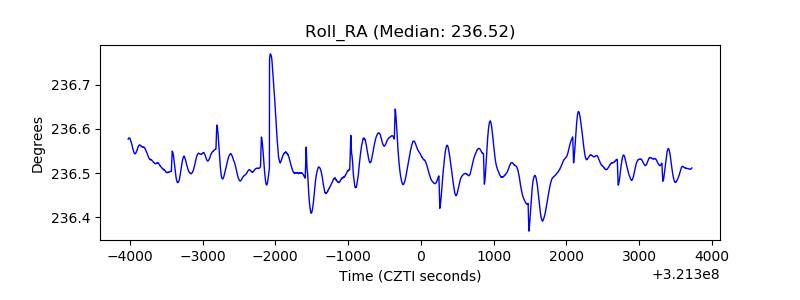 |
| Veto Counter | 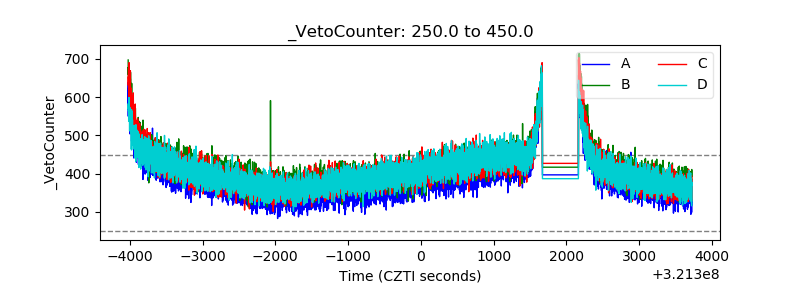 |