| Param | Original file | Final file |
|---|---|---|
| Filename | modeM0/AS1A07_165T01_9000003558_24018cztM0_level2.evt | modeM0/AS1A07_165T01_9000003558_24018cztM0_level2_quad_clean.evt |
| Size (bytes) | 546,465,600 | 132,514,560 |
| Size | 521.2 MB | 126.4 MB |
| Events in quadrant A | 3,559,879 | 902,293 |
| Events in quadrant B | 3,384,337 | 917,275 |
| Events in quadrant C | 3,356,624 | 873,845 |
| Events in quadrant D | 5,772,881 | 831,265 |
| Mode M9 | |||
|---|---|---|---|
| Quadrant | BADHDUFLAG | Total packets | Discarded packets |
| A | 0 | 3 | 0 |
| B | 0 | 3 | 0 |
| C | 0 | 3 | 0 |
| D | 0 | 3 | 0 |
| Mode M0 | |||
|---|---|---|---|
| Quadrant | BADHDUFLAG | Total packets | Discarded packets |
| A | 0 | 15216 | 1 |
| B | 0 | 14645 | 1 |
| C | 0 | 14556 | 1 |
| D | 0 | 21991 | 1 |
| Mode SS | |||
|---|---|---|---|
| Quadrant | BADHDUFLAG | Total packets | Discarded packets |
| A | 0 | 142 | 0 |
| B | 0 | 142 | 0 |
| C | 0 | 142 | 0 |
| D | 0 | 142 | 0 |
| Quadrant | Total seconds | Saturated seconds | Saturation percentage |
|---|---|---|---|
| A | 7022 | 101 | 1.438337% |
| B | 7023 | 89 | 1.267265% |
| C | 7023 | 101 | 1.438132% |
| D | 7023 | 414 | 5.894917% |
Noise dominated data is calculated using 1-second bins in cleaned event files. If a bin has >2000 counts, and if more than 50% of those come from <1% of pixels, then it is considered to be noise-dominated and hence unusable.
| Quadrant | # 1 sec bins | Bins with >0 counts | Bins with >2000 counts | High rate bins dominated by noise | Noise dominated (total time) | Noise dominated (detector-on time) | Marked lightcurve |
|---|---|---|---|---|---|---|---|
| A | 7297 | 7023 | 28 | 28 | 0.38% | 0.40% | 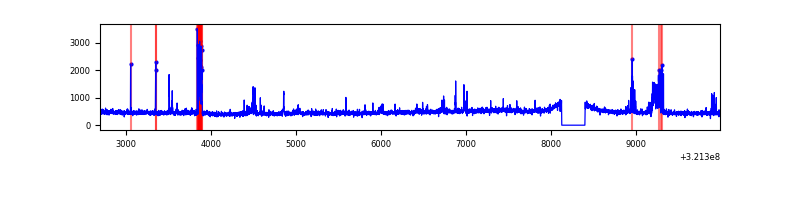 |
| B | 7298 | 7024 | 2 | 2 | 0.03% | 0.03% | 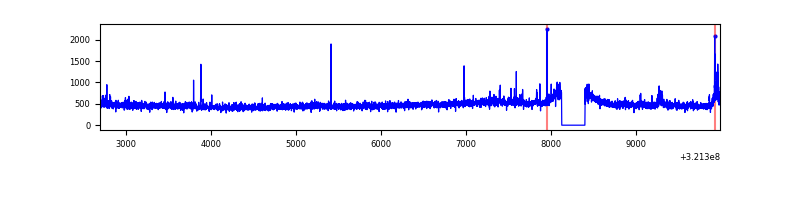 |
| C | 7298 | 7024 | 6 | 6 | 0.08% | 0.09% | 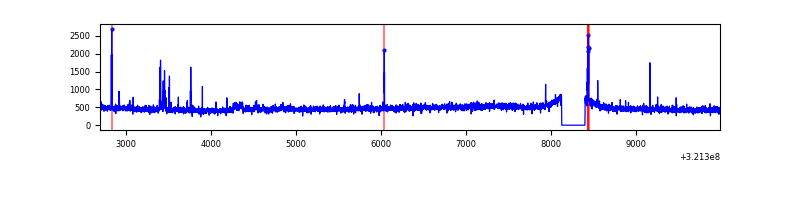 |
| D | 7298 | 7024 | 288 | 288 | 3.95% | 4.10% | 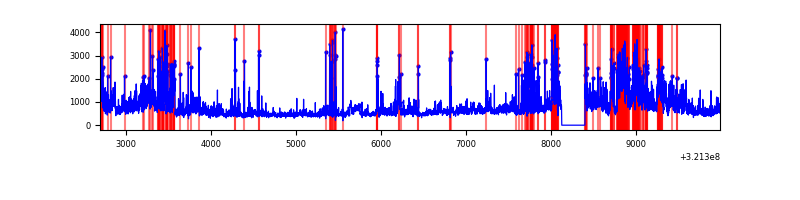 |
Top three noisy pixels from each quadrant. If the there are fewer than three noisy pixels in the level2.evt file, extra rows are filled as -1
| Pixel properties | Quadrant properties | ||||||
|---|---|---|---|---|---|---|---|
| Quadrant | DetID | PixID | Counts | Sigma | Mean | Median | Sigma |
| A | 6 | 16 | 276822 | 1640.91 | 836 | 819 | 168.2 |
| A | 2 | 250 | 34552 | 200.55 | 836 | 819 | 168.2 |
| A | 0 | 254 | 22124 | 126.66 | 836 | 819 | 168.2 |
| B | 0 | 189 | 41617 | 258.58 | 834 | 812 | 157.8 |
| B | 3 | 209 | 19961 | 121.35 | 834 | 812 | 157.8 |
| B | 12 | 111 | 18145 | 109.84 | 834 | 812 | 157.8 |
| C | 14 | 238 | 126679 | 686.29 | 794 | 797 | 183.4 |
| C | 10 | 9 | 94960 | 513.36 | 794 | 797 | 183.4 |
| C | 0 | 239 | 29358 | 155.71 | 794 | 797 | 183.4 |
| D | 8 | 195 | 1263800 | 6512.44 | 792 | 767 | 193.9 |
| D | 1 | 52 | 917612 | 4727.43 | 792 | 767 | 193.9 |
| D | 12 | 218 | 391334 | 2013.84 | 792 | 767 | 193.9 |
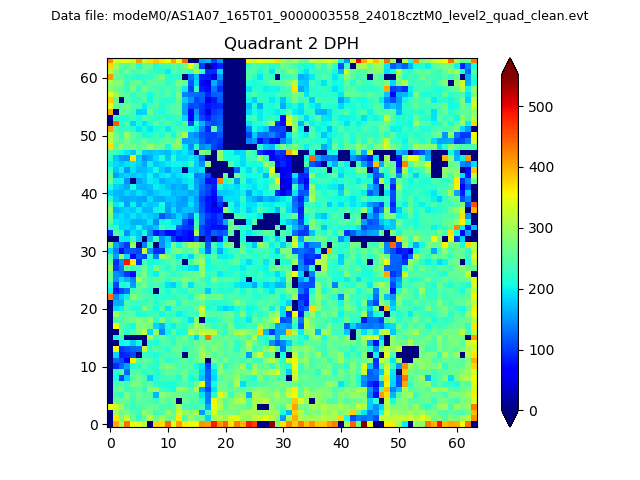
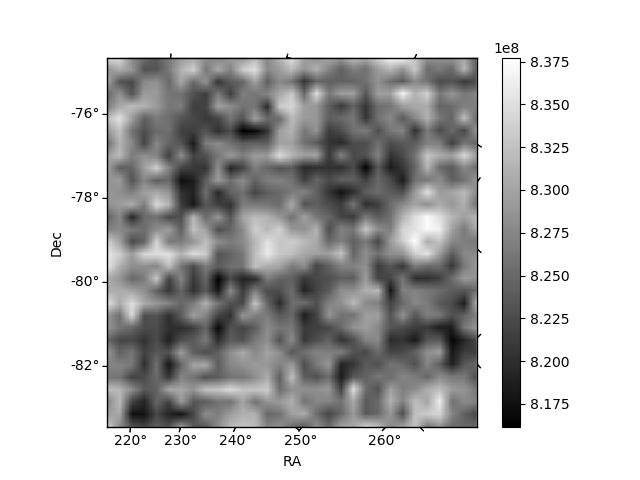
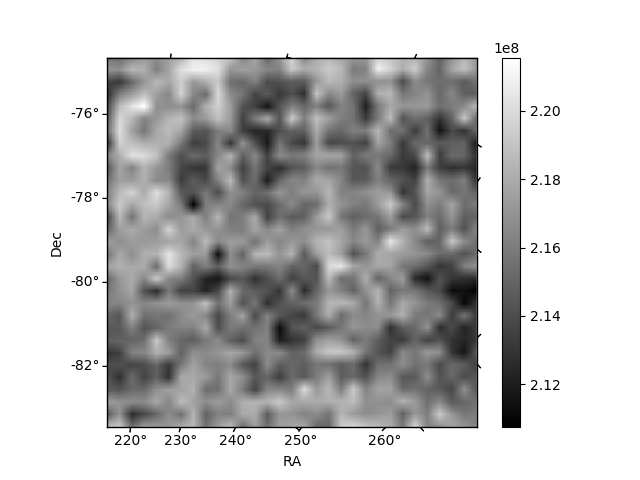
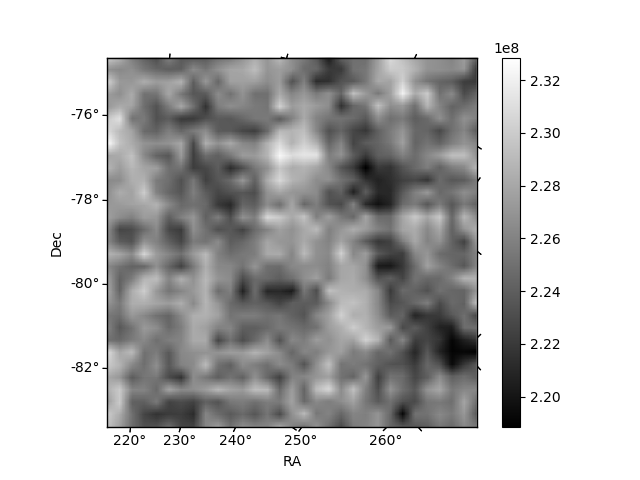
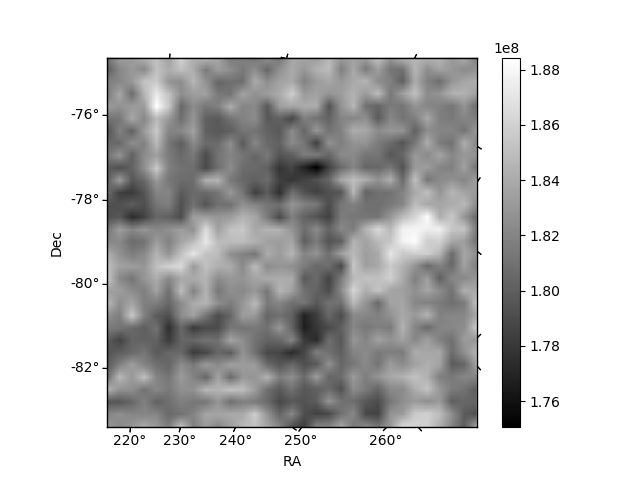
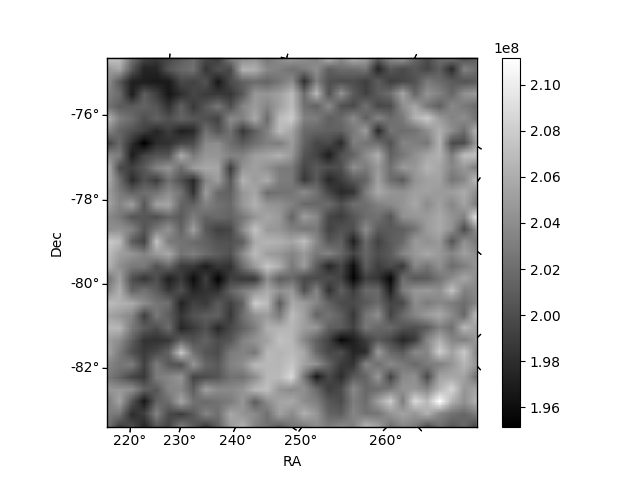
Histogram calculated using DETX and DETY for each event in the final _common_clean file
| Quadrant A | 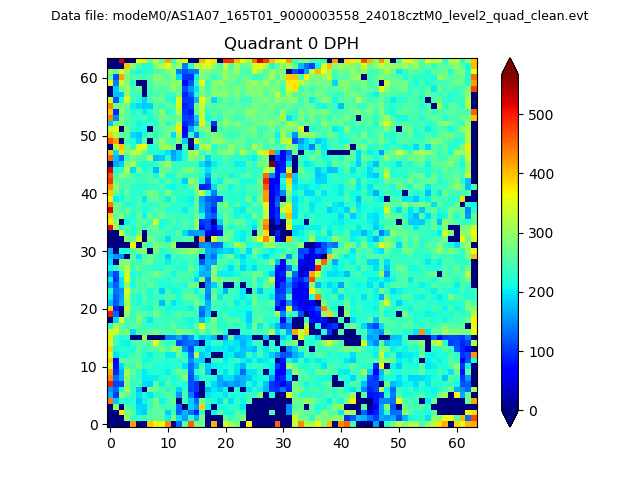 |
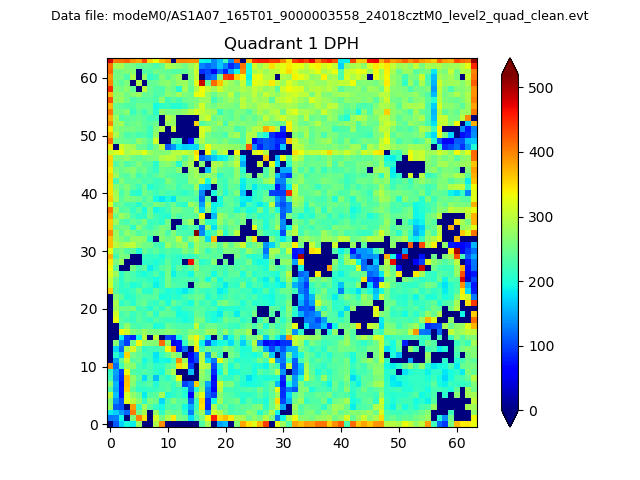 |
Quadrant B |
|---|---|---|---|
| Quadrant D | 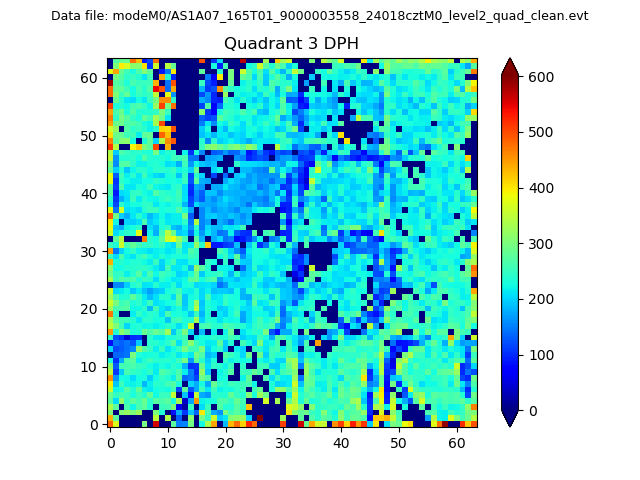 |
 |
Quadrant C |
| Plot type | Count rate plots | Images |
|---|---|---|
| Comparison with Poisson distribution Blue bars denote a histogram of data divided into 1 sec bins. Red curve is a Poisson curve with rate = median count rate of data. |
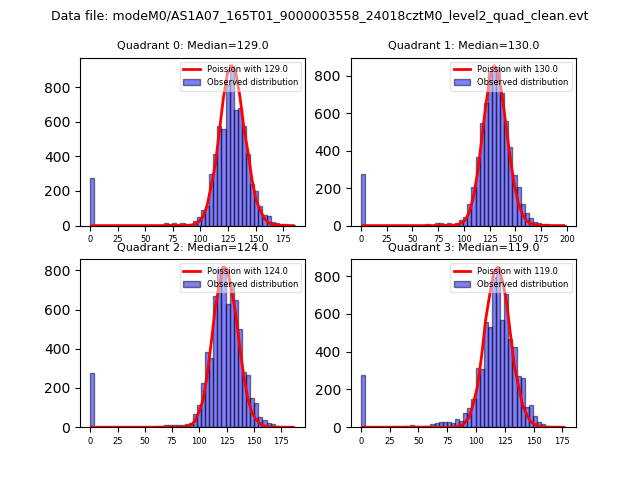 |
 |
| Quadrant-wise count rates Data is divided into 100 sec bins |
 |
|
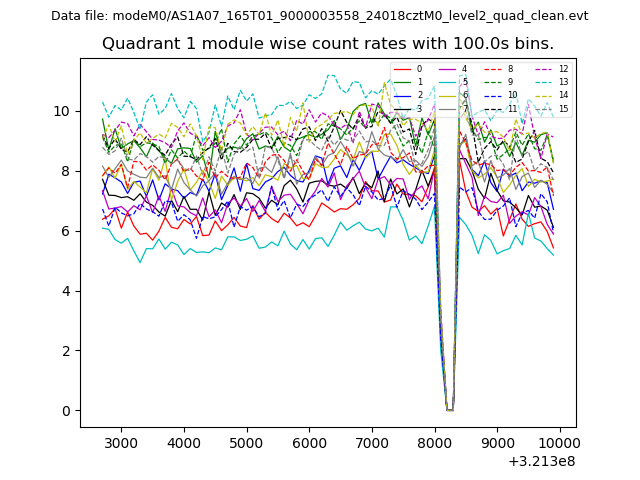
| Module-wise count rates for Quadrant A Data is divided into 100 sec bins |
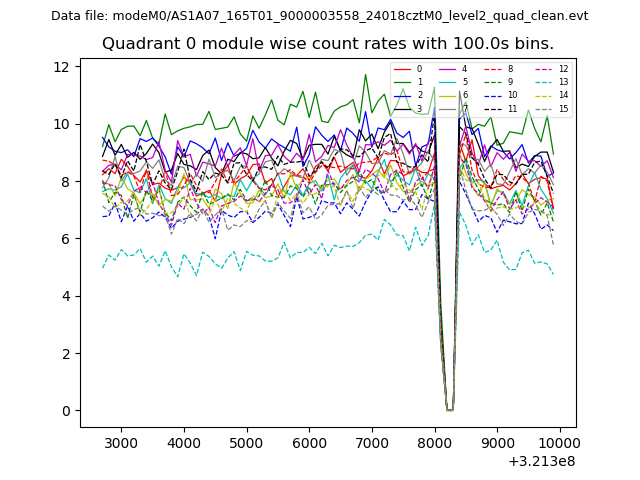 |
 |
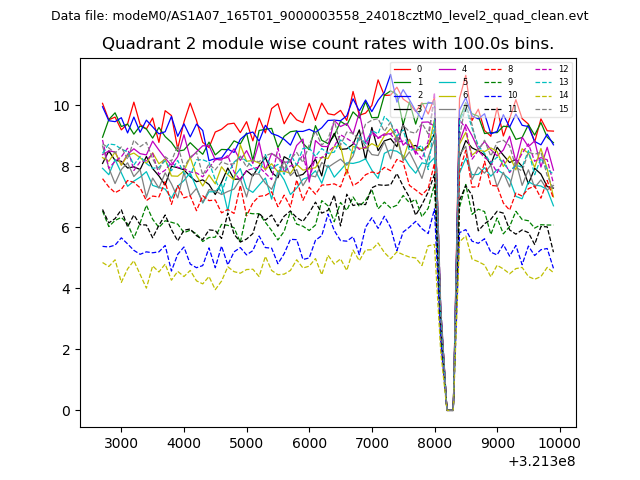
| Module-wise count rates for Quadrant B Data is divided into 100 sec bins |
 |
 |
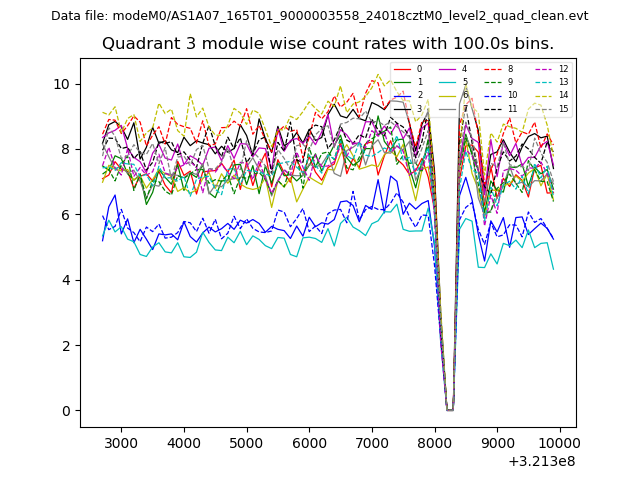
| Module-wise count rates for Quadrant C Data is divided into 100 sec bins |
 |
 |
| Module-wise count rates for Quadrant D Data is divided into 100 sec bins |
 |
 |
| Parameter | Plot |
|---|---|
| CZT HV Monitor | 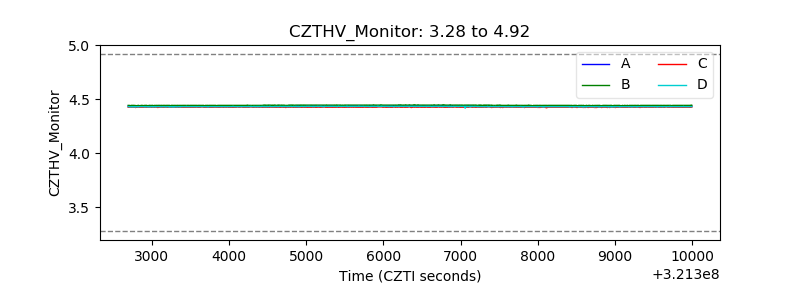 |
| D_VDD | 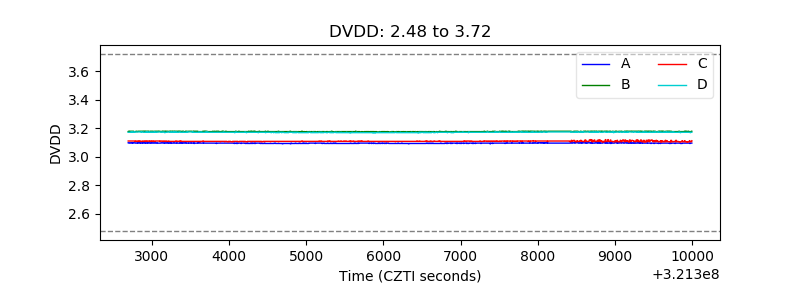 |
| Temperature 1 | 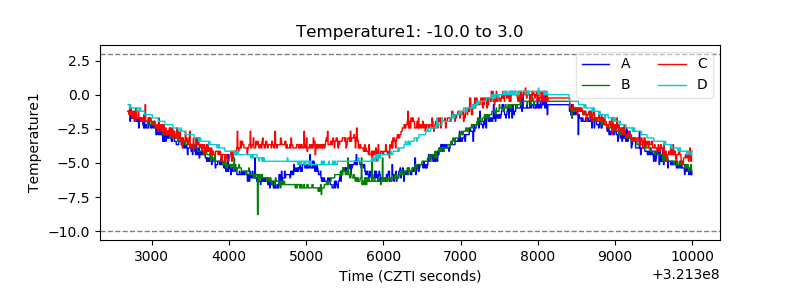 |
| Veto HV Monitor |  |
| Veto LLD |  |
| Alpha Counter | 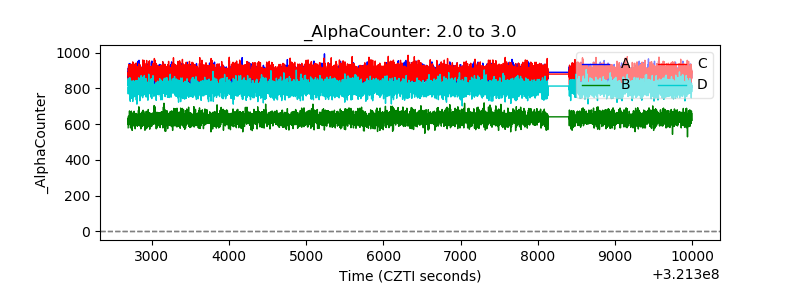 |
| _CPM_Rate | 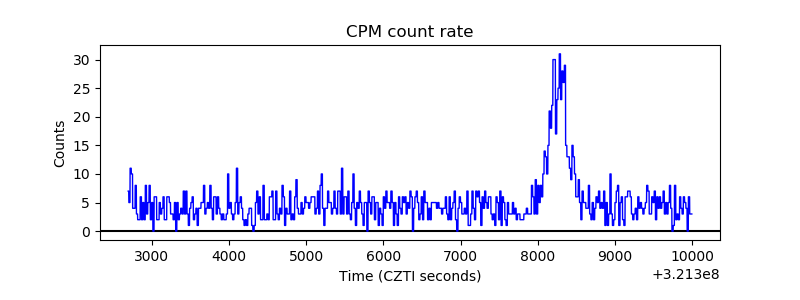 |
| CZT Counter | 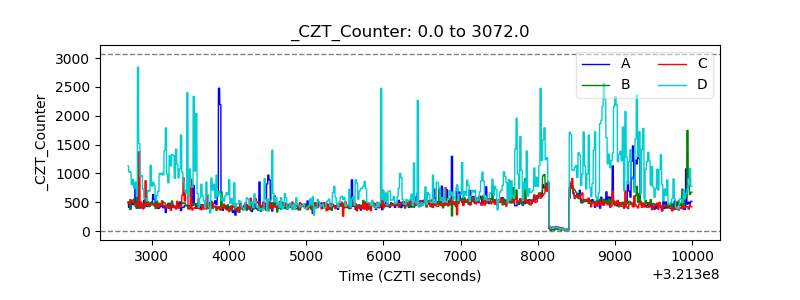 |
| +2.5 Volts monitor |  |
| +5 Volts monitor |  |
| _ROLL_ROT | 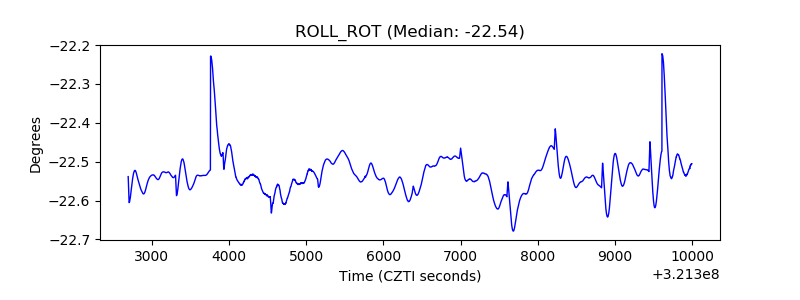 |
| _Roll_DEC | 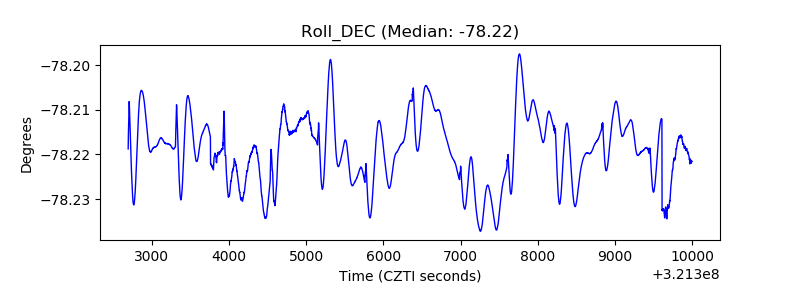 |
| _Roll_RA | 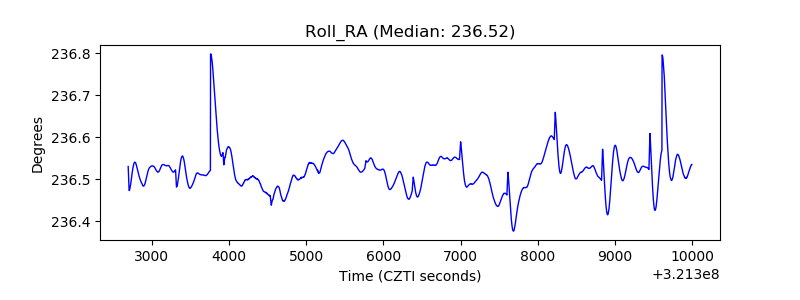 |
| Veto Counter | 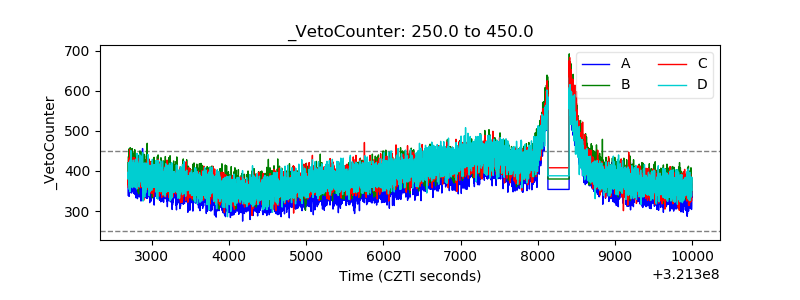 |