| Param | Original file | Final file |
|---|---|---|
| Filename | modeM0/AS1A07_165T01_9000003558_24019cztM0_level2.evt | modeM0/AS1A07_165T01_9000003558_24019cztM0_level2_quad_clean.evt |
| Size (bytes) | 556,859,520 | 140,780,160 |
| Size | 531.1 MB | 134.3 MB |
| Events in quadrant A | 3,690,238 | 955,994 |
| Events in quadrant B | 3,736,888 | 968,215 |
| Events in quadrant C | 3,622,468 | 923,898 |
| Events in quadrant D | 5,306,854 | 894,532 |
| Mode M9 | |||
|---|---|---|---|
| Quadrant | BADHDUFLAG | Total packets | Discarded packets |
| A | 0 | 6 | 0 |
| B | 0 | 7 | 0 |
| C | 0 | 7 | 0 |
| D | 0 | 7 | 0 |
| Mode M0 | |||
|---|---|---|---|
| Quadrant | BADHDUFLAG | Total packets | Discarded packets |
| A | 0 | 16006 | 2 |
| B | 0 | 15818 | 2 |
| C | 0 | 15699 | 2 |
| D | 0 | 20768 | 2 |
| Mode SS | |||
|---|---|---|---|
| Quadrant | BADHDUFLAG | Total packets | Discarded packets |
| A | 0 | 150 | 0 |
| B | 0 | 150 | 0 |
| C | 0 | 150 | 0 |
| D | 0 | 150 | 0 |
| Quadrant | Total seconds | Saturated seconds | Saturation percentage |
|---|---|---|---|
| A | 7499 | 56 | 0.746766% |
| B | 7499 | 75 | 1.000133% |
| C | 7499 | 115 | 1.533538% |
| D | 7499 | 261 | 3.480464% |
Noise dominated data is calculated using 1-second bins in cleaned event files. If a bin has >2000 counts, and if more than 50% of those come from <1% of pixels, then it is considered to be noise-dominated and hence unusable.
| Quadrant | # 1 sec bins | Bins with >0 counts | Bins with >2000 counts | High rate bins dominated by noise | Noise dominated (total time) | Noise dominated (detector-on time) | Marked lightcurve |
|---|---|---|---|---|---|---|---|
| A | 7914 | 7500 | 5 | 5 | 0.06% | 0.07% | 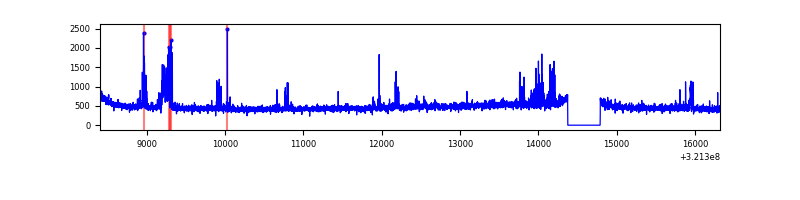 |
| B | 7914 | 7500 | 3 | 3 | 0.04% | 0.04% | 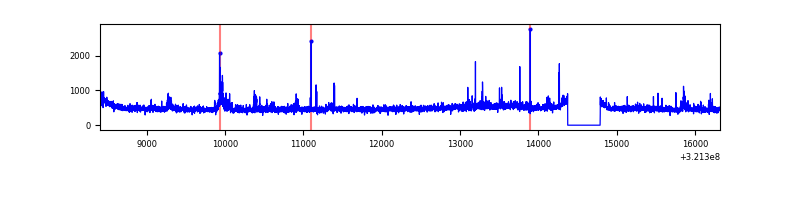 |
| C | 7914 | 7500 | 17 | 17 | 0.21% | 0.23% | 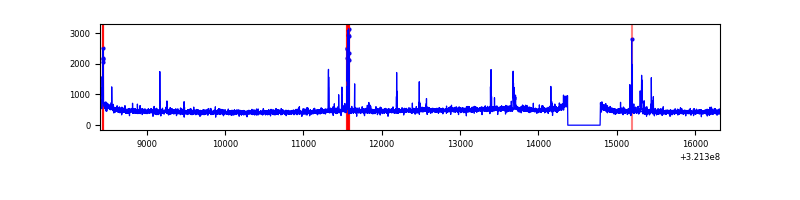 |
| D | 7914 | 7500 | 214 | 214 | 2.70% | 2.85% | 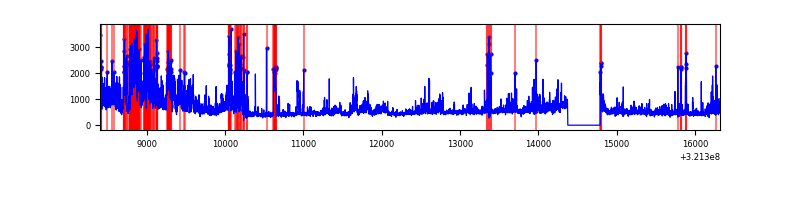 |
Top three noisy pixels from each quadrant. If the there are fewer than three noisy pixels in the level2.evt file, extra rows are filled as -1
| Pixel properties | Quadrant properties | ||||||
|---|---|---|---|---|---|---|---|
| Quadrant | DetID | PixID | Counts | Sigma | Mean | Median | Sigma |
| A | 6 | 16 | 245843 | 1357.44 | 890 | 870 | 180.5 |
| A | 13 | 254 | 12709 | 65.6 | 890 | 870 | 180.5 |
| A | 2 | 250 | 11418 | 58.45 | 890 | 870 | 180.5 |
| B | 0 | 189 | 152208 | 895.65 | 889 | 866 | 169.0 |
| B | 0 | 197 | 39466 | 228.44 | 889 | 866 | 169.0 |
| B | 12 | 111 | 19915 | 112.73 | 889 | 866 | 169.0 |
| C | 0 | 239 | 144189 | 726.37 | 845 | 848 | 197.3 |
| C | 14 | 238 | 134154 | 675.52 | 845 | 848 | 197.3 |
| C | 10 | 9 | 21036 | 102.3 | 845 | 848 | 197.3 |
| D | 8 | 195 | 1028184 | 4937.87 | 850 | 821 | 208.1 |
| D | 1 | 52 | 485232 | 2328.25 | 850 | 821 | 208.1 |
| D | 12 | 218 | 367122 | 1760.57 | 850 | 821 | 208.1 |
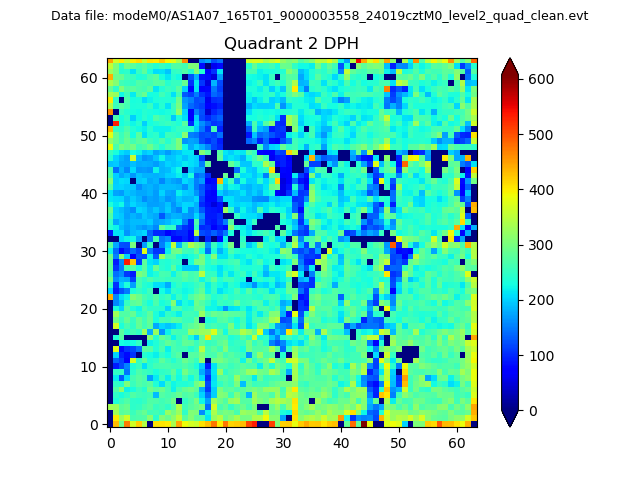
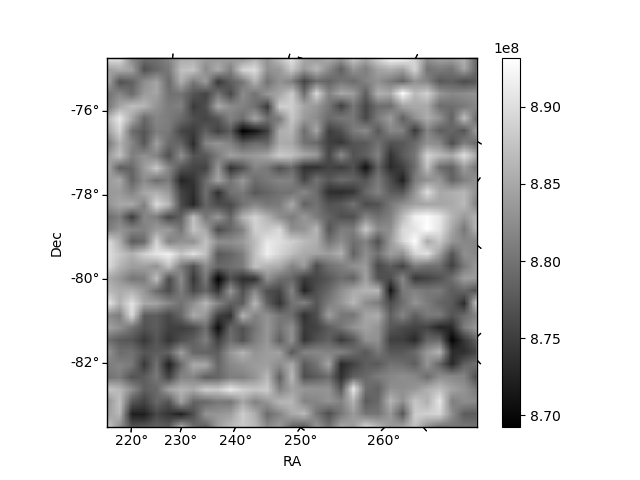
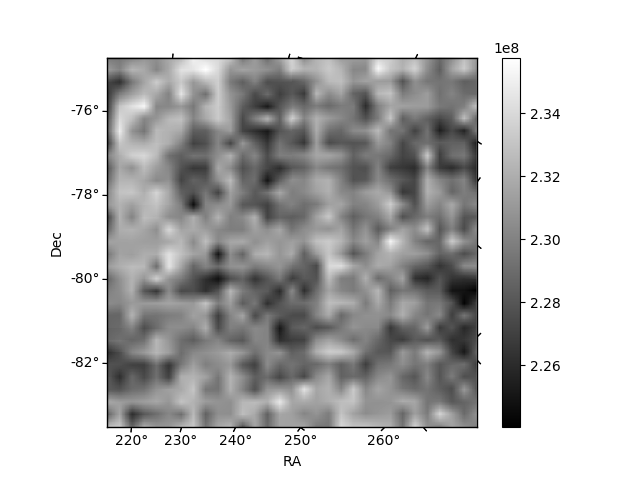
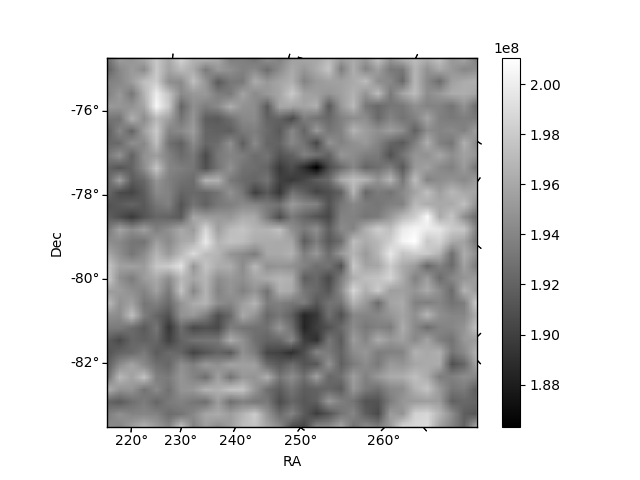
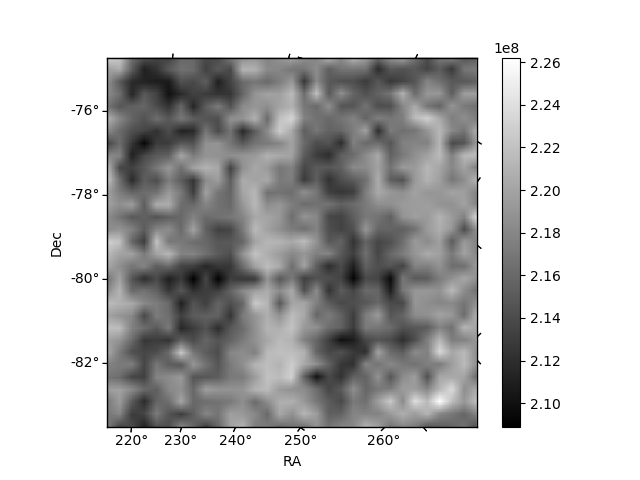
Histogram calculated using DETX and DETY for each event in the final _common_clean file
| Quadrant A | 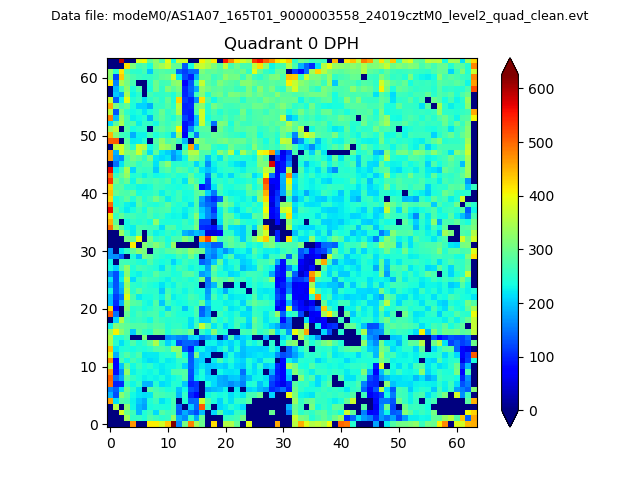 |
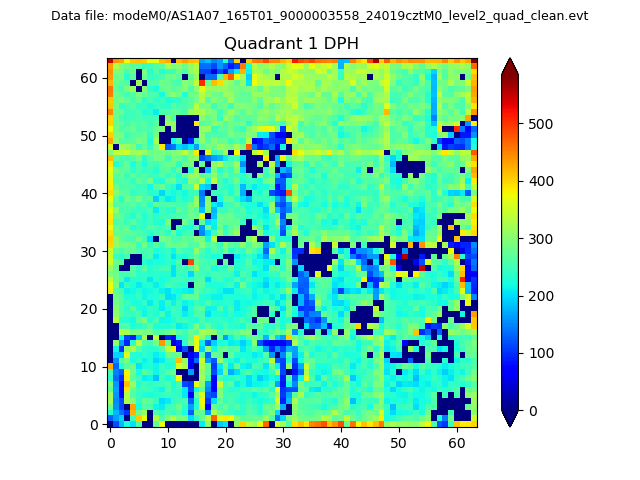 |
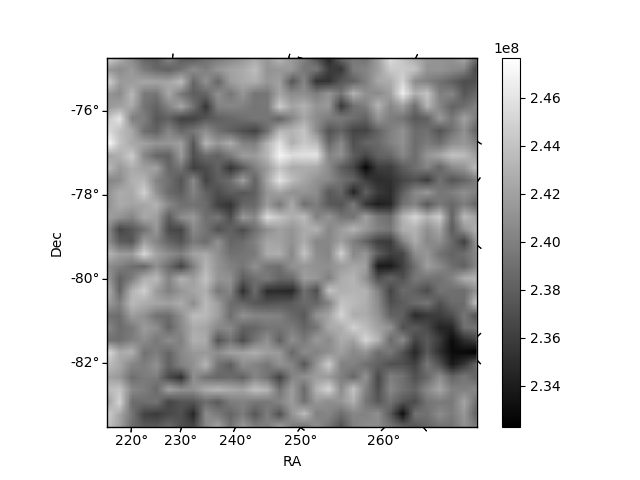
Quadrant B |
|---|---|---|---|
| Quadrant D | 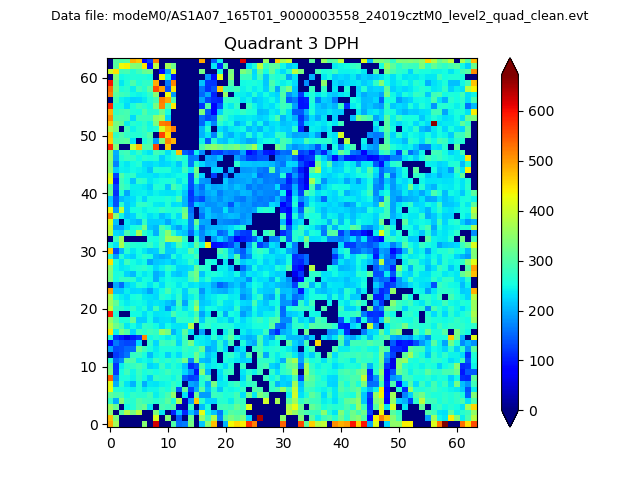 |
 |
Quadrant C |
| Plot type | Count rate plots | Images |
|---|---|---|
| Comparison with Poisson distribution Blue bars denote a histogram of data divided into 1 sec bins. Red curve is a Poisson curve with rate = median count rate of data. |
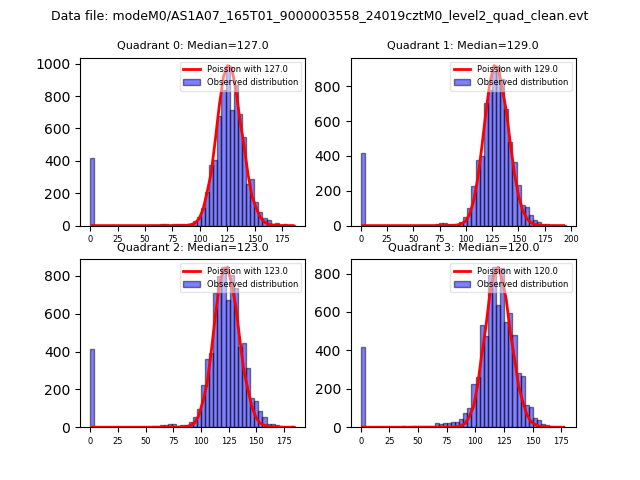 |
 |
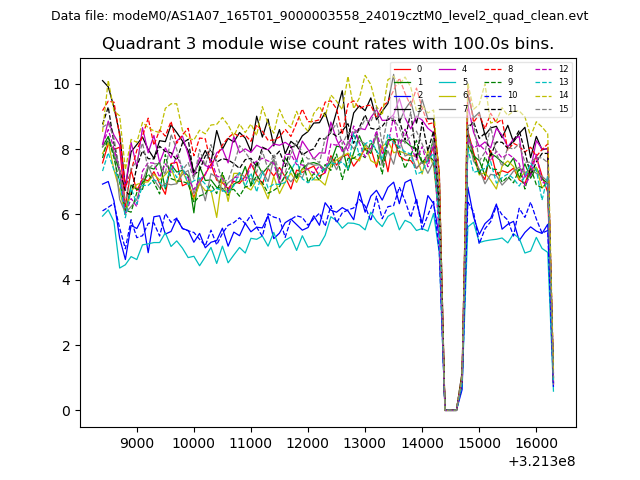
| Quadrant-wise count rates Data is divided into 100 sec bins |
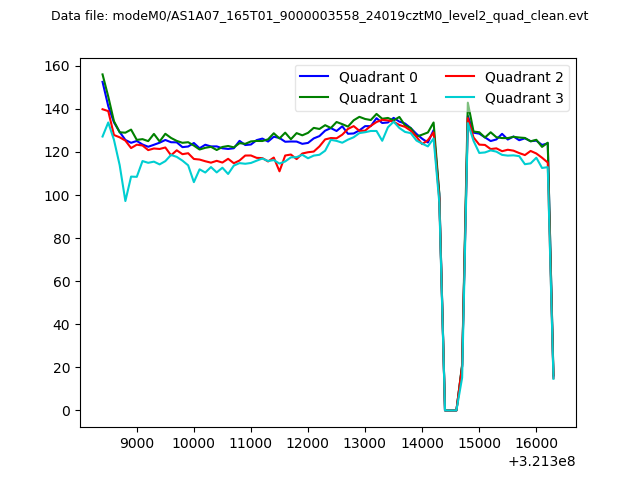 |
|
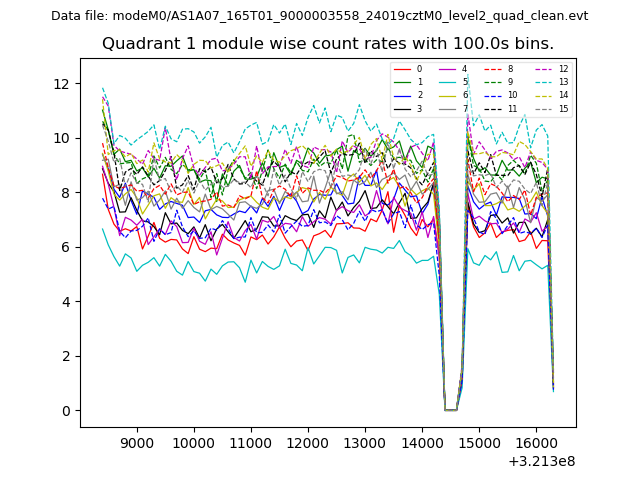
| Module-wise count rates for Quadrant A Data is divided into 100 sec bins |
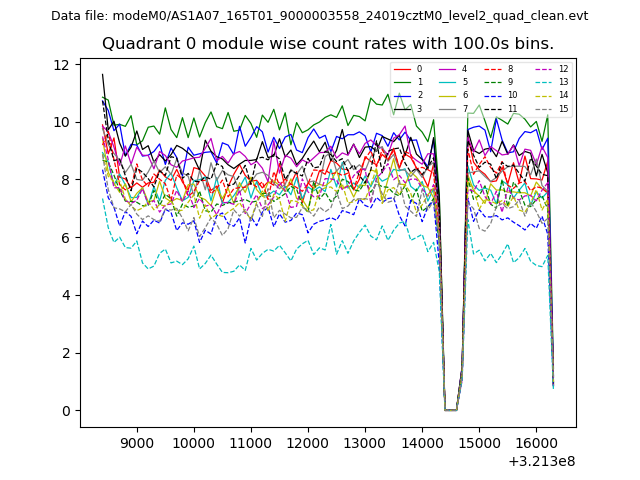 |
 |
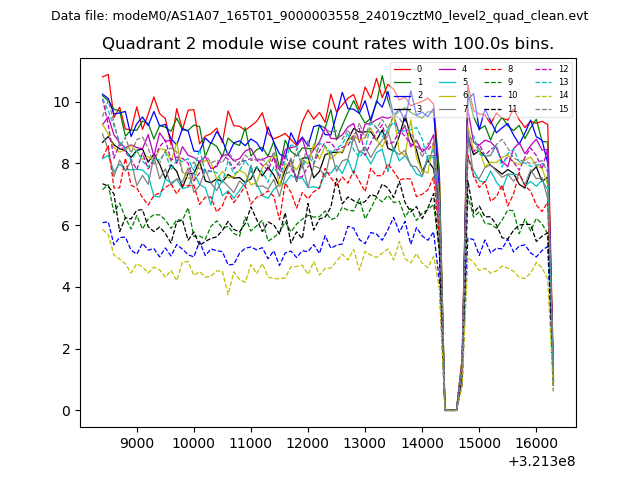
| Module-wise count rates for Quadrant B Data is divided into 100 sec bins |
 |
 |
| Module-wise count rates for Quadrant C Data is divided into 100 sec bins |
 |
 |
| Module-wise count rates for Quadrant D Data is divided into 100 sec bins |
 |
 |
| Parameter | Plot |
|---|---|
| CZT HV Monitor | 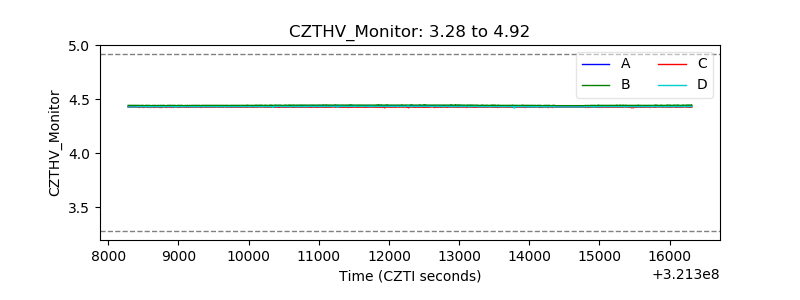 |
| D_VDD | 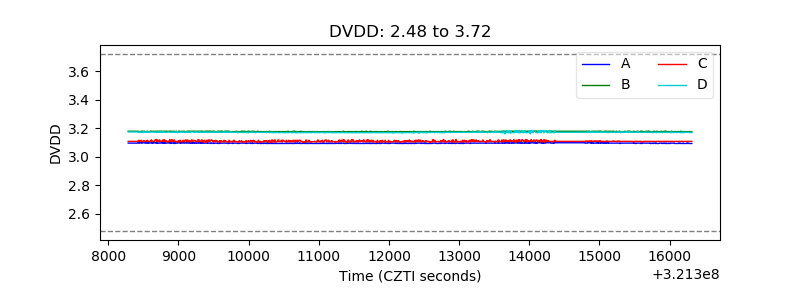 |
| Temperature 1 | 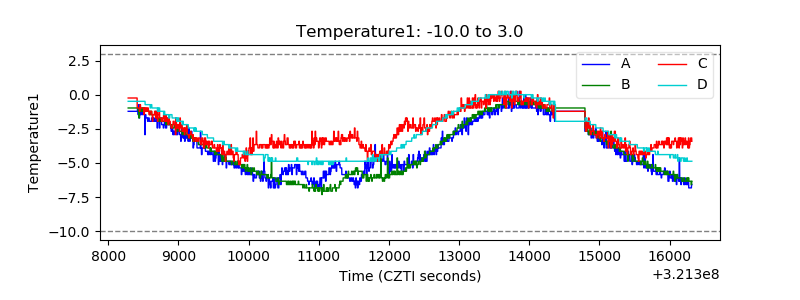 |
| Veto HV Monitor |  |
| Veto LLD | 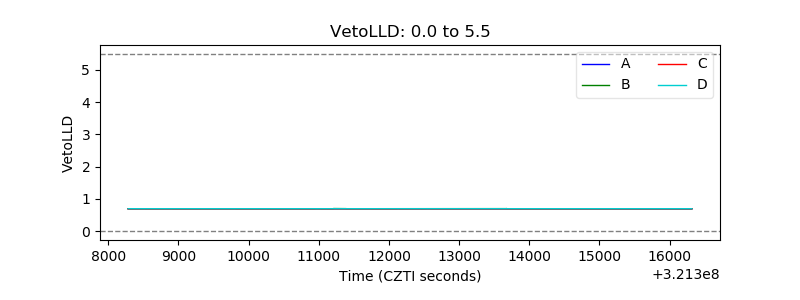 |
| Alpha Counter | 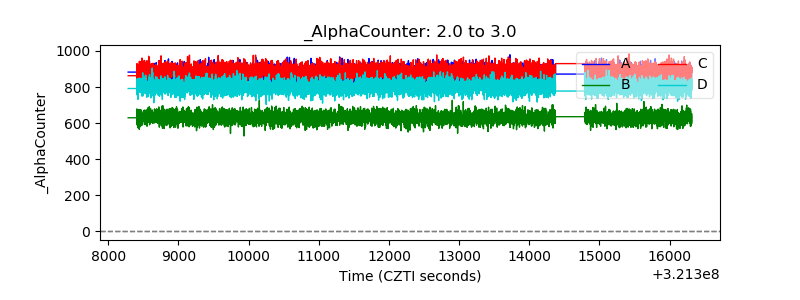 |
| _CPM_Rate | 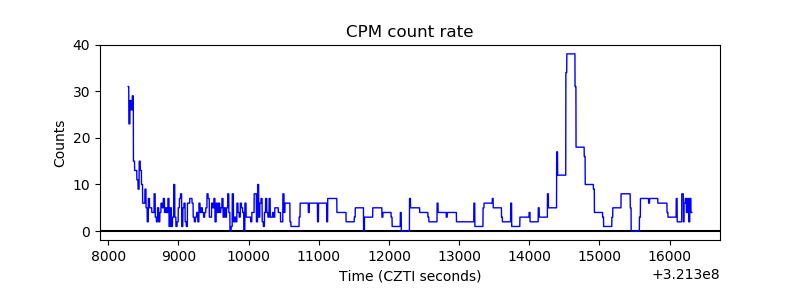 |
| CZT Counter | 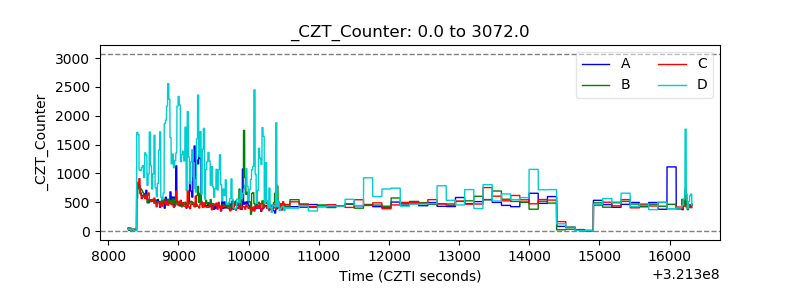 |
| +2.5 Volts monitor |  |
| +5 Volts monitor |  |
| _ROLL_ROT | 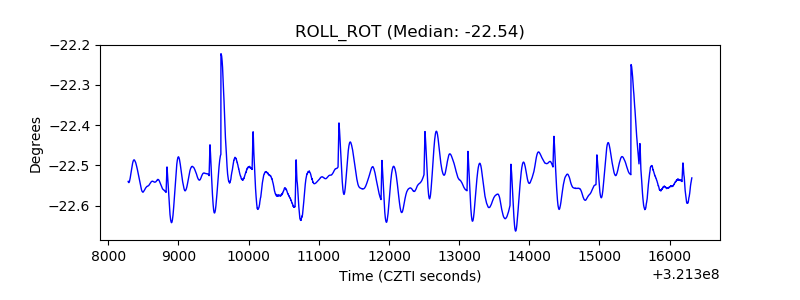 |
| _Roll_DEC | 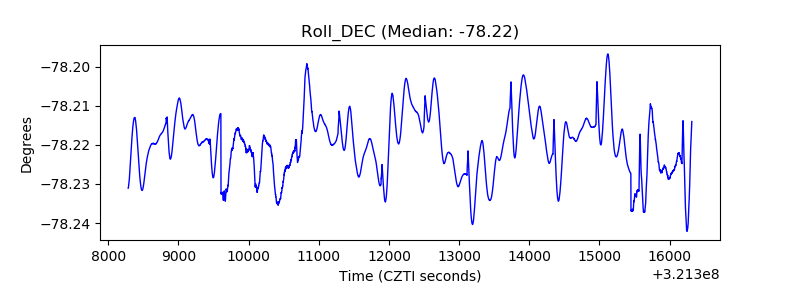 |
| _Roll_RA | 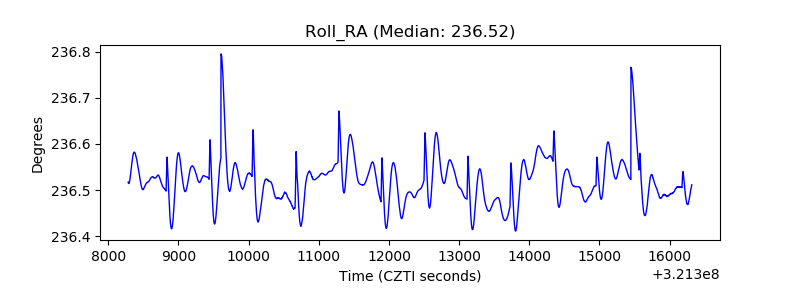 |
| Veto Counter | 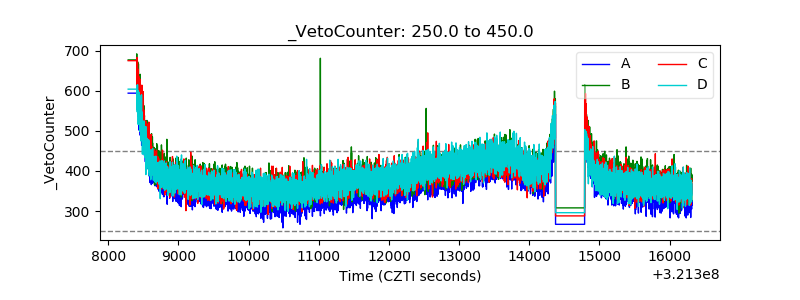 |