| Param | Original file | Final file |
|---|---|---|
| Filename | modeM0/AS1A07_165T01_9000003558_24025cztM0_level2.evt | modeM0/AS1A07_165T01_9000003558_24025cztM0_level2_quad_clean.evt |
| Size (bytes) | 464,008,320 | 136,105,920 |
| Size | 442.5 MB | 129.8 MB |
| Events in quadrant A | 3,214,806 | 927,969 |
| Events in quadrant B | 3,360,403 | 947,927 |
| Events in quadrant C | 3,323,346 | 908,854 |
| Events in quadrant D | 3,712,997 | 885,137 |
| Mode M9 | |||
|---|---|---|---|
| Quadrant | BADHDUFLAG | Total packets | Discarded packets |
| A | 0 | 11 | 0 |
| B | 0 | 11 | 0 |
| C | 0 | 11 | 0 |
| D | 0 | 11 | 0 |
| Mode M0 | |||
|---|---|---|---|
| Quadrant | BADHDUFLAG | Total packets | Discarded packets |
| A | 0 | 13632 | 2 |
| B | 0 | 14032 | 2 |
| C | 0 | 14046 | 2 |
| D | 0 | 15252 | 2 |
| Mode SS | |||
|---|---|---|---|
| Quadrant | BADHDUFLAG | Total packets | Discarded packets |
| A | 0 | 132 | 0 |
| B | 0 | 132 | 0 |
| C | 0 | 132 | 0 |
| D | 0 | 132 | 0 |
| Quadrant | Total seconds | Saturated seconds | Saturation percentage |
|---|---|---|---|
| A | 6491 | 29 | 0.446772% |
| B | 6492 | 43 | 0.662354% |
| C | 6492 | 86 | 1.324707% |
| D | 6492 | 57 | 0.878004% |
Noise dominated data is calculated using 1-second bins in cleaned event files. If a bin has >2000 counts, and if more than 50% of those come from <1% of pixels, then it is considered to be noise-dominated and hence unusable.
| Quadrant | # 1 sec bins | Bins with >0 counts | Bins with >2000 counts | High rate bins dominated by noise | Noise dominated (total time) | Noise dominated (detector-on time) | Marked lightcurve |
|---|---|---|---|---|---|---|---|
| A | 7596 | 6492 | 2 | 2 | 0.03% | 0.03% | 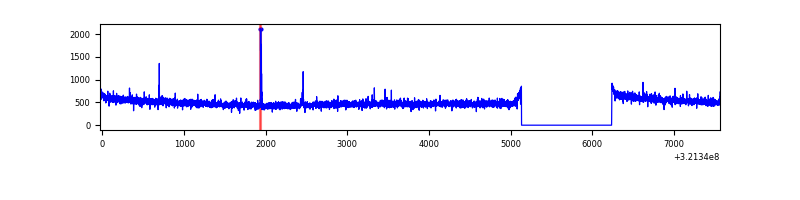 |
| B | 7597 | 6493 | 1 | 1 | 0.01% | 0.02% | 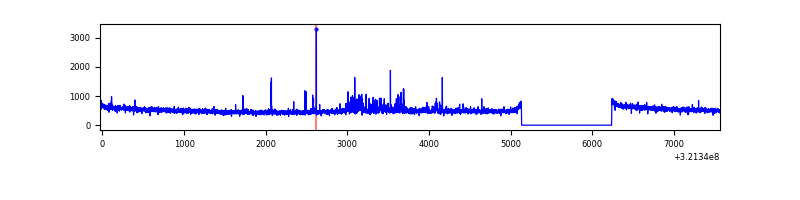 |
| C | 7597 | 6493 | 2 | 2 | 0.03% | 0.03% | 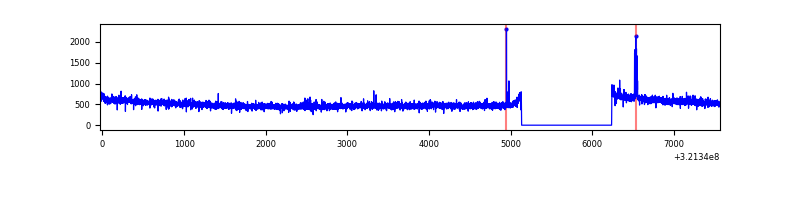 |
| D | 7597 | 6493 | 14 | 14 | 0.18% | 0.22% | 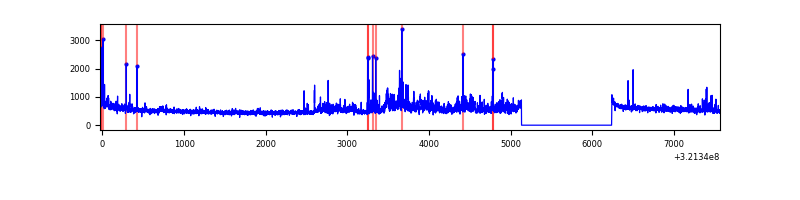 |
Top three noisy pixels from each quadrant. If the there are fewer than three noisy pixels in the level2.evt file, extra rows are filled as -1
| Pixel properties | Quadrant properties | ||||||
|---|---|---|---|---|---|---|---|
| Quadrant | DetID | PixID | Counts | Sigma | Mean | Median | Sigma |
| A | 6 | 16 | 32140 | 190.4 | 826 | 810 | 164.5 |
| A | 13 | 254 | 9585 | 53.33 | 826 | 810 | 164.5 |
| A | 0 | 226 | 7205 | 38.86 | 826 | 810 | 164.5 |
| B | 0 | 189 | 107728 | 693.12 | 824 | 804 | 154.3 |
| B | 12 | 111 | 17614 | 108.97 | 824 | 804 | 154.3 |
| B | 4 | 216 | 16315 | 100.55 | 824 | 804 | 154.3 |
| C | 14 | 238 | 129322 | 693.86 | 804 | 809 | 185.2 |
| C | 0 | 239 | 51093 | 271.49 | 804 | 809 | 185.2 |
| C | 13 | 61 | 5489 | 25.27 | 804 | 809 | 185.2 |
| D | 8 | 195 | 465286 | 2373.29 | 814 | 791 | 195.7 |
| D | 1 | 52 | 76444 | 386.54 | 814 | 791 | 195.7 |
| D | 2 | 234 | 29898 | 148.72 | 814 | 791 | 195.7 |
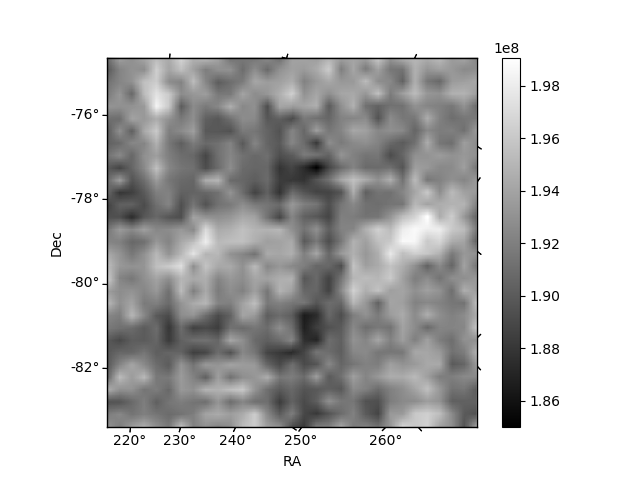
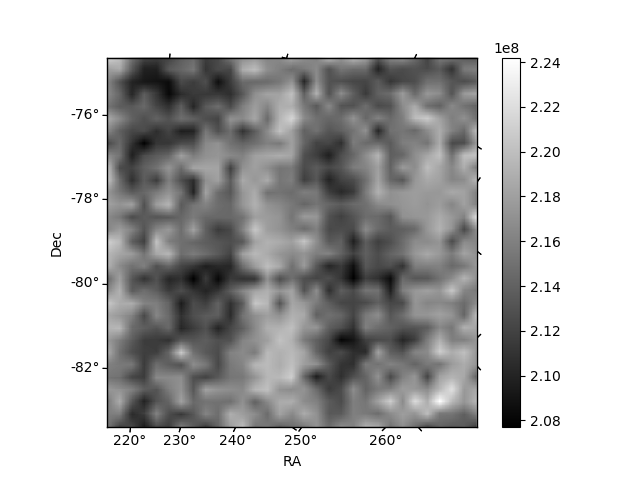
Histogram calculated using DETX and DETY for each event in the final _common_clean file
| Quadrant A |  |
 |
Quadrant B |
|---|---|---|---|
| Quadrant D |  |
 |
Quadrant C |
| Plot type | Count rate plots | Images |
|---|---|---|
| Comparison with Poisson distribution Blue bars denote a histogram of data divided into 1 sec bins. Red curve is a Poisson curve with rate = median count rate of data. |
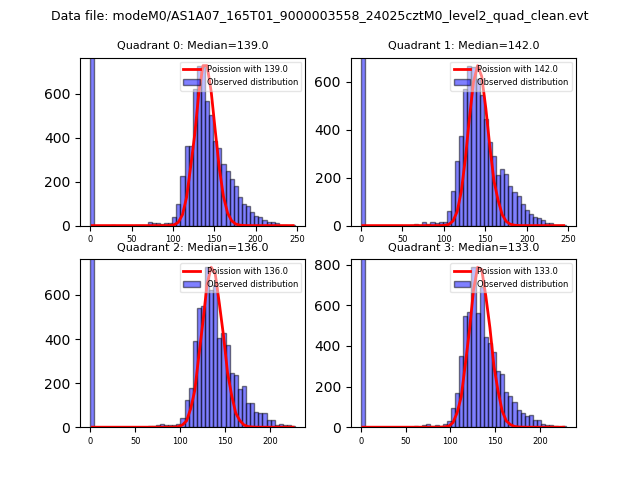 |
 |
| Quadrant-wise count rates Data is divided into 100 sec bins |
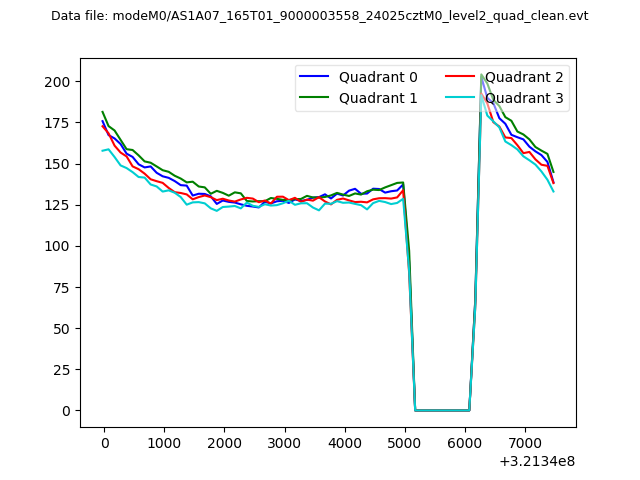 |
|
| Module-wise count rates for Quadrant A Data is divided into 100 sec bins |
 |
 |
| Module-wise count rates for Quadrant B Data is divided into 100 sec bins |
 |
 |
| Module-wise count rates for Quadrant C Data is divided into 100 sec bins |
 |
 |
| Module-wise count rates for Quadrant D Data is divided into 100 sec bins |
 |
 |
| Parameter | Plot |
|---|---|
| CZT HV Monitor |  |
| D_VDD | 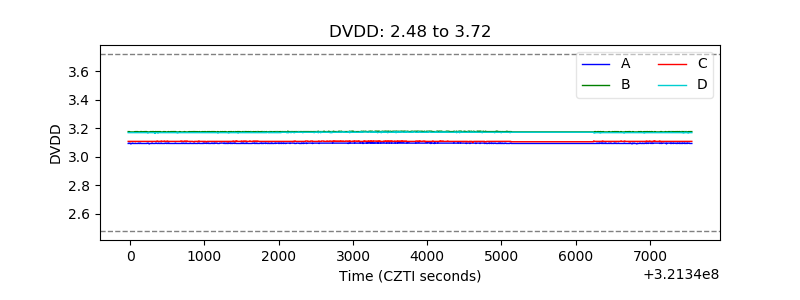 |
| Temperature 1 |  |
| Veto HV Monitor |  |
| Veto LLD |  |
| Alpha Counter | 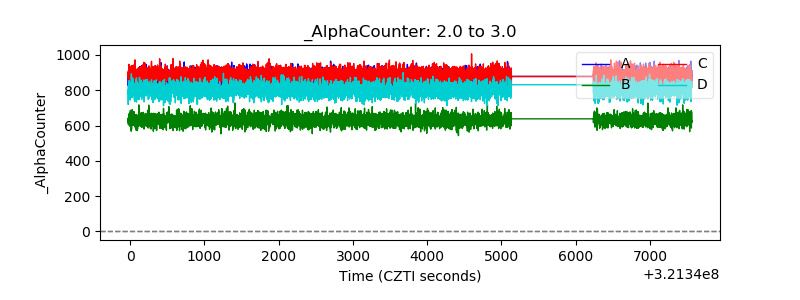 |
| _CPM_Rate | 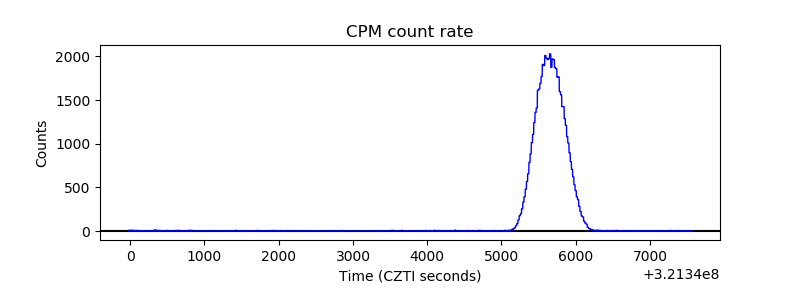 |
| CZT Counter |  |
| +2.5 Volts monitor |  |
| +5 Volts monitor |  |
| _ROLL_ROT |  |
| _Roll_DEC |  |
| _Roll_RA |  |
| Veto Counter |  |