| Param | Original file | Final file |
|---|---|---|
| Filename | modeM0/AS1A07_165T01_9000003558_24026cztM0_level2.evt | modeM0/AS1A07_165T01_9000003558_24026cztM0_level2_quad_clean.evt |
| Size (bytes) | 477,984,960 | 142,784,640 |
| Size | 455.8 MB | 136.2 MB |
| Events in quadrant A | 3,322,614 | 984,264 |
| Events in quadrant B | 3,625,381 | 995,821 |
| Events in quadrant C | 3,479,647 | 958,943 |
| Events in quadrant D | 3,614,975 | 940,575 |
| Mode M9 | |||
|---|---|---|---|
| Quadrant | BADHDUFLAG | Total packets | Discarded packets |
| A | 0 | 17 | 0 |
| B | 0 | 18 | 0 |
| C | 0 | 18 | 0 |
| D | 0 | 18 | 0 |
| Mode M0 | |||
|---|---|---|---|
| Quadrant | BADHDUFLAG | Total packets | Discarded packets |
| A | 0 | 13921 | 2 |
| B | 0 | 14648 | 2 |
| C | 0 | 14472 | 2 |
| D | 0 | 14751 | 2 |
| Mode SS | |||
|---|---|---|---|
| Quadrant | BADHDUFLAG | Total packets | Discarded packets |
| A | 0 | 128 | 0 |
| B | 0 | 128 | 0 |
| C | 0 | 128 | 0 |
| D | 0 | 128 | 0 |
| Quadrant | Total seconds | Saturated seconds | Saturation percentage |
|---|---|---|---|
| A | 6389 | 22 | 0.344342% |
| B | 6389 | 111 | 1.737361% |
| C | 6389 | 92 | 1.439975% |
| D | 6389 | 34 | 0.532165% |
Noise dominated data is calculated using 1-second bins in cleaned event files. If a bin has >2000 counts, and if more than 50% of those come from <1% of pixels, then it is considered to be noise-dominated and hence unusable.
| Quadrant | # 1 sec bins | Bins with >0 counts | Bins with >2000 counts | High rate bins dominated by noise | Noise dominated (total time) | Noise dominated (detector-on time) | Marked lightcurve |
|---|---|---|---|---|---|---|---|
| A | 7614 | 6390 | 0 | 0 | 0.00% | 0.00% | 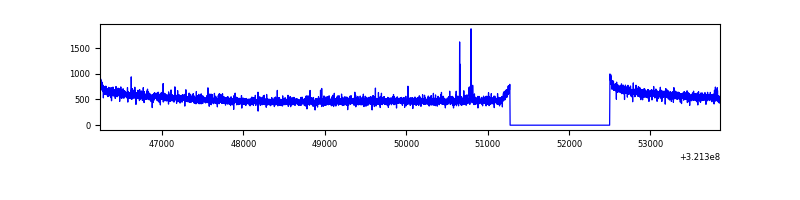 |
| B | 7614 | 6390 | 42 | 42 | 0.55% | 0.66% | 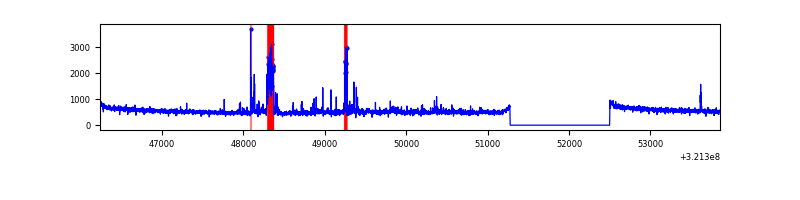 |
| C | 7614 | 6390 | 4 | 4 | 0.05% | 0.06% | 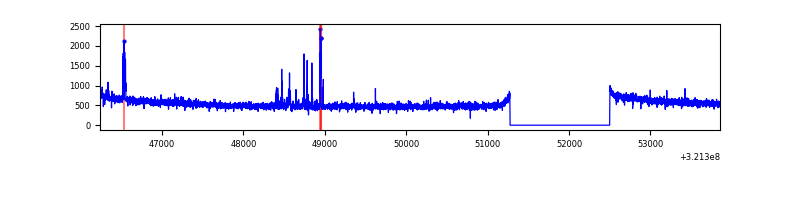 |
| D | 7614 | 6390 | 8 | 8 | 0.11% | 0.13% | 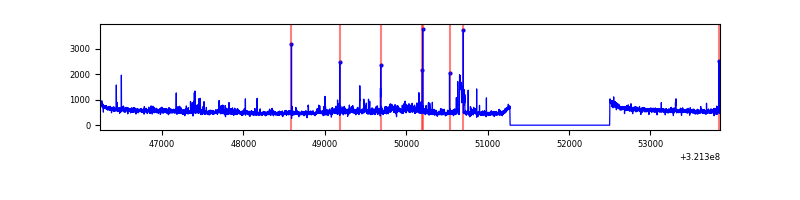 |
Top three noisy pixels from each quadrant. If the there are fewer than three noisy pixels in the level2.evt file, extra rows are filled as -1
| Pixel properties | Quadrant properties | ||||||
|---|---|---|---|---|---|---|---|
| Quadrant | DetID | PixID | Counts | Sigma | Mean | Median | Sigma |
| A | 6 | 16 | 18938 | 107.11 | 854 | 838 | 169.0 |
| A | 13 | 254 | 8747 | 46.8 | 854 | 838 | 169.0 |
| A | 3 | 1 | 7952 | 42.1 | 854 | 838 | 169.0 |
| B | 0 | 197 | 236342 | 1519.01 | 844 | 825 | 155.0 |
| B | 0 | 245 | 21279 | 131.92 | 844 | 825 | 155.0 |
| B | 0 | 189 | 19091 | 117.81 | 844 | 825 | 155.0 |
| C | 14 | 238 | 133897 | 704.36 | 825 | 830 | 188.9 |
| C | 0 | 239 | 119196 | 626.55 | 825 | 830 | 188.9 |
| C | 7 | 247 | 11851 | 58.34 | 825 | 830 | 188.9 |
| D | 8 | 195 | 256189 | 1274.15 | 840 | 819 | 200.4 |
| D | 1 | 52 | 81922 | 404.66 | 840 | 819 | 200.4 |
| D | 2 | 82 | 64092 | 315.7 | 840 | 819 | 200.4 |
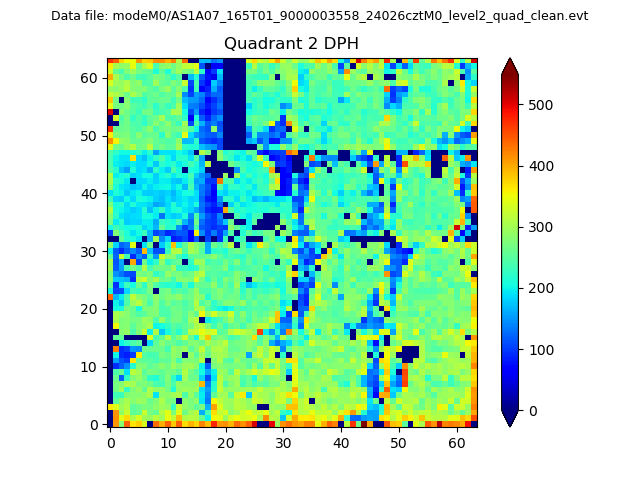
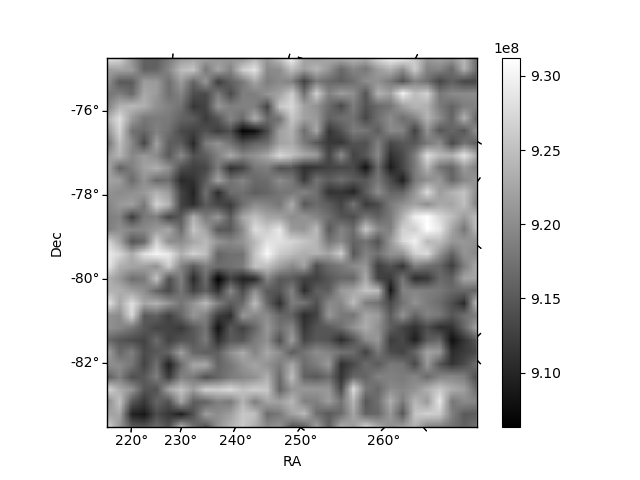
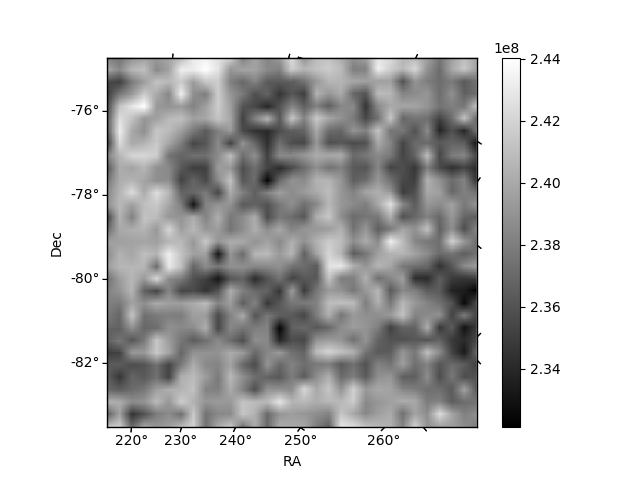
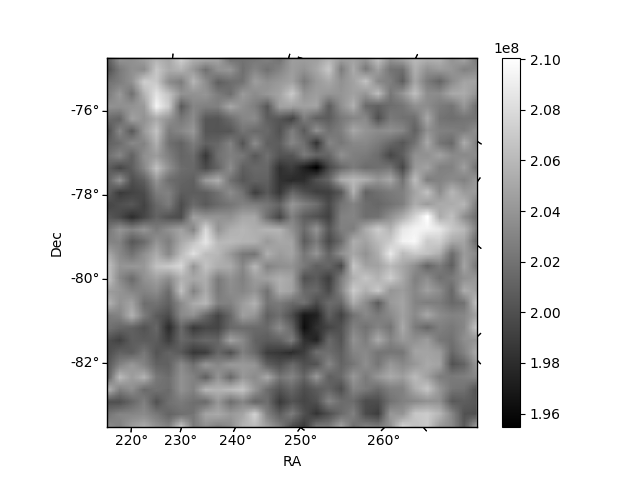
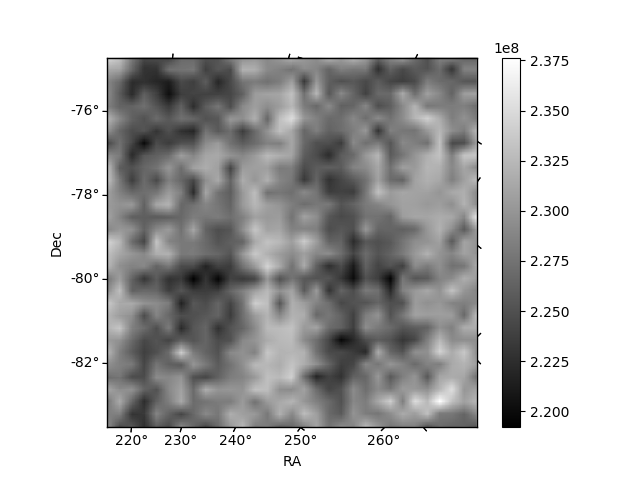
Histogram calculated using DETX and DETY for each event in the final _common_clean file
| Quadrant A | 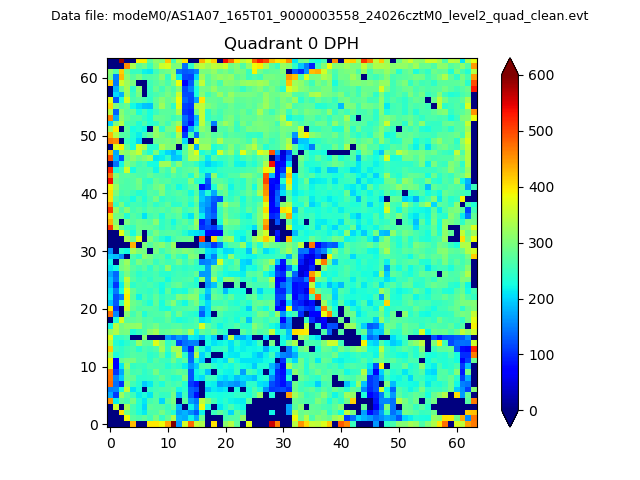 |
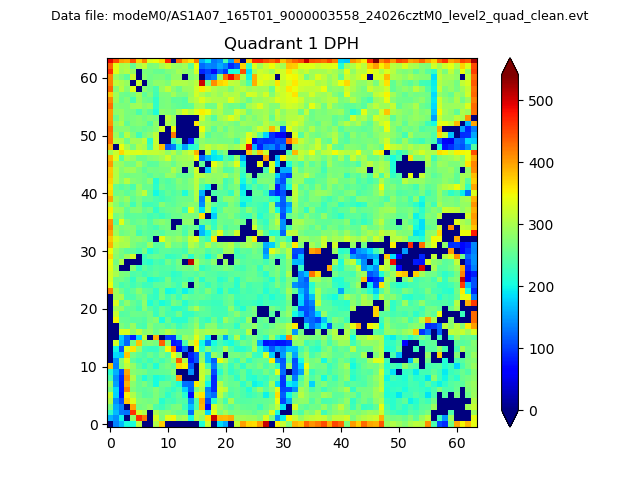 |
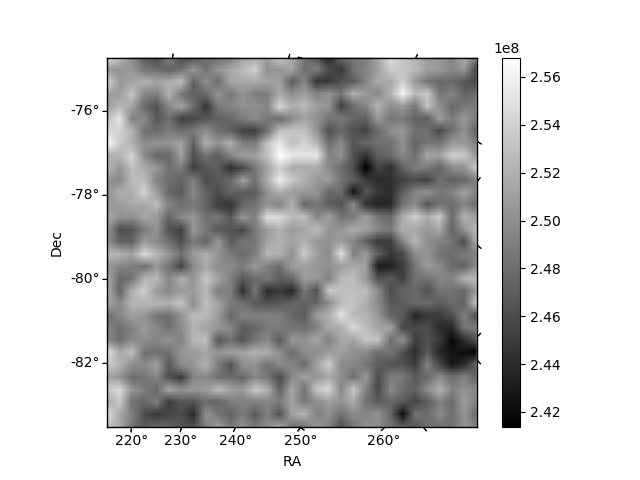
Quadrant B |
|---|---|---|---|
| Quadrant D | 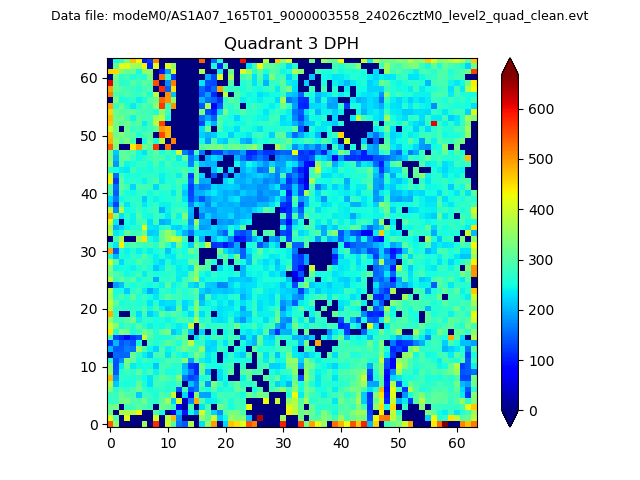 |
 |
Quadrant C |
| Plot type | Count rate plots | Images |
|---|---|---|
| Comparison with Poisson distribution Blue bars denote a histogram of data divided into 1 sec bins. Red curve is a Poisson curve with rate = median count rate of data. |
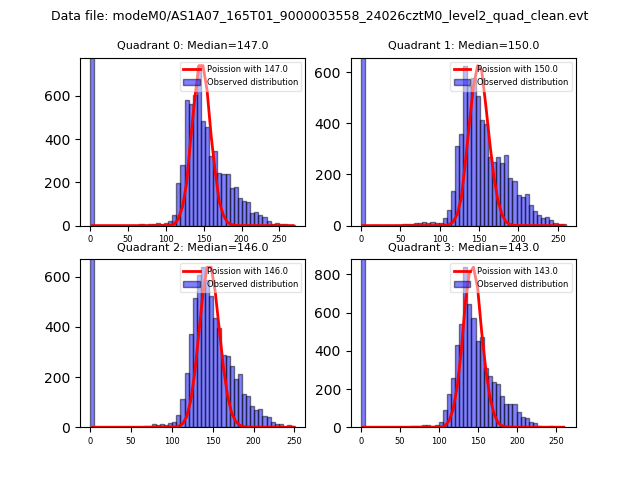 |
 |
| Quadrant-wise count rates Data is divided into 100 sec bins |
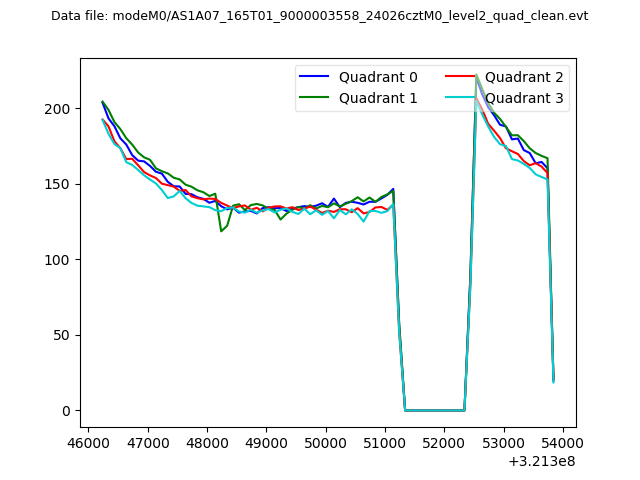 |
|
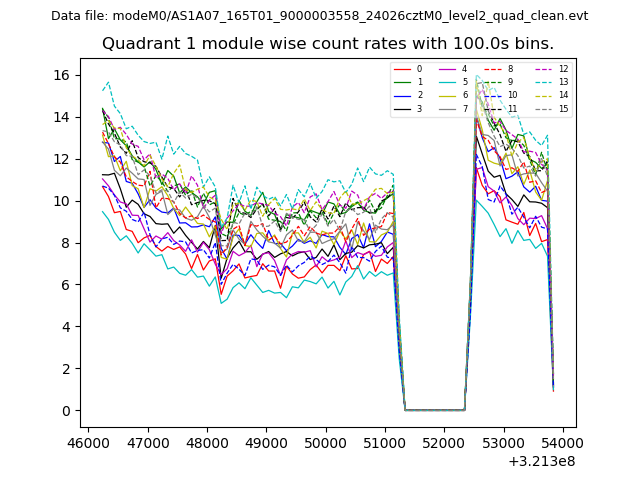
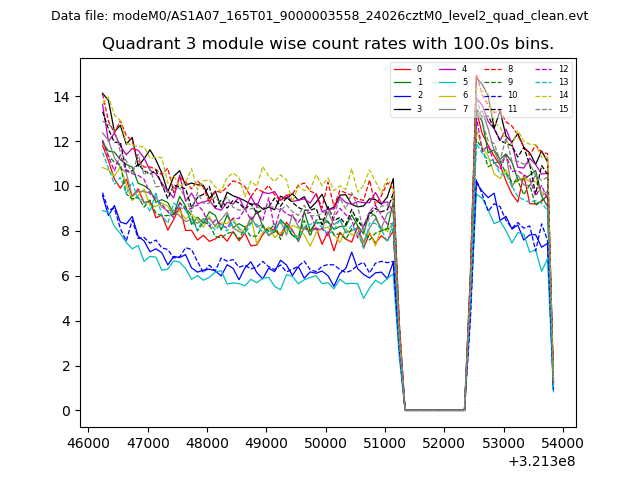
| Module-wise count rates for Quadrant A Data is divided into 100 sec bins |
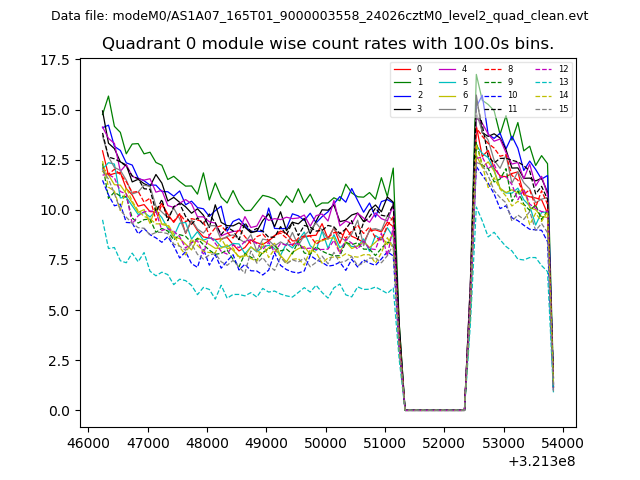 |
 |
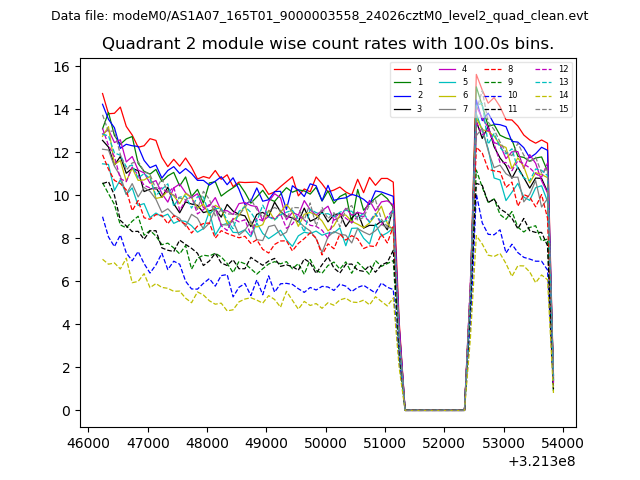
| Module-wise count rates for Quadrant B Data is divided into 100 sec bins |
 |
 |
| Module-wise count rates for Quadrant C Data is divided into 100 sec bins |
 |
 |
| Module-wise count rates for Quadrant D Data is divided into 100 sec bins |
 |
 |
| Parameter | Plot |
|---|---|
| CZT HV Monitor | 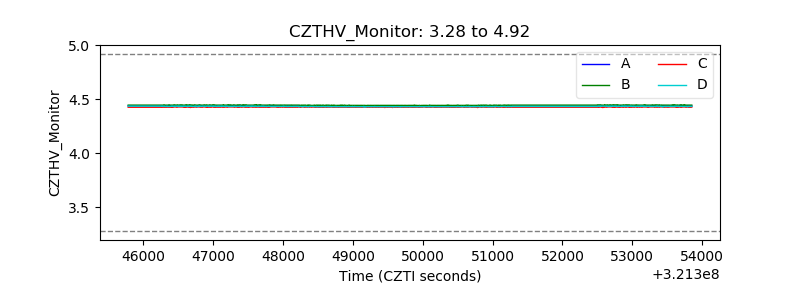 |
| D_VDD | 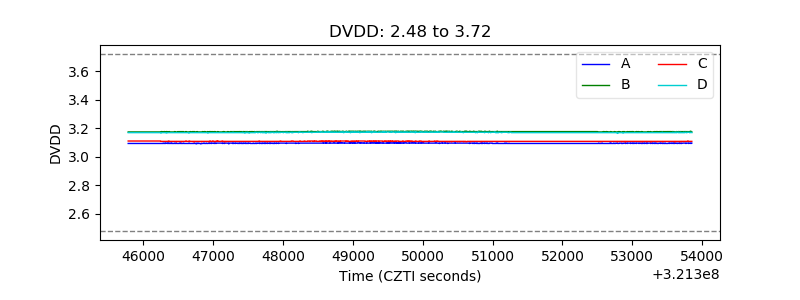 |
| Temperature 1 | 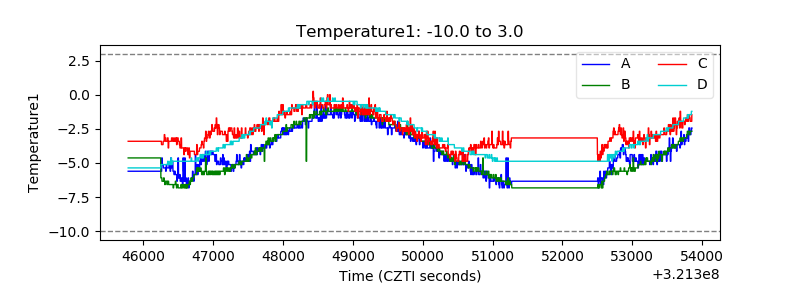 |
| Veto HV Monitor | 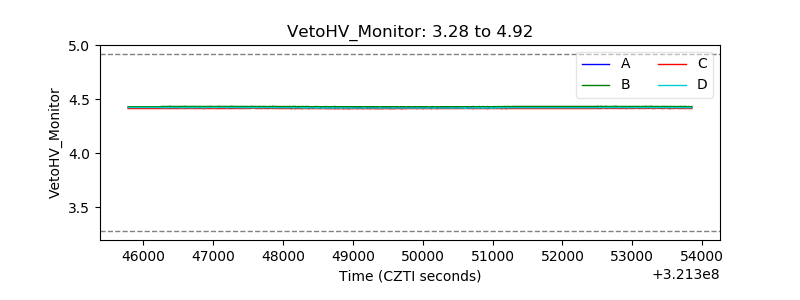 |
| Veto LLD | 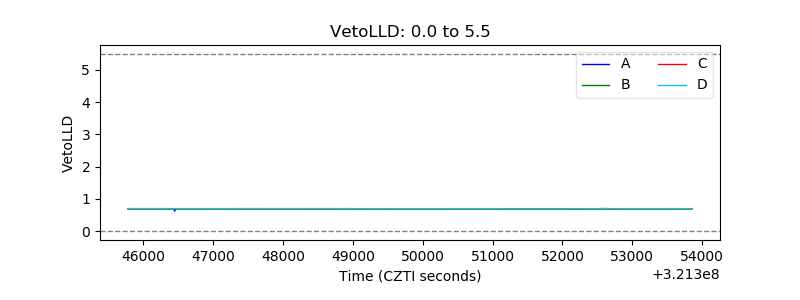 |
| Alpha Counter | 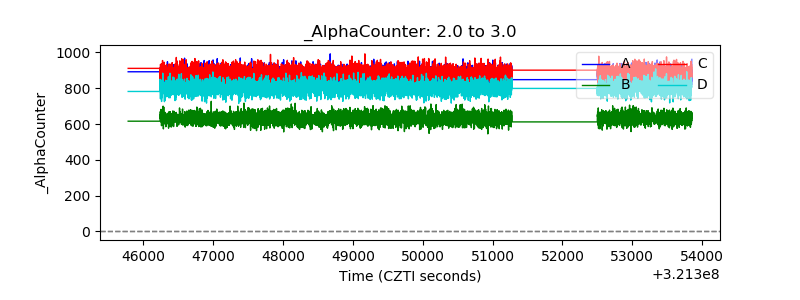 |
| _CPM_Rate |  |
| CZT Counter | 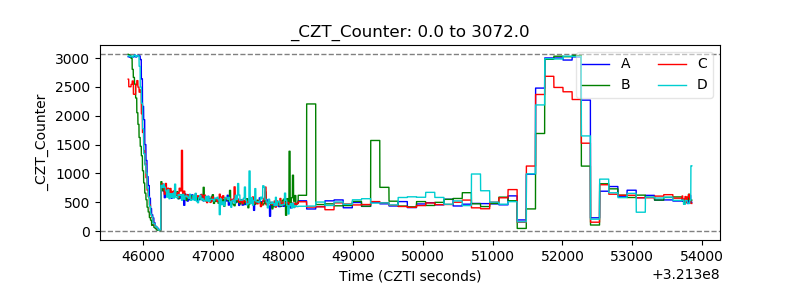 |
| +2.5 Volts monitor |  |
| +5 Volts monitor |  |
| _ROLL_ROT | 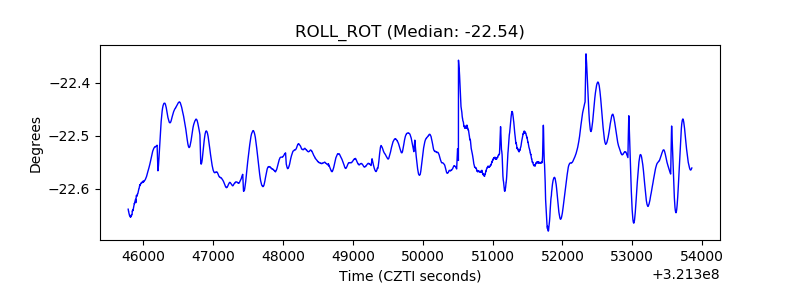 |
| _Roll_DEC | 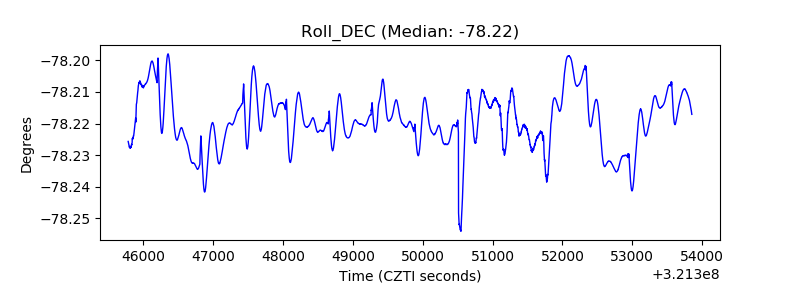 |
| _Roll_RA | 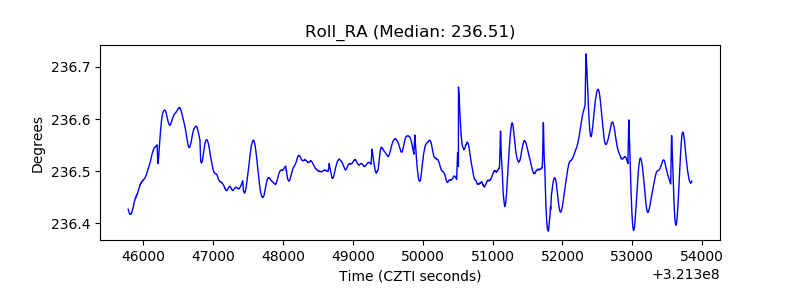 |
| Veto Counter | 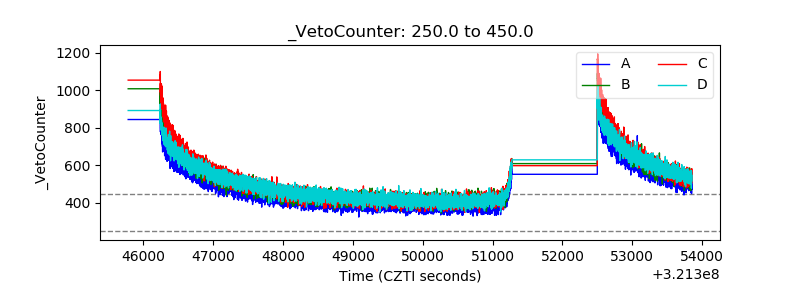 |