| Param | Original file | Final file |
|---|---|---|
| Filename | modeM0/AS1A07_165T01_9000003558_24027cztM0_level2.evt | modeM0/AS1A07_165T01_9000003558_24027cztM0_level2_quad_clean.evt |
| Size (bytes) | 443,666,880 | 137,975,040 |
| Size | 423.1 MB | 131.6 MB |
| Events in quadrant A | 3,165,886 | 957,808 |
| Events in quadrant B | 3,261,053 | 972,470 |
| Events in quadrant C | 3,304,962 | 922,388 |
| Events in quadrant D | 3,298,168 | 908,692 |
| Mode M9 | |||
|---|---|---|---|
| Quadrant | BADHDUFLAG | Total packets | Discarded packets |
| A | 0 | 13 | 0 |
| B | 0 | 13 | 0 |
| C | 0 | 13 | 0 |
| D | 0 | 13 | 0 |
| Mode M0 | |||
|---|---|---|---|
| Quadrant | BADHDUFLAG | Total packets | Discarded packets |
| A | 0 | 13150 | 1 |
| B | 0 | 13351 | 1 |
| C | 0 | 13634 | 6 |
| D | 0 | 13511 | 1 |
| Mode SS | |||
|---|---|---|---|
| Quadrant | BADHDUFLAG | Total packets | Discarded packets |
| A | 0 | 122 | 0 |
| B | 0 | 122 | 0 |
| C | 0 | 122 | 0 |
| D | 0 | 122 | 0 |
| Quadrant | Total seconds | Saturated seconds | Saturation percentage |
|---|---|---|---|
| A | 5981 | 52 | 0.869420% |
| B | 5982 | 45 | 0.752257% |
| C | 5981 | 131 | 2.190269% |
| D | 5981 | 61 | 1.019896% |
Noise dominated data is calculated using 1-second bins in cleaned event files. If a bin has >2000 counts, and if more than 50% of those come from <1% of pixels, then it is considered to be noise-dominated and hence unusable.
| Quadrant | # 1 sec bins | Bins with >0 counts | Bins with >2000 counts | High rate bins dominated by noise | Noise dominated (total time) | Noise dominated (detector-on time) | Marked lightcurve |
|---|---|---|---|---|---|---|---|
| A | 7261 | 5982 | 0 | 0 | 0.00% | 0.00% | 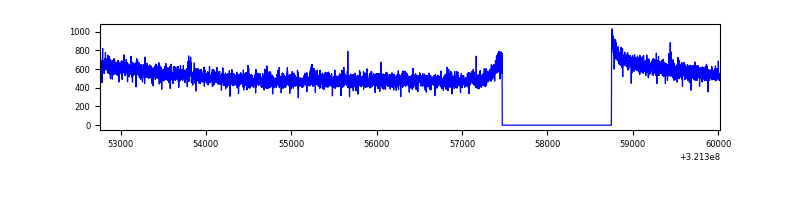 |
| B | 7262 | 5983 | 1 | 1 | 0.01% | 0.02% | 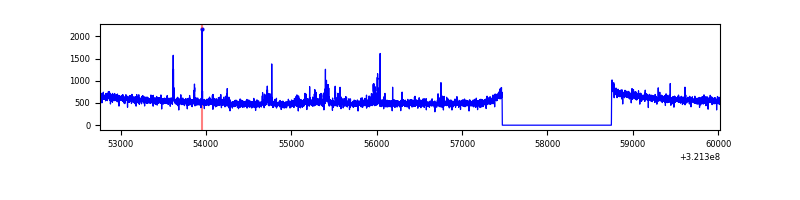 |
| C | 7261 | 5982 | 27 | 27 | 0.37% | 0.45% | 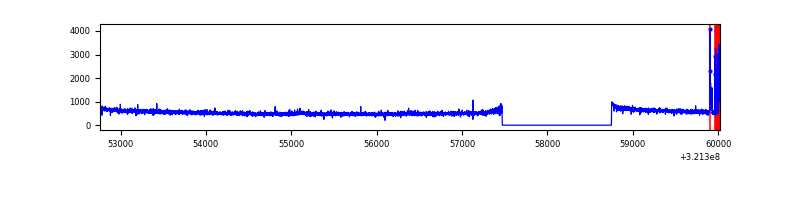 |
| D | 7261 | 5982 | 16 | 16 | 0.22% | 0.27% | 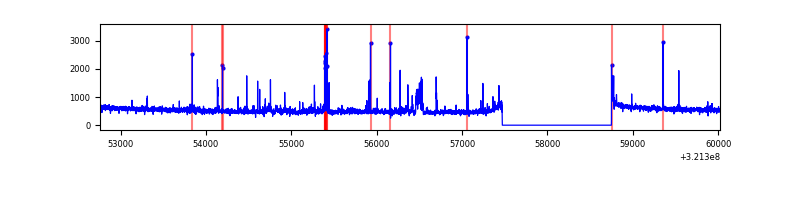 |
Top three noisy pixels from each quadrant. If the there are fewer than three noisy pixels in the level2.evt file, extra rows are filled as -1
| Pixel properties | Quadrant properties | ||||||
|---|---|---|---|---|---|---|---|
| Quadrant | DetID | PixID | Counts | Sigma | Mean | Median | Sigma |
| A | 3 | 1 | 9613 | 54.65 | 818 | 804 | 161.2 |
| A | 13 | 254 | 9095 | 51.44 | 818 | 804 | 161.2 |
| A | 0 | 226 | 7234 | 39.89 | 818 | 804 | 161.2 |
| B | 0 | 228 | 48234 | 319.41 | 807 | 790 | 148.5 |
| B | 0 | 189 | 20227 | 130.86 | 807 | 790 | 148.5 |
| B | 12 | 111 | 16230 | 103.95 | 807 | 790 | 148.5 |
| C | 14 | 238 | 127492 | 716.51 | 778 | 786 | 176.8 |
| C | 0 | 239 | 111523 | 626.2 | 778 | 786 | 176.8 |
| C | 7 | 247 | 27796 | 152.74 | 778 | 786 | 176.8 |
| D | 8 | 195 | 72958 | 378.33 | 799 | 778 | 190.8 |
| D | 1 | 52 | 67191 | 348.1 | 799 | 778 | 190.8 |
| D | 13 | 61 | 28612 | 145.89 | 799 | 778 | 190.8 |
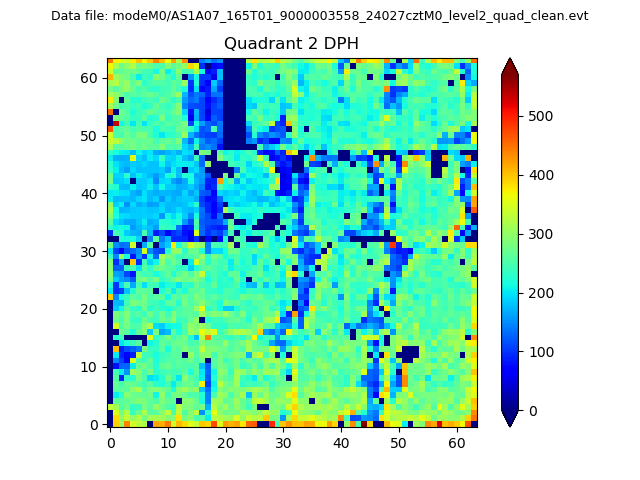
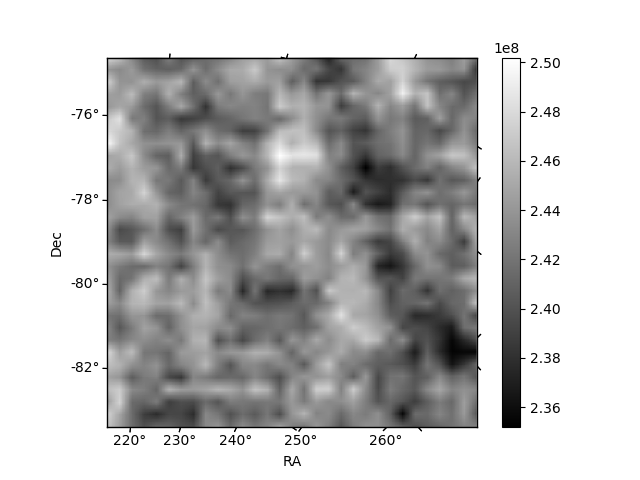
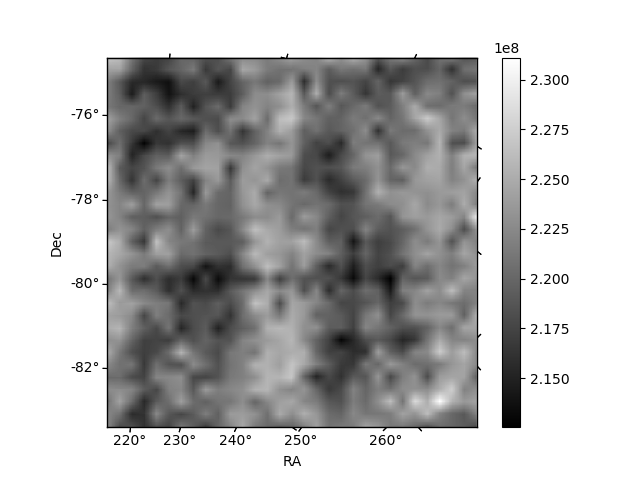
Histogram calculated using DETX and DETY for each event in the final _common_clean file
| Quadrant A | 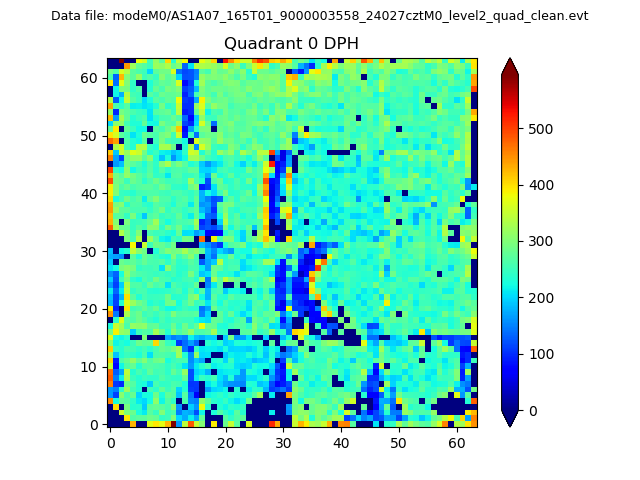 |
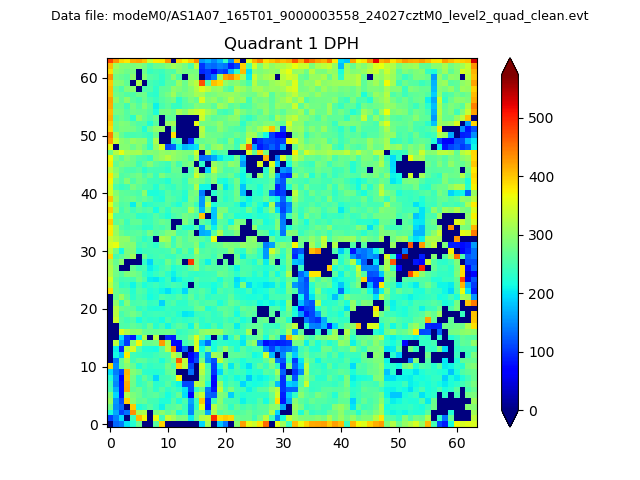 |
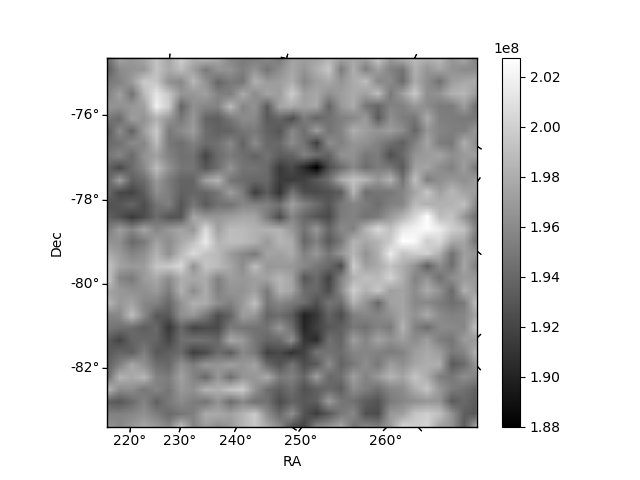
Quadrant B |
|---|---|---|---|
| Quadrant D | 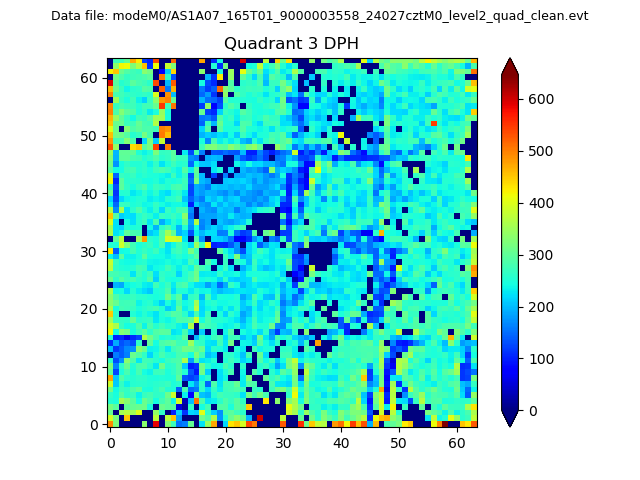 |
 |
Quadrant C |
| Plot type | Count rate plots | Images |
|---|---|---|
| Comparison with Poisson distribution Blue bars denote a histogram of data divided into 1 sec bins. Red curve is a Poisson curve with rate = median count rate of data. |
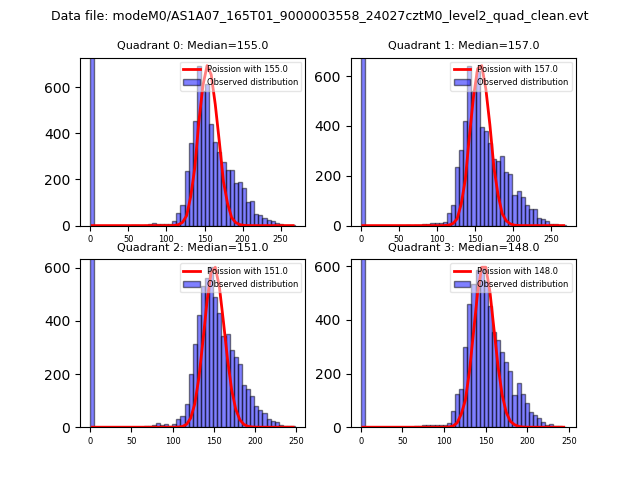 |
 |
| Quadrant-wise count rates Data is divided into 100 sec bins |
 |
|
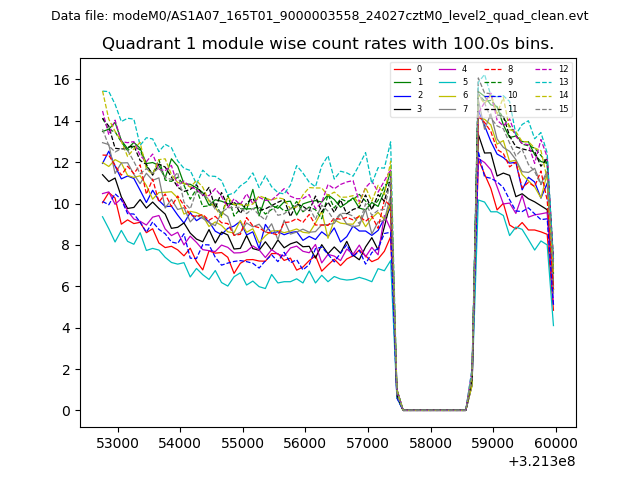
| Module-wise count rates for Quadrant A Data is divided into 100 sec bins |
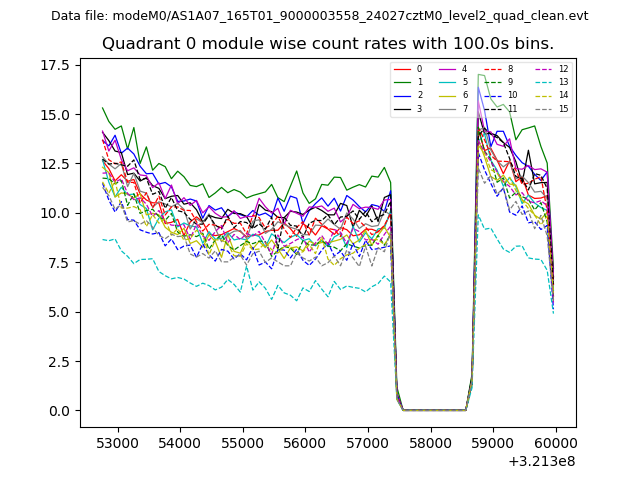 |
 |
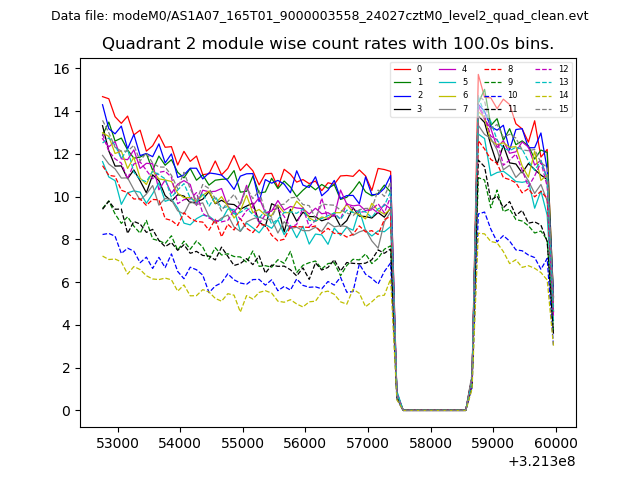
| Module-wise count rates for Quadrant B Data is divided into 100 sec bins |
 |
 |
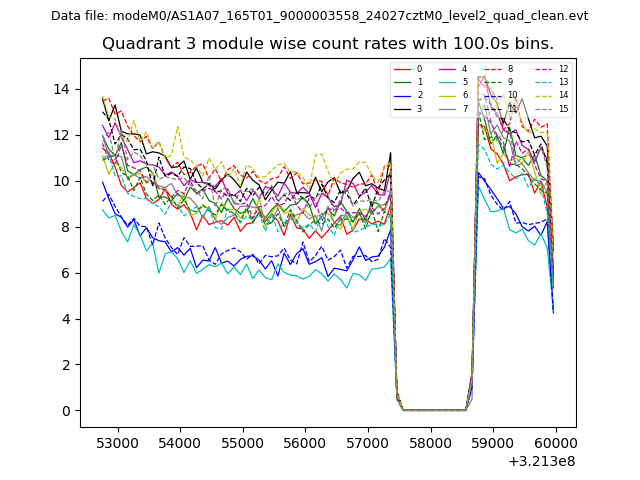
| Module-wise count rates for Quadrant C Data is divided into 100 sec bins |
 |
 |
| Module-wise count rates for Quadrant D Data is divided into 100 sec bins |
 |
 |
| Parameter | Plot |
|---|---|
| CZT HV Monitor | 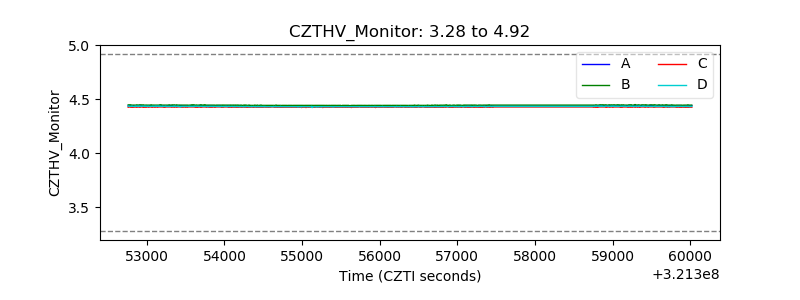 |
| D_VDD | 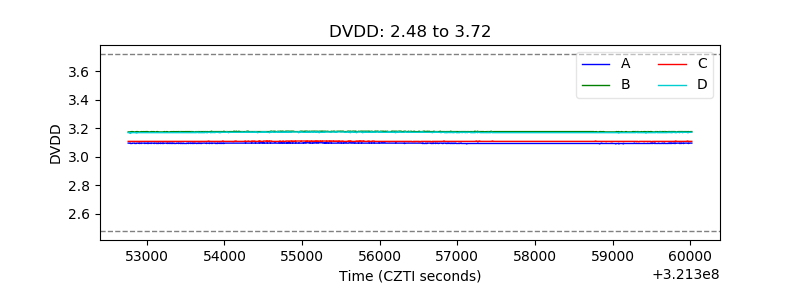 |
| Temperature 1 | 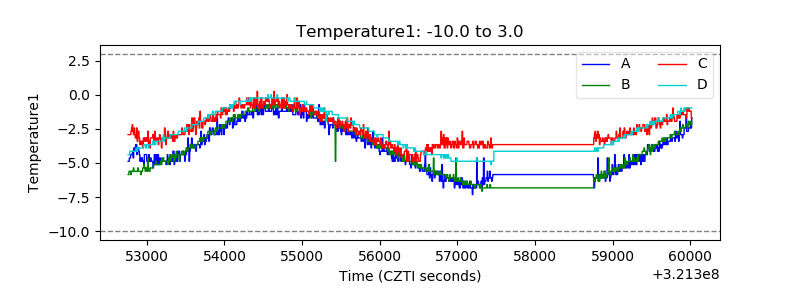 |
| Veto HV Monitor |  |
| Veto LLD | 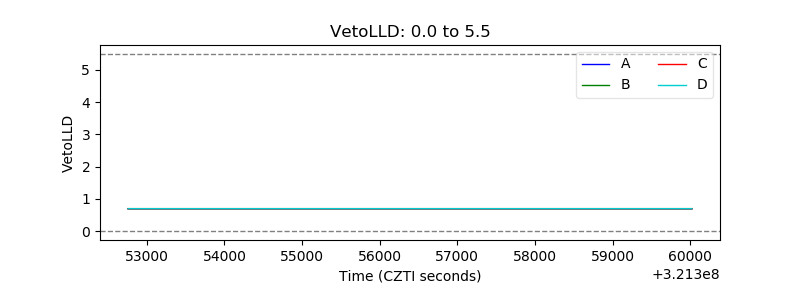 |
| Alpha Counter | 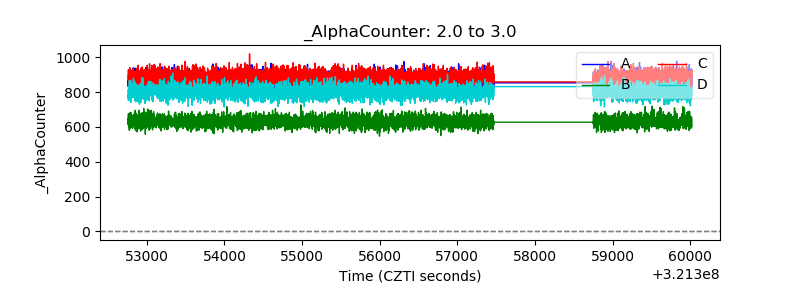 |
| _CPM_Rate | 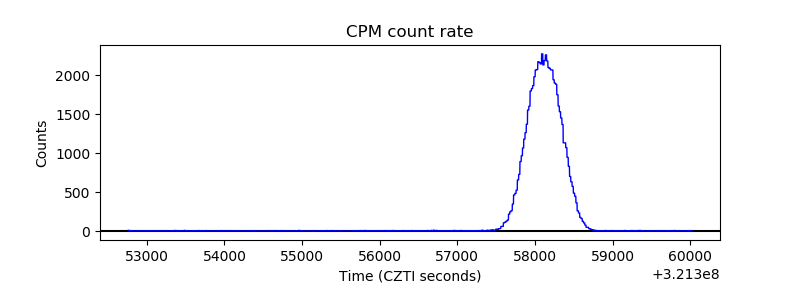 |
| CZT Counter | 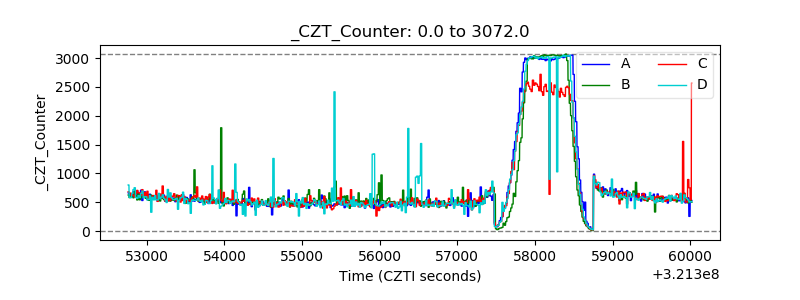 |
| +2.5 Volts monitor |  |
| +5 Volts monitor |  |
| _ROLL_ROT | 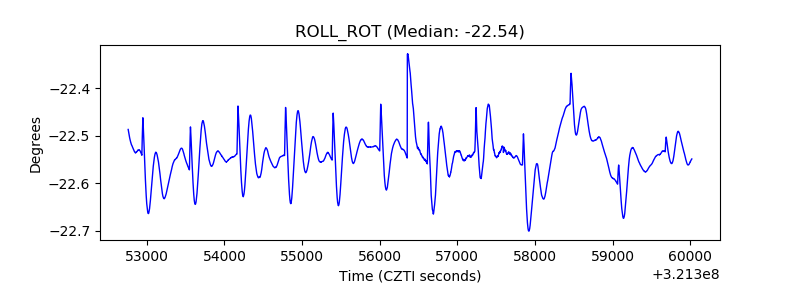 |
| _Roll_DEC | 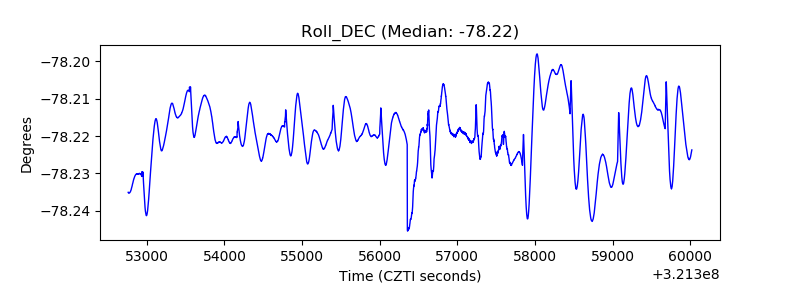 |
| _Roll_RA | 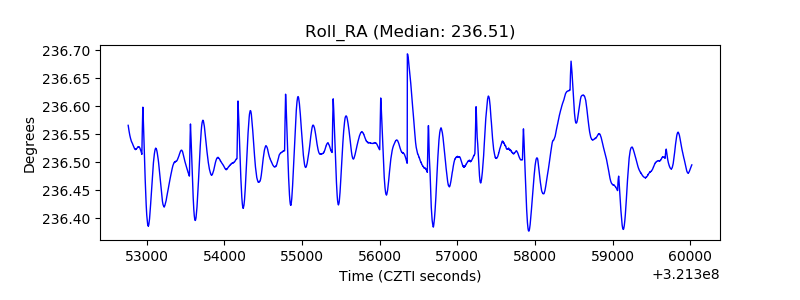 |
| Veto Counter | 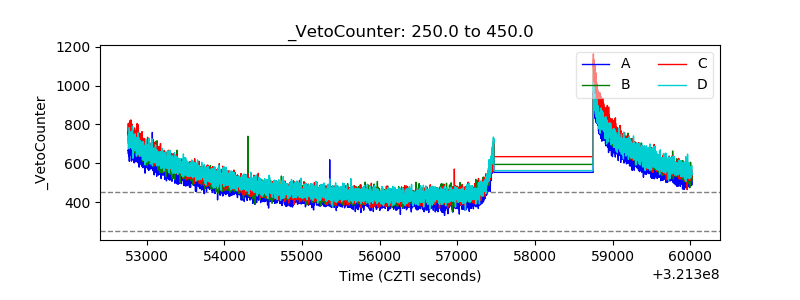 |