| Param | Original file | Final file |
|---|---|---|
| Filename | modeM0/AS1A07_165T01_9000003558_24028cztM0_level2.evt | modeM0/AS1A07_165T01_9000003558_24028cztM0_level2_quad_clean.evt |
| Size (bytes) | 507,104,640 | 155,283,840 |
| Size | 483.6 MB | 148.1 MB |
| Events in quadrant A | 3,568,893 | 1,083,430 |
| Events in quadrant B | 3,865,615 | 1,093,573 |
| Events in quadrant C | 3,700,451 | 1,036,156 |
| Events in quadrant D | 3,770,018 | 1,025,284 |
| Mode M9 | |||
|---|---|---|---|
| Quadrant | BADHDUFLAG | Total packets | Discarded packets |
| A | 0 | 13 | 0 |
| B | 0 | 13 | 0 |
| C | 0 | 13 | 0 |
| D | 0 | 13 | 0 |
| Mode M0 | |||
|---|---|---|---|
| Quadrant | BADHDUFLAG | Total packets | Discarded packets |
| A | 0 | 14761 | 2 |
| B | 0 | 16020 | 2 |
| C | 0 | 15297 | 2 |
| D | 0 | 15469 | 2 |
| Mode SS | |||
|---|---|---|---|
| Quadrant | BADHDUFLAG | Total packets | Discarded packets |
| A | 0 | 136 | 0 |
| B | 0 | 136 | 0 |
| C | 0 | 136 | 0 |
| D | 0 | 136 | 0 |
| Quadrant | Total seconds | Saturated seconds | Saturation percentage |
|---|---|---|---|
| A | 6671 | 93 | 1.394094% |
| B | 6672 | 93 | 1.393885% |
| C | 6672 | 185 | 2.772782% |
| D | 6672 | 78 | 1.169065% |
Noise dominated data is calculated using 1-second bins in cleaned event files. If a bin has >2000 counts, and if more than 50% of those come from <1% of pixels, then it is considered to be noise-dominated and hence unusable.
| Quadrant | # 1 sec bins | Bins with >0 counts | Bins with >2000 counts | High rate bins dominated by noise | Noise dominated (total time) | Noise dominated (detector-on time) | Marked lightcurve |
|---|---|---|---|---|---|---|---|
| A | 7956 | 6672 | 0 | 0 | 0.00% | 0.00% | 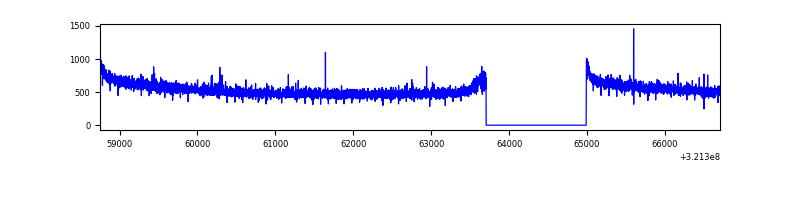 |
| B | 7957 | 6673 | 3 | 3 | 0.04% | 0.04% | 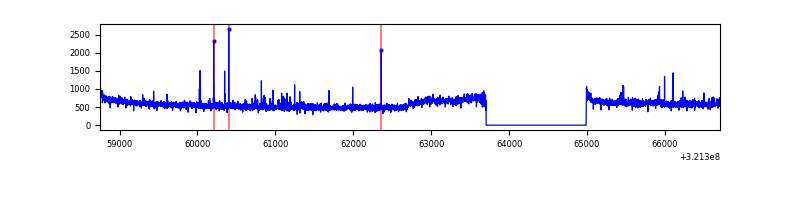 |
| C | 7957 | 6673 | 33 | 33 | 0.41% | 0.49% | 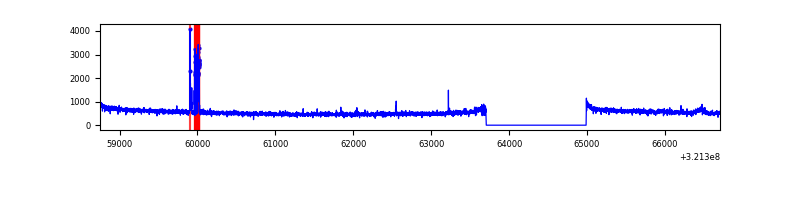 |
| D | 7957 | 6673 | 7 | 7 | 0.09% | 0.10% | 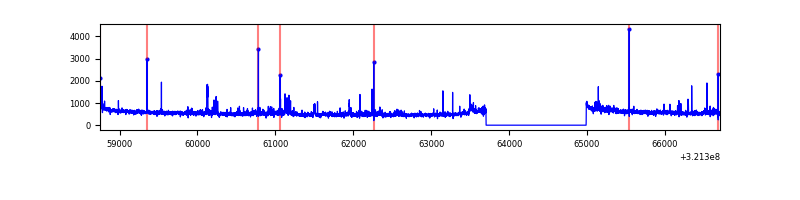 |
Top three noisy pixels from each quadrant. If the there are fewer than three noisy pixels in the level2.evt file, extra rows are filled as -1
| Pixel properties | Quadrant properties | ||||||
|---|---|---|---|---|---|---|---|
| Quadrant | DetID | PixID | Counts | Sigma | Mean | Median | Sigma |
| A | 13 | 254 | 10604 | 53.64 | 924 | 910 | 180.7 |
| A | 0 | 226 | 7998 | 39.22 | 924 | 910 | 180.7 |
| A | 3 | 137 | 6949 | 33.41 | 924 | 910 | 180.7 |
| B | 0 | 197 | 208140 | 1262.81 | 910 | 892 | 164.1 |
| B | 0 | 189 | 24498 | 143.84 | 910 | 892 | 164.1 |
| B | 7 | 202 | 22886 | 134.01 | 910 | 892 | 164.1 |
| C | 0 | 239 | 146927 | 741.86 | 872 | 881 | 196.9 |
| C | 14 | 238 | 143810 | 726.02 | 872 | 881 | 196.9 |
| C | 13 | 61 | 6133 | 26.68 | 872 | 881 | 196.9 |
| D | 8 | 195 | 147105 | 691.55 | 898 | 877 | 211.5 |
| D | 12 | 218 | 96282 | 451.19 | 898 | 877 | 211.5 |
| D | 2 | 234 | 31386 | 144.28 | 898 | 877 | 211.5 |
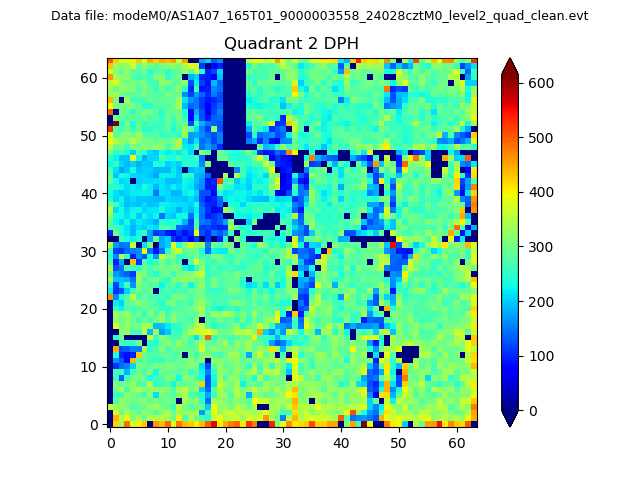
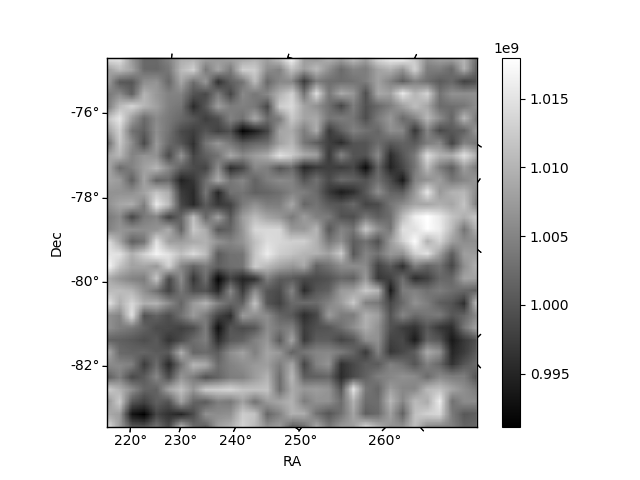
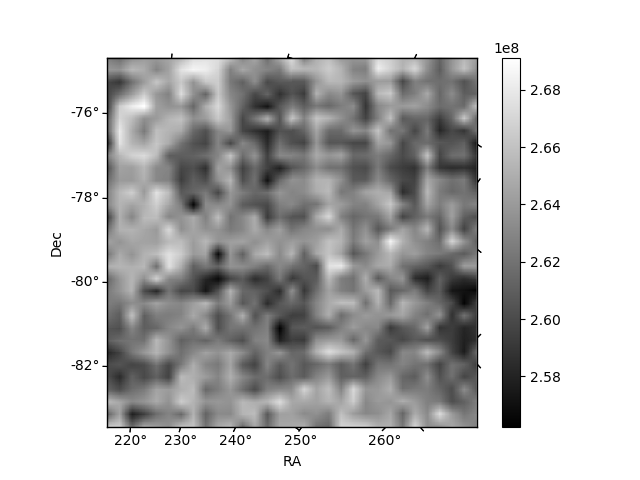
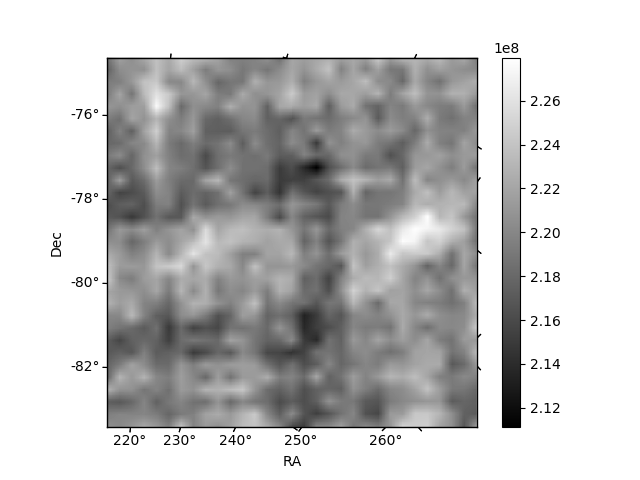
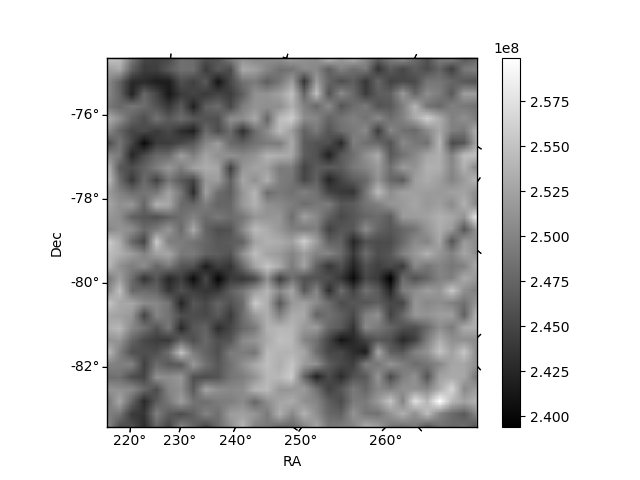
Histogram calculated using DETX and DETY for each event in the final _common_clean file
| Quadrant A | 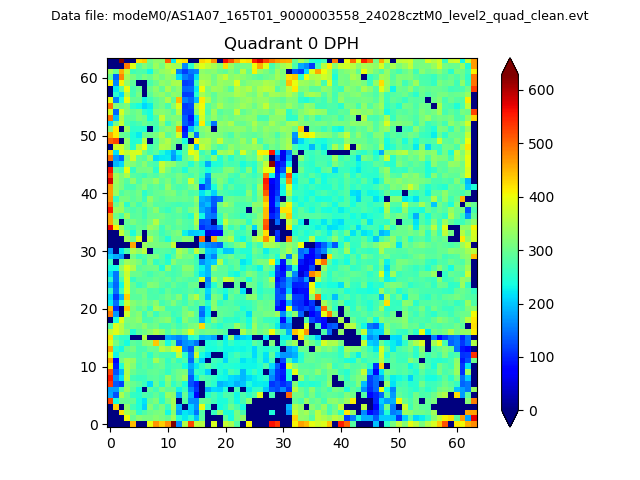 |
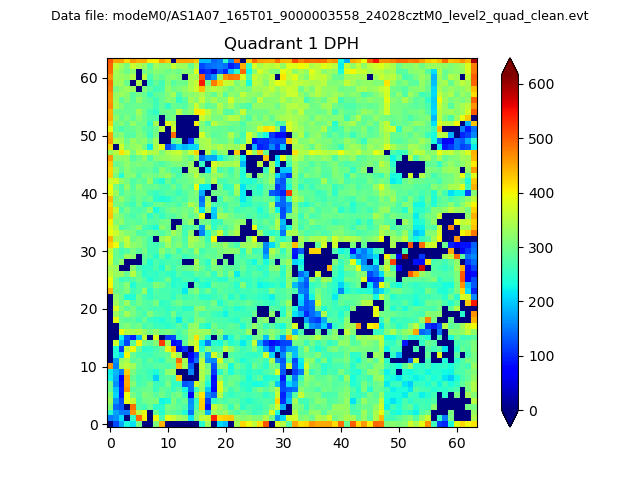 |
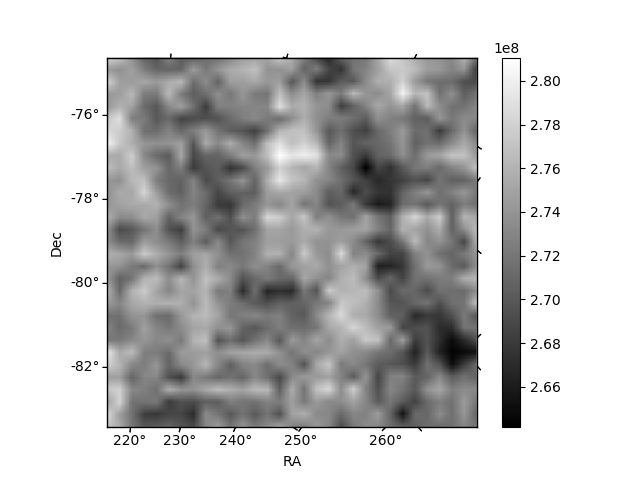
Quadrant B |
|---|---|---|---|
| Quadrant D | 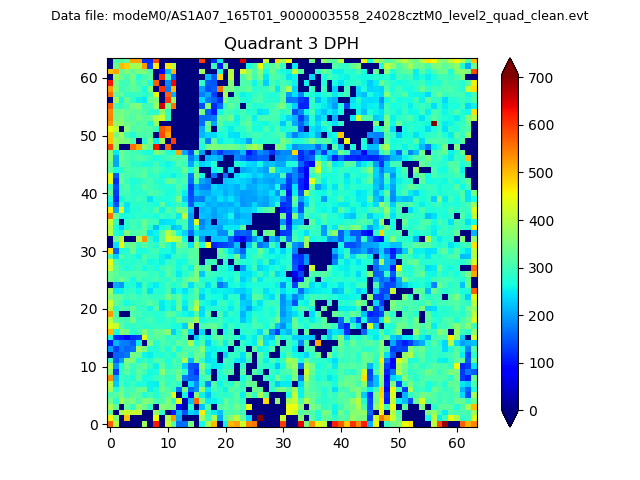 |
 |
Quadrant C |
| Plot type | Count rate plots | Images |
|---|---|---|
| Comparison with Poisson distribution Blue bars denote a histogram of data divided into 1 sec bins. Red curve is a Poisson curve with rate = median count rate of data. |
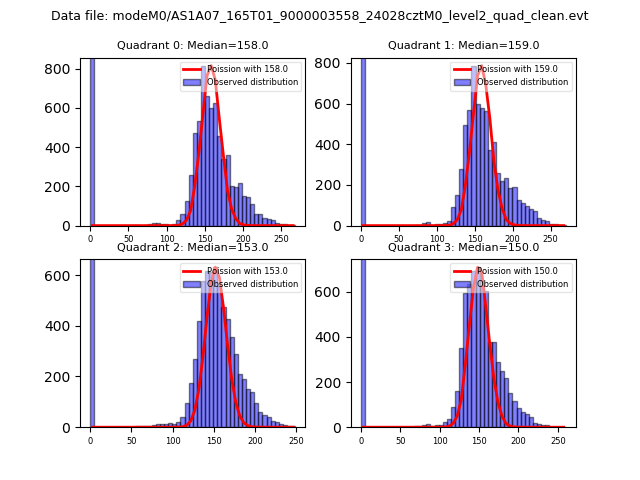 |
 |
| Quadrant-wise count rates Data is divided into 100 sec bins |
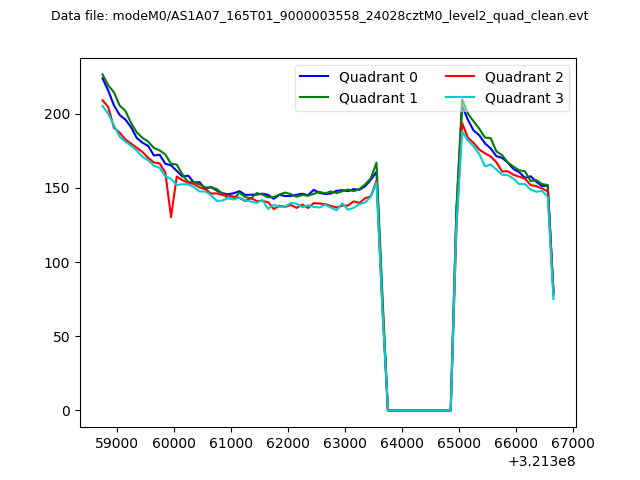 |
|
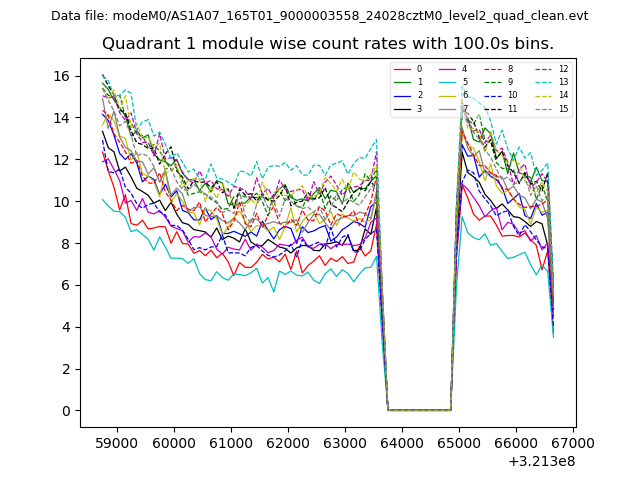
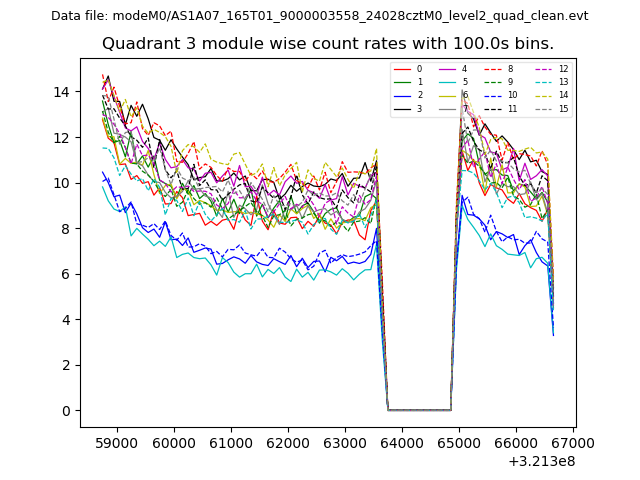
| Module-wise count rates for Quadrant A Data is divided into 100 sec bins |
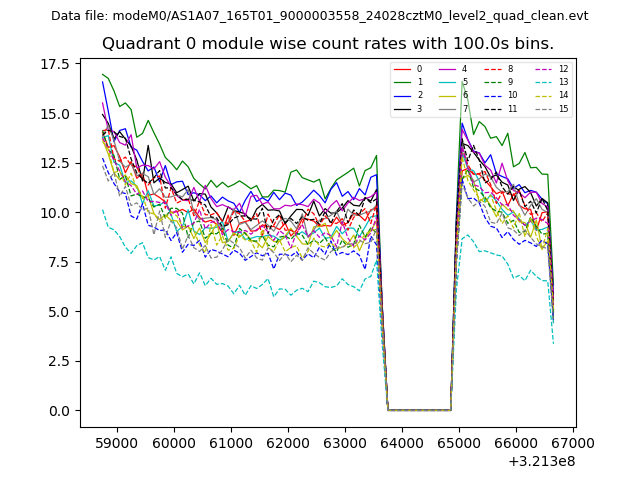 |
 |
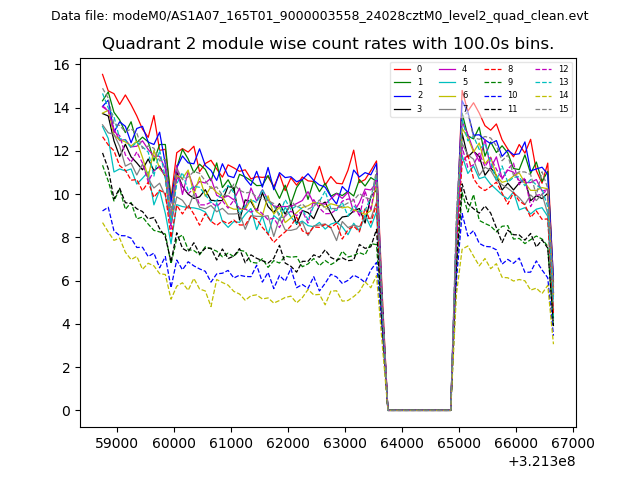
| Module-wise count rates for Quadrant B Data is divided into 100 sec bins |
 |
 |
| Module-wise count rates for Quadrant C Data is divided into 100 sec bins |
 |
 |
| Module-wise count rates for Quadrant D Data is divided into 100 sec bins |
 |
 |
| Parameter | Plot |
|---|---|
| CZT HV Monitor | 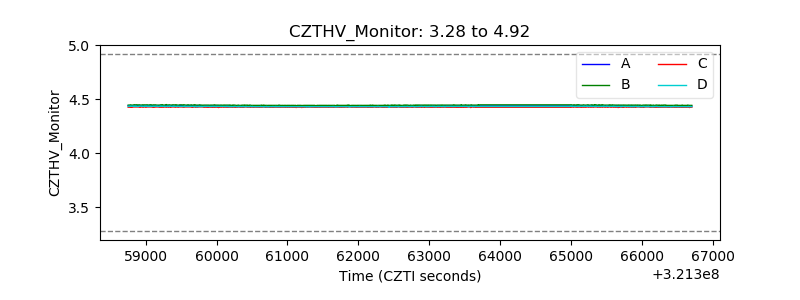 |
| D_VDD | 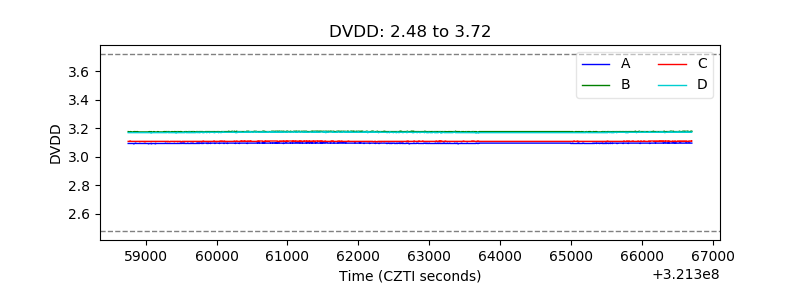 |
| Temperature 1 | 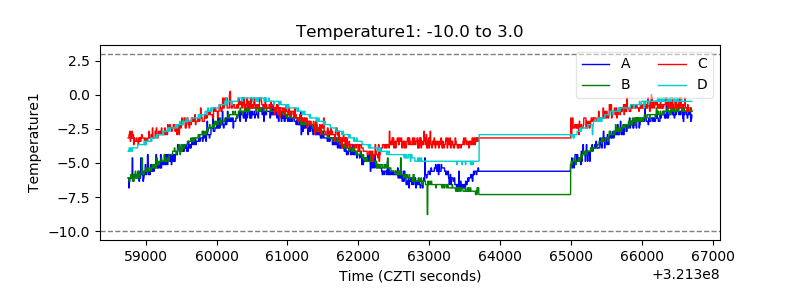 |
| Veto HV Monitor | 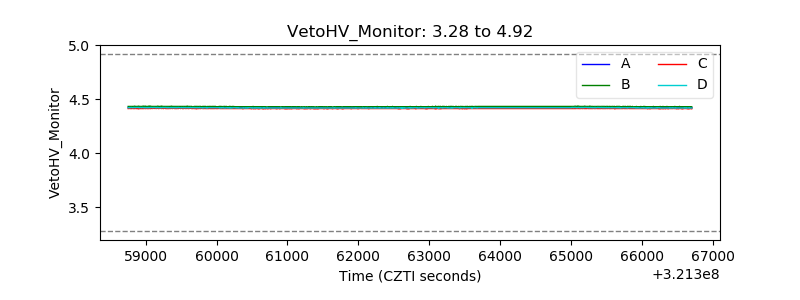 |
| Veto LLD | 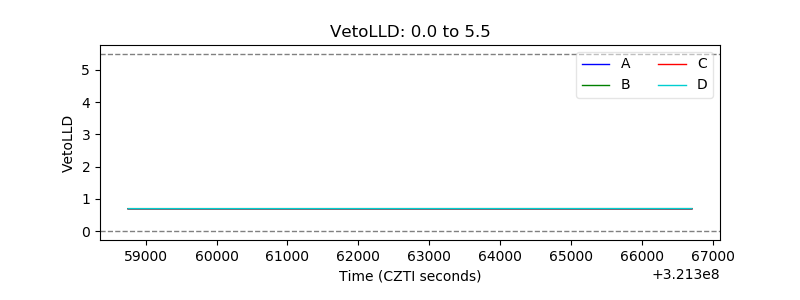 |
| Alpha Counter | 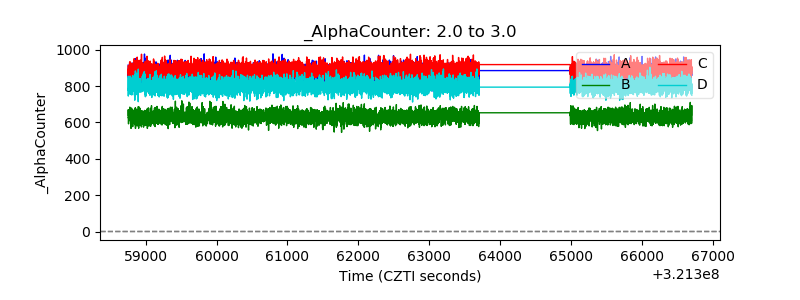 |
| _CPM_Rate | 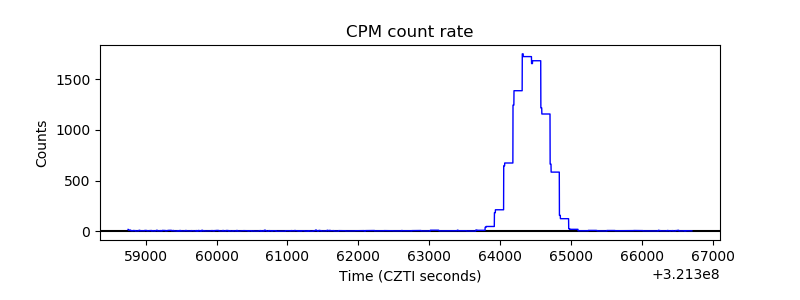 |
| CZT Counter | 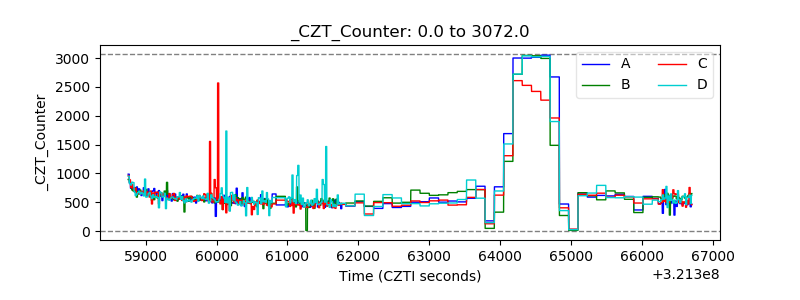 |
| +2.5 Volts monitor | 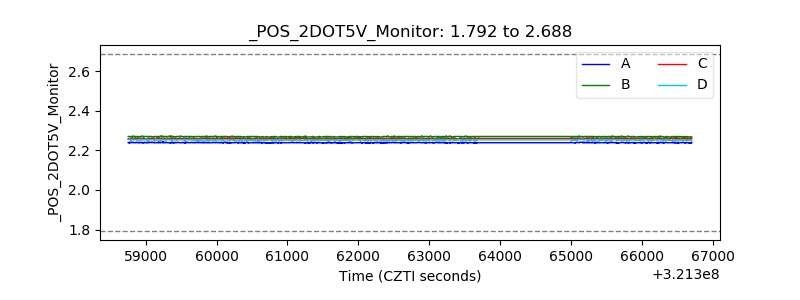 |
| +5 Volts monitor |  |
| _ROLL_ROT | 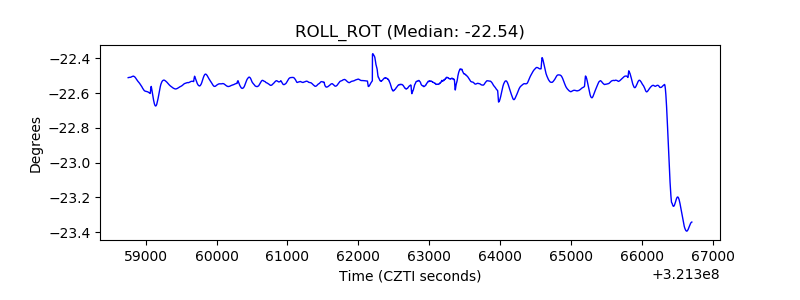 |
| _Roll_DEC |  |
| _Roll_RA | 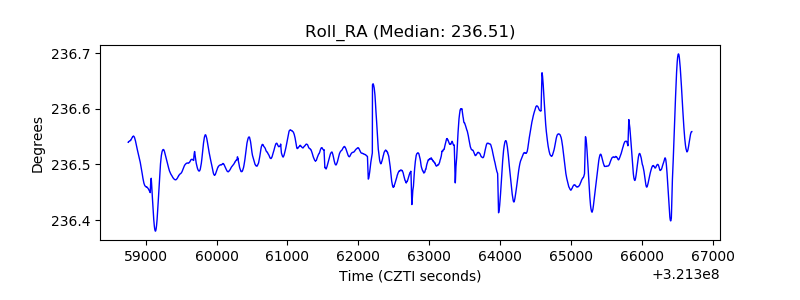 |
| Veto Counter | 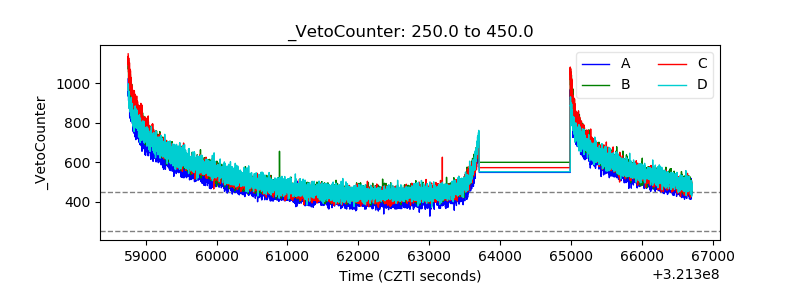 |