| Param | Original file | Final file |
|---|---|---|
| Filename | modeM0/AS1A07_165T01_9000003558_24029cztM0_level2.evt | modeM0/AS1A07_165T01_9000003558_24029cztM0_level2_quad_clean.evt |
| Size (bytes) | 488,442,240 | 131,172,480 |
| Size | 465.8 MB | 125.1 MB |
| Events in quadrant A | 3,058,620 | 911,746 |
| Events in quadrant B | 3,509,908 | 916,526 |
| Events in quadrant C | 3,705,013 | 864,698 |
| Events in quadrant D | 4,109,552 | 858,587 |
| Mode M9 | |||
|---|---|---|---|
| Quadrant | BADHDUFLAG | Total packets | Discarded packets |
| A | 0 | 12 | 0 |
| B | 0 | 12 | 0 |
| C | 0 | 12 | 0 |
| D | 0 | 12 | 0 |
| Mode M0 | |||
|---|---|---|---|
| Quadrant | BADHDUFLAG | Total packets | Discarded packets |
| A | 0 | 12643 | 1 |
| B | 0 | 14191 | 1 |
| C | 0 | 14689 | 1 |
| D | 0 | 16305 | 1 |
| Mode SS | |||
|---|---|---|---|
| Quadrant | BADHDUFLAG | Total packets | Discarded packets |
| A | 0 | 124 | 0 |
| B | 0 | 124 | 0 |
| C | 0 | 124 | 0 |
| D | 0 | 124 | 0 |
| Quadrant | Total seconds | Saturated seconds | Saturation percentage |
|---|---|---|---|
| A | 6032 | 87 | 1.442308% |
| B | 6033 | 101 | 1.674126% |
| C | 6033 | 291 | 4.823471% |
| D | 6033 | 96 | 1.591248% |
Noise dominated data is calculated using 1-second bins in cleaned event files. If a bin has >2000 counts, and if more than 50% of those come from <1% of pixels, then it is considered to be noise-dominated and hence unusable.
| Quadrant | # 1 sec bins | Bins with >0 counts | Bins with >2000 counts | High rate bins dominated by noise | Noise dominated (total time) | Noise dominated (detector-on time) | Marked lightcurve |
|---|---|---|---|---|---|---|---|
| A | 7262 | 6033 | 2 | 2 | 0.03% | 0.03% | 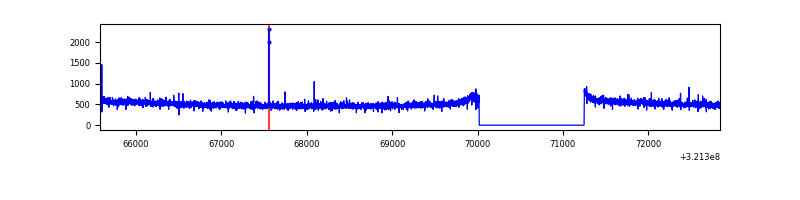 |
| B | 7263 | 6033 | 4 | 4 | 0.06% | 0.07% | 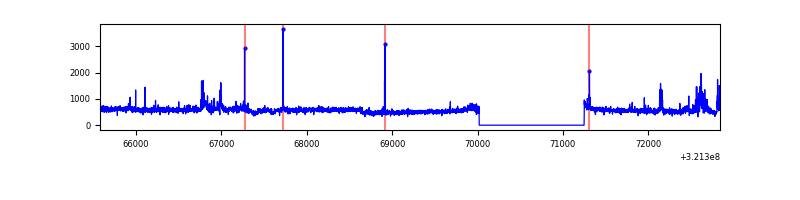 |
| C | 7263 | 6034 | 133 | 133 | 1.83% | 2.20% | 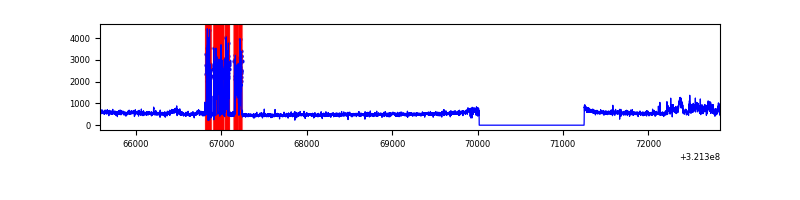 |
| D | 7263 | 6034 | 9 | 9 | 0.12% | 0.15% | 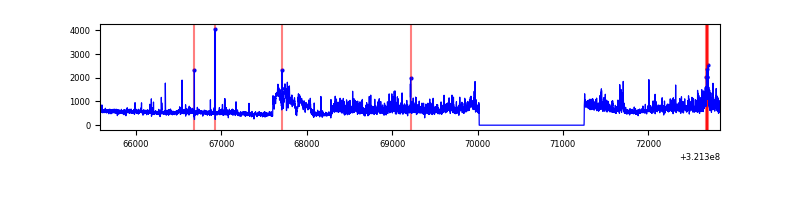 |
Top three noisy pixels from each quadrant. If the there are fewer than three noisy pixels in the level2.evt file, extra rows are filled as -1
| Pixel properties | Quadrant properties | ||||||
|---|---|---|---|---|---|---|---|
| Quadrant | DetID | PixID | Counts | Sigma | Mean | Median | Sigma |
| A | 13 | 254 | 9841 | 58.23 | 789 | 777 | 155.7 |
| A | 0 | 226 | 7221 | 41.4 | 789 | 777 | 155.7 |
| A | 0 | 230 | 6442 | 36.39 | 789 | 777 | 155.7 |
| B | 0 | 197 | 301989 | 2100.35 | 779 | 764 | 143.4 |
| B | 0 | 189 | 96474 | 667.36 | 779 | 764 | 143.4 |
| B | 12 | 111 | 16179 | 107.48 | 779 | 764 | 143.4 |
| C | 0 | 239 | 504445 | 3002.73 | 736 | 741 | 167.7 |
| C | 7 | 247 | 204477 | 1214.53 | 736 | 741 | 167.7 |
| C | 14 | 238 | 120873 | 716.14 | 736 | 741 | 167.7 |
| D | 8 | 195 | 874875 | 4823.53 | 760 | 739 | 181.2 |
| D | 7 | 238 | 266848 | 1468.4 | 760 | 739 | 181.2 |
| D | 1 | 52 | 36115 | 195.21 | 760 | 739 | 181.2 |
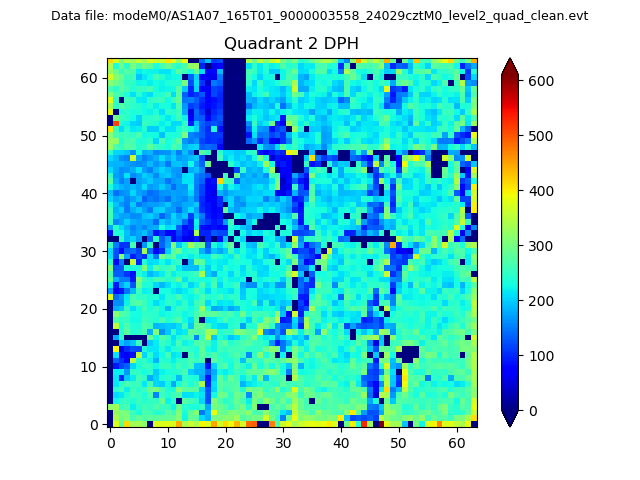
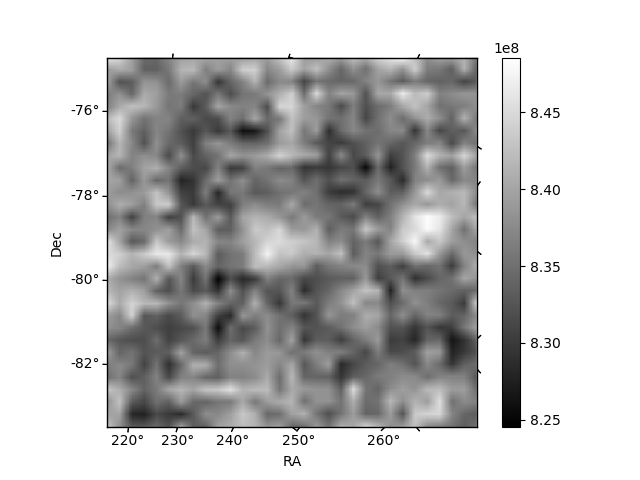
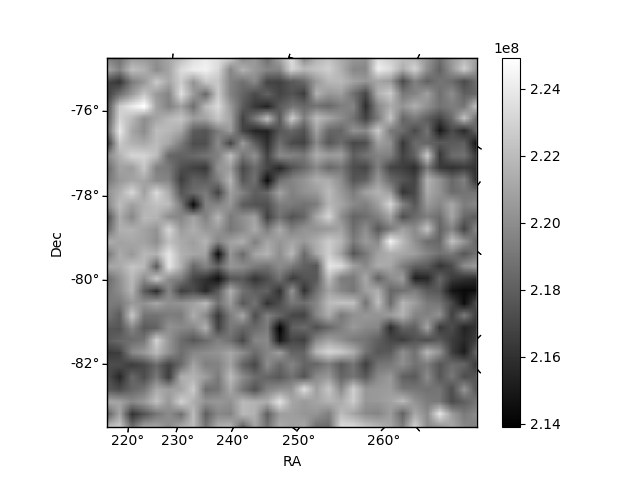
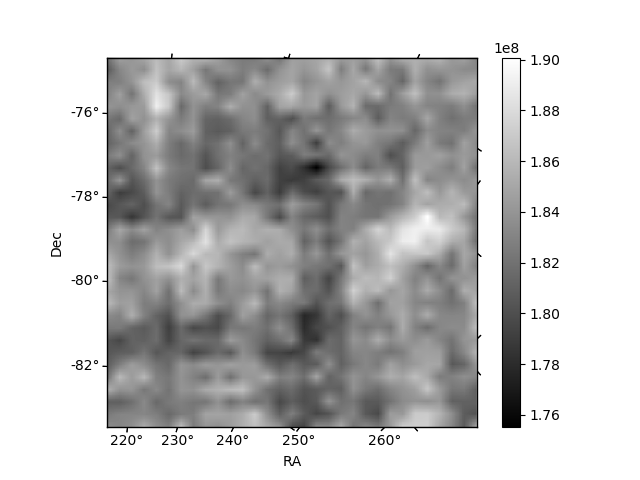
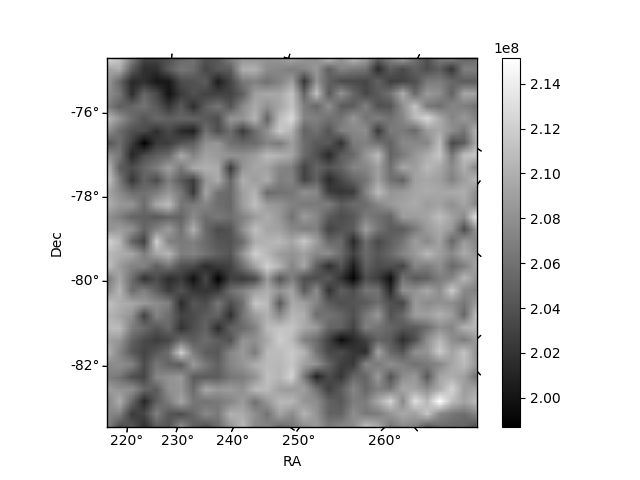
Histogram calculated using DETX and DETY for each event in the final _common_clean file
| Quadrant A | 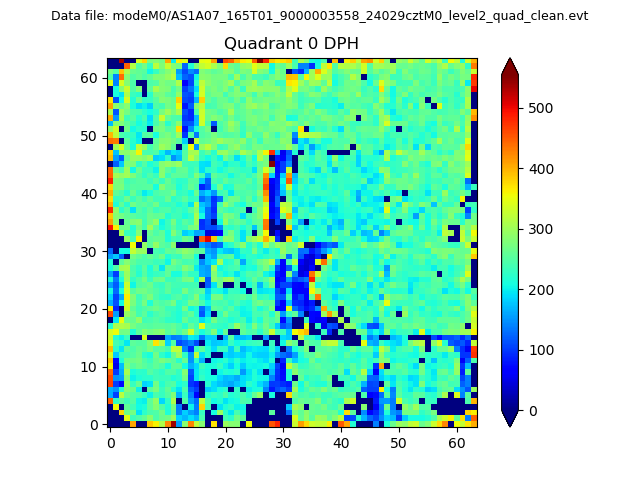 |
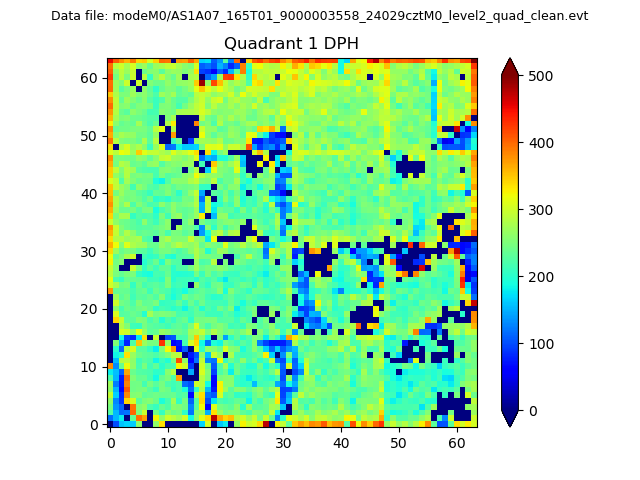 |
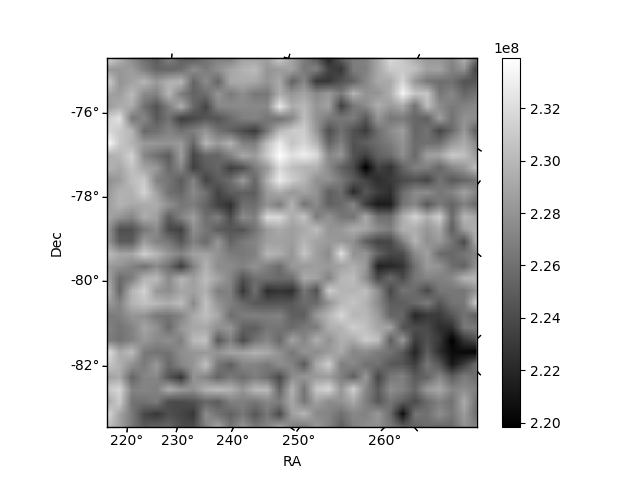
Quadrant B |
|---|---|---|---|
| Quadrant D | 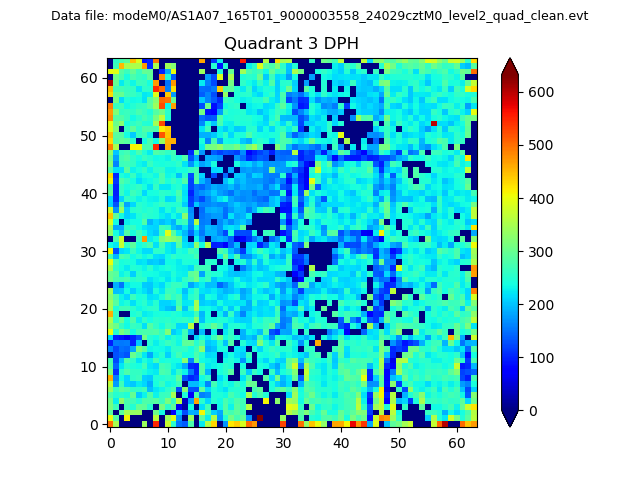 |
 |
Quadrant C |
| Plot type | Count rate plots | Images |
|---|---|---|
| Comparison with Poisson distribution Blue bars denote a histogram of data divided into 1 sec bins. Red curve is a Poisson curve with rate = median count rate of data. |
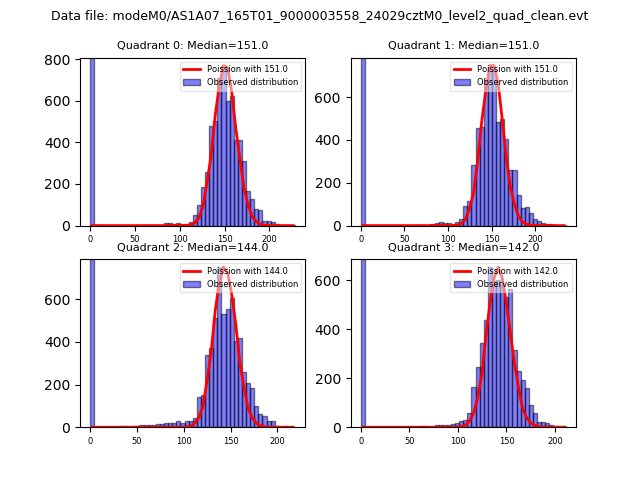 |
 |
| Quadrant-wise count rates Data is divided into 100 sec bins |
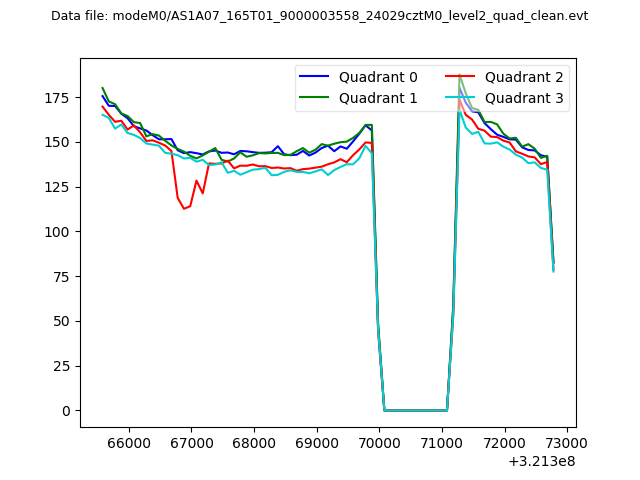 |
|
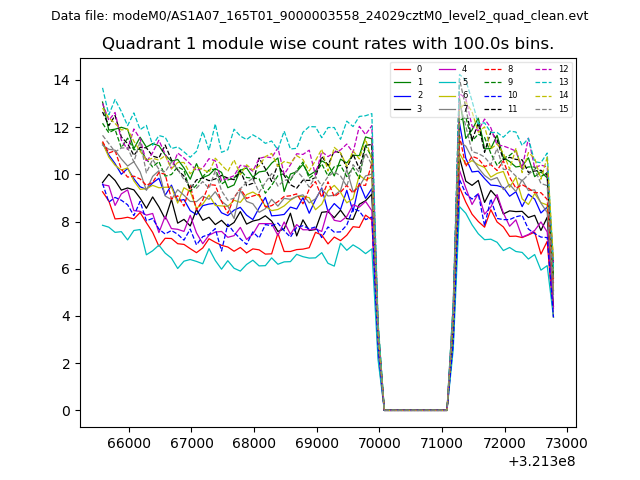
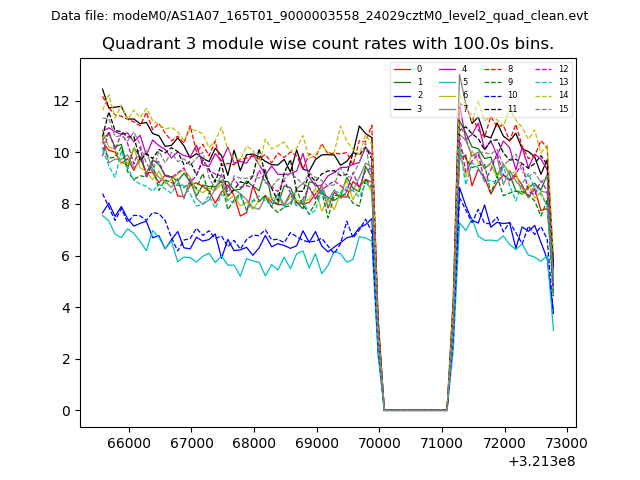
| Module-wise count rates for Quadrant A Data is divided into 100 sec bins |
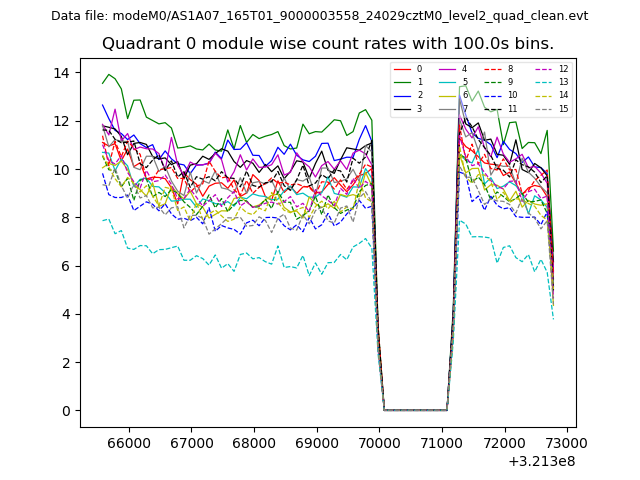 |
 |
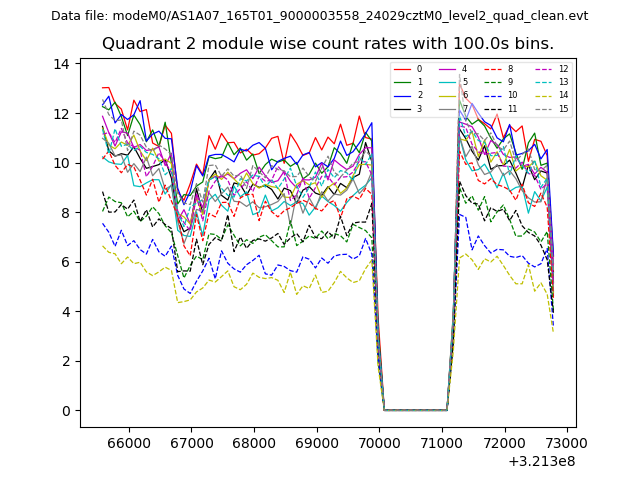
| Module-wise count rates for Quadrant B Data is divided into 100 sec bins |
 |
 |
| Module-wise count rates for Quadrant C Data is divided into 100 sec bins |
 |
 |
| Module-wise count rates for Quadrant D Data is divided into 100 sec bins |
 |
 |
| Parameter | Plot |
|---|---|
| CZT HV Monitor | 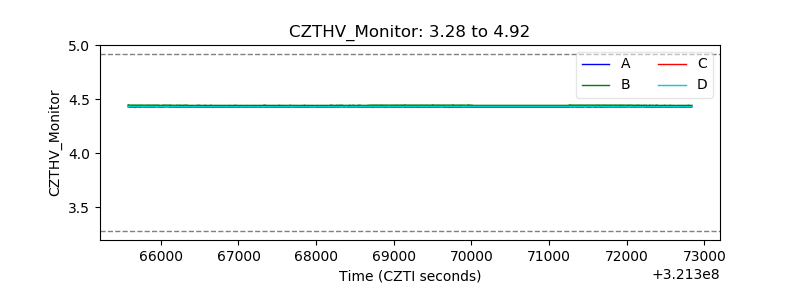 |
| D_VDD | 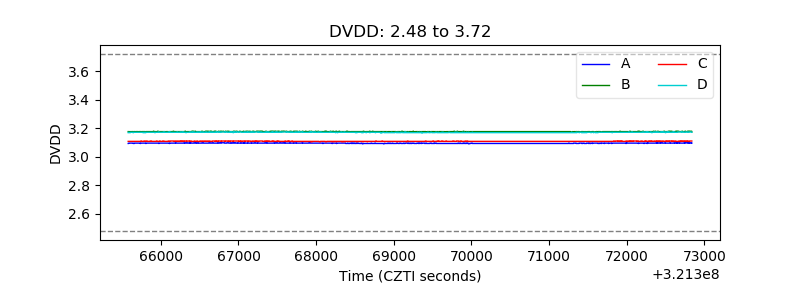 |
| Temperature 1 | 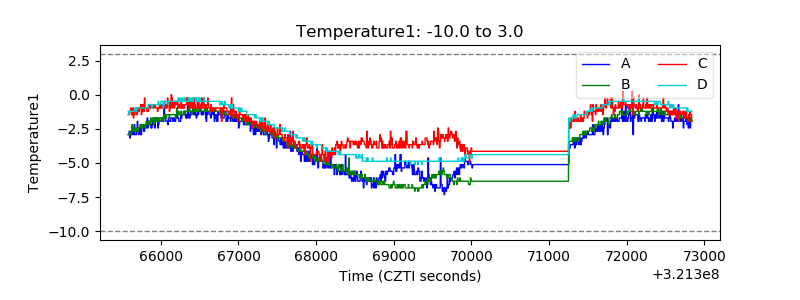 |
| Veto HV Monitor | 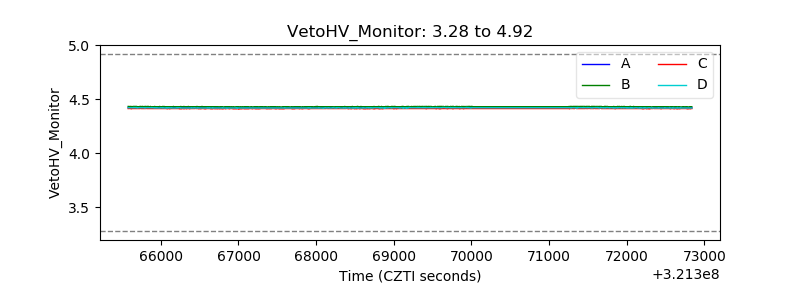 |
| Veto LLD | 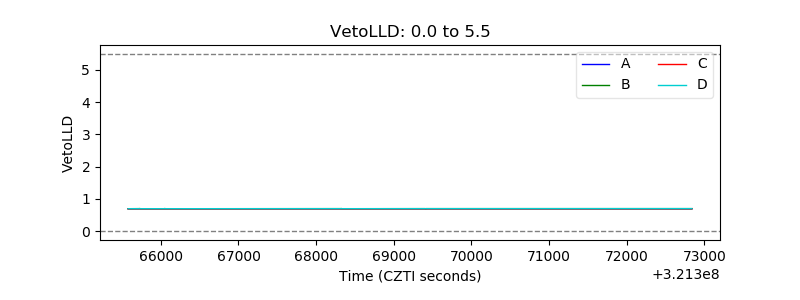 |
| Alpha Counter | 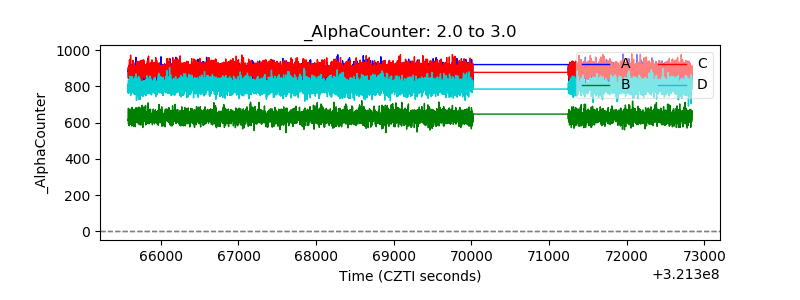 |
| _CPM_Rate | 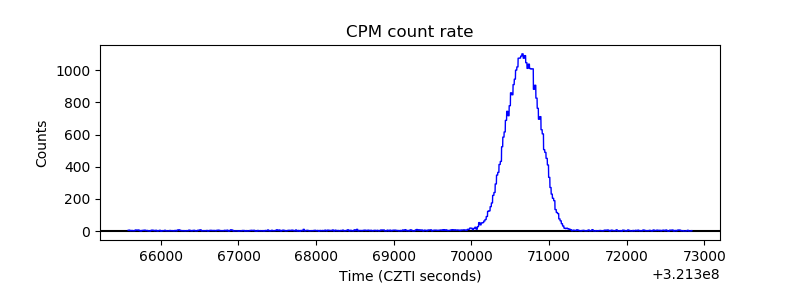 |
| CZT Counter | 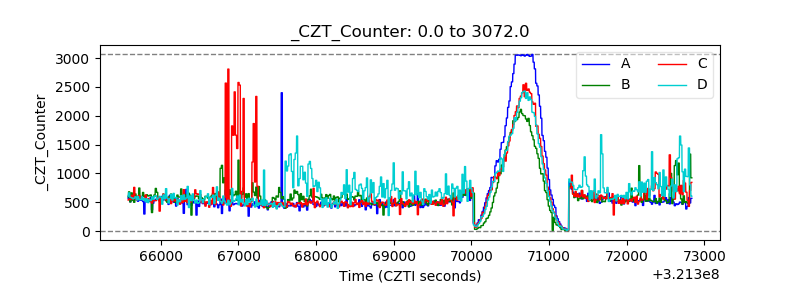 |
| +2.5 Volts monitor | 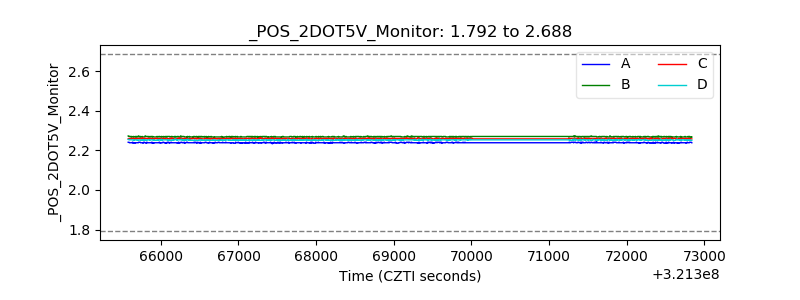 |
| +5 Volts monitor |  |
| _ROLL_ROT | 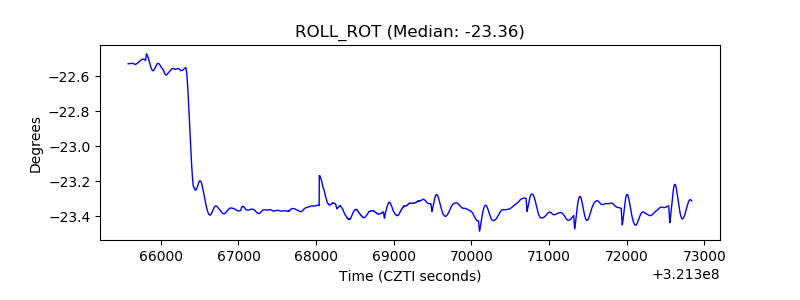 |
| _Roll_DEC |  |
| _Roll_RA | 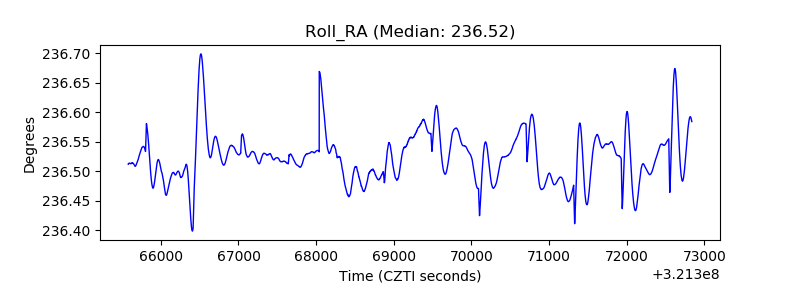 |
| Veto Counter | 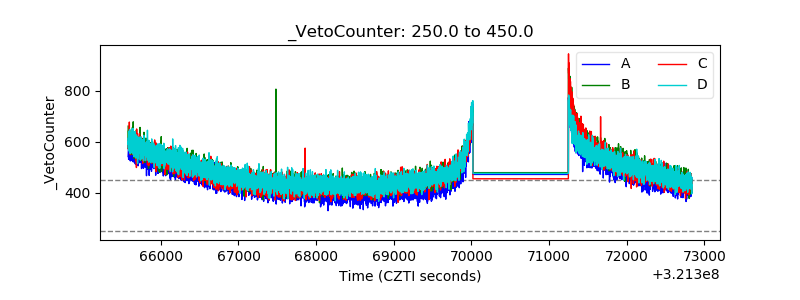 |