| Param | Original file | Final file |
|---|---|---|
| Filename | modeM0/AS1A07_165T01_9000003558_24030cztM0_level2.evt | modeM0/AS1A07_165T01_9000003558_24030cztM0_level2_quad_clean.evt |
| Size (bytes) | 497,531,520 | 135,118,080 |
| Size | 474.5 MB | 128.9 MB |
| Events in quadrant A | 3,202,352 | 928,854 |
| Events in quadrant B | 3,681,983 | 934,771 |
| Events in quadrant C | 3,690,228 | 891,991 |
| Events in quadrant D | 4,049,730 | 881,131 |
| Mode M9 | |||
|---|---|---|---|
| Quadrant | BADHDUFLAG | Total packets | Discarded packets |
| A | 0 | 11 | 0 |
| B | 0 | 11 | 0 |
| C | 0 | 11 | 0 |
| D | 0 | 11 | 0 |
| Mode M0 | |||
|---|---|---|---|
| Quadrant | BADHDUFLAG | Total packets | Discarded packets |
| A | 0 | 13555 | 1 |
| B | 0 | 15007 | 1 |
| C | 0 | 15062 | 1 |
| D | 0 | 16288 | 1 |
| Mode SS | |||
|---|---|---|---|
| Quadrant | BADHDUFLAG | Total packets | Discarded packets |
| A | 0 | 130 | 0 |
| B | 0 | 130 | 0 |
| C | 0 | 130 | 0 |
| D | 0 | 130 | 0 |
| Quadrant | Total seconds | Saturated seconds | Saturation percentage |
|---|---|---|---|
| A | 6544 | 95 | 1.451711% |
| B | 6545 | 171 | 2.612681% |
| C | 6545 | 150 | 2.291826% |
| D | 6545 | 102 | 1.558442% |
Noise dominated data is calculated using 1-second bins in cleaned event files. If a bin has >2000 counts, and if more than 50% of those come from <1% of pixels, then it is considered to be noise-dominated and hence unusable.
| Quadrant | # 1 sec bins | Bins with >0 counts | Bins with >2000 counts | High rate bins dominated by noise | Noise dominated (total time) | Noise dominated (detector-on time) | Marked lightcurve |
|---|---|---|---|---|---|---|---|
| A | 7554 | 6544 | 0 | 0 | 0.00% | 0.00% | 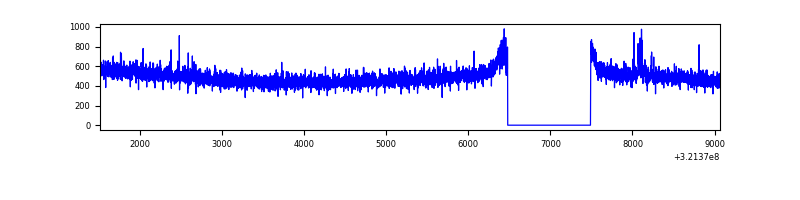 |
| B | 7555 | 6546 | 13 | 13 | 0.17% | 0.20% | 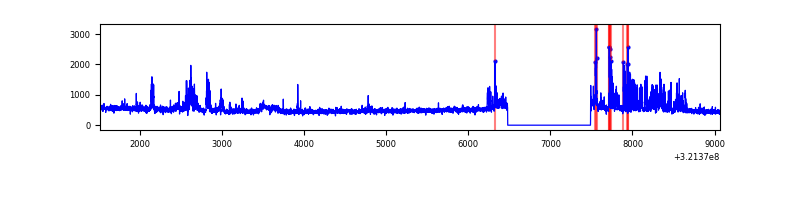 |
| C | 7555 | 6546 | 7 | 7 | 0.09% | 0.11% | 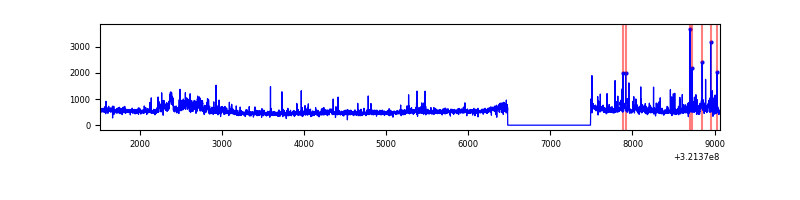 |
| D | 7555 | 6545 | 15 | 15 | 0.20% | 0.23% | 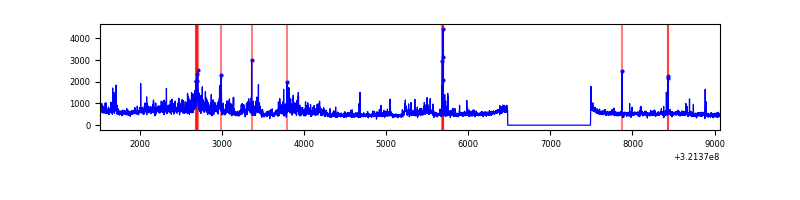 |
Top three noisy pixels from each quadrant. If the there are fewer than three noisy pixels in the level2.evt file, extra rows are filled as -1
| Pixel properties | Quadrant properties | ||||||
|---|---|---|---|---|---|---|---|
| Quadrant | DetID | PixID | Counts | Sigma | Mean | Median | Sigma |
| A | 3 | 1 | 18277 | 106.84 | 824 | 808 | 163.5 |
| A | 13 | 254 | 11027 | 62.5 | 824 | 808 | 163.5 |
| A | 0 | 226 | 7233 | 39.3 | 824 | 808 | 163.5 |
| B | 0 | 189 | 349732 | 2332.82 | 812 | 796 | 149.6 |
| B | 0 | 197 | 102651 | 680.95 | 812 | 796 | 149.6 |
| B | 15 | 32 | 26573 | 172.33 | 812 | 796 | 149.6 |
| C | 7 | 247 | 454869 | 2553.09 | 779 | 783 | 177.9 |
| C | 14 | 238 | 126577 | 707.27 | 779 | 783 | 177.9 |
| C | 0 | 239 | 70950 | 394.51 | 779 | 783 | 177.9 |
| D | 8 | 195 | 851884 | 4432.67 | 799 | 778 | 192.0 |
| D | 1 | 52 | 135013 | 699.11 | 799 | 778 | 192.0 |
| D | 2 | 234 | 30083 | 152.62 | 799 | 778 | 192.0 |
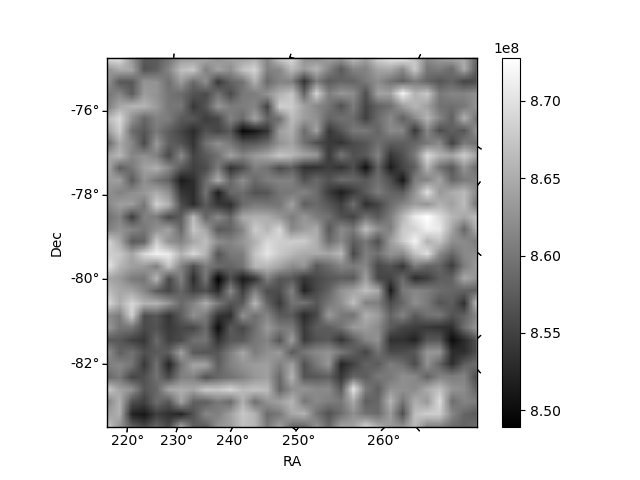
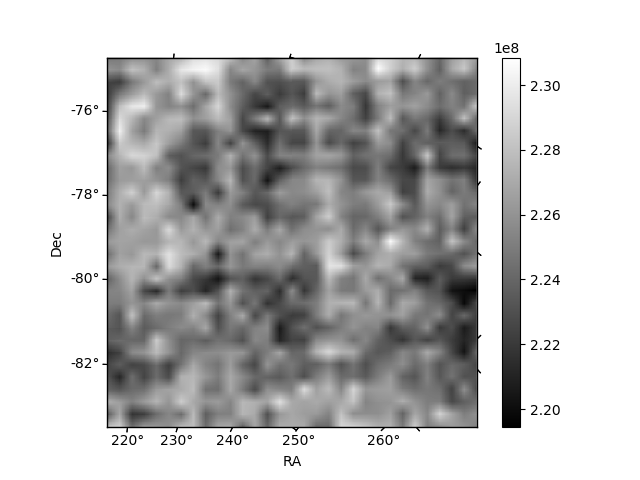
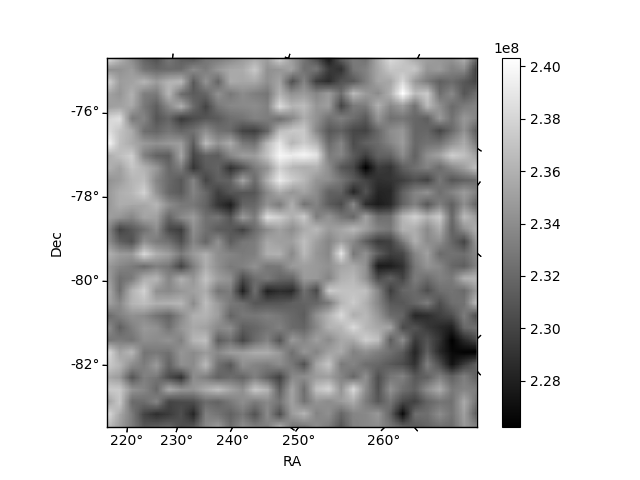
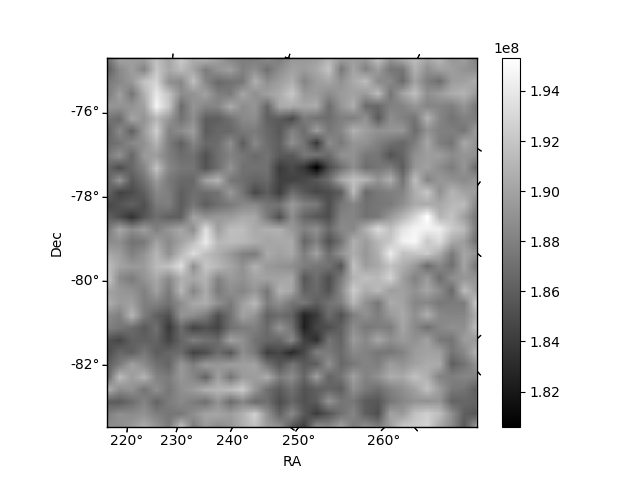
Histogram calculated using DETX and DETY for each event in the final _common_clean file
| Quadrant A | 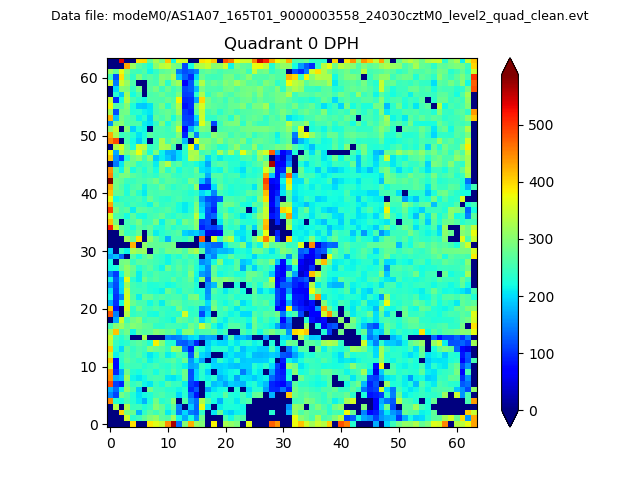 |
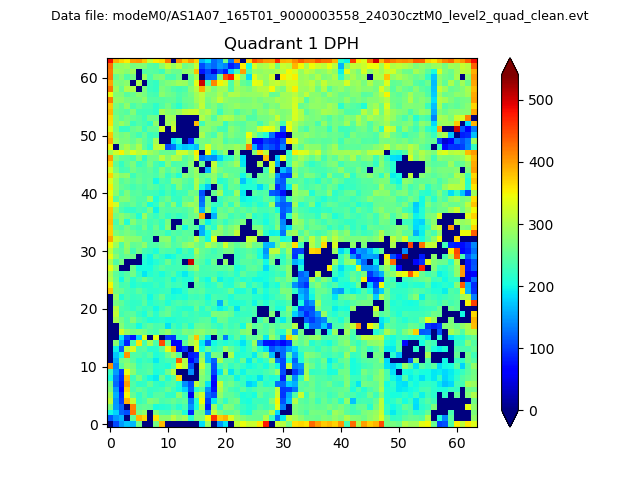 |
Quadrant B |
|---|---|---|---|
| Quadrant D | 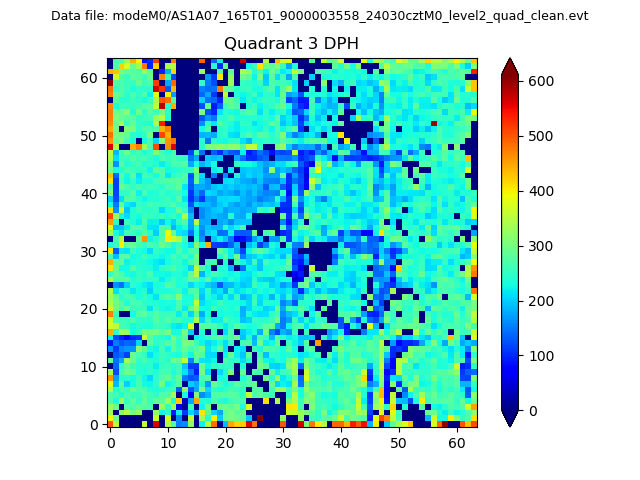 |
 |
Quadrant C |
| Plot type | Count rate plots | Images |
|---|---|---|
| Comparison with Poisson distribution Blue bars denote a histogram of data divided into 1 sec bins. Red curve is a Poisson curve with rate = median count rate of data. |
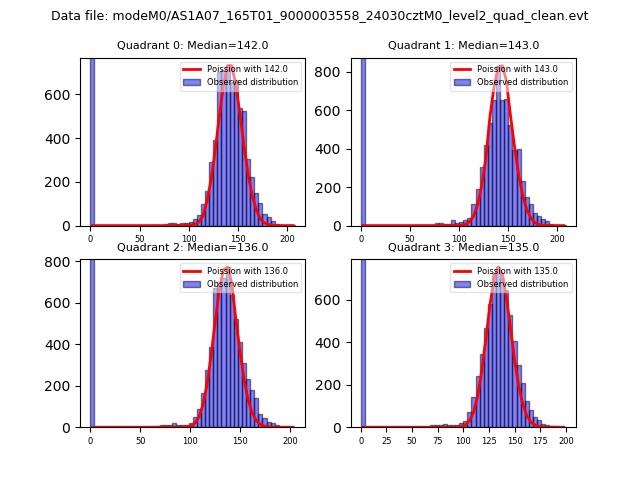 |
 |
| Quadrant-wise count rates Data is divided into 100 sec bins |
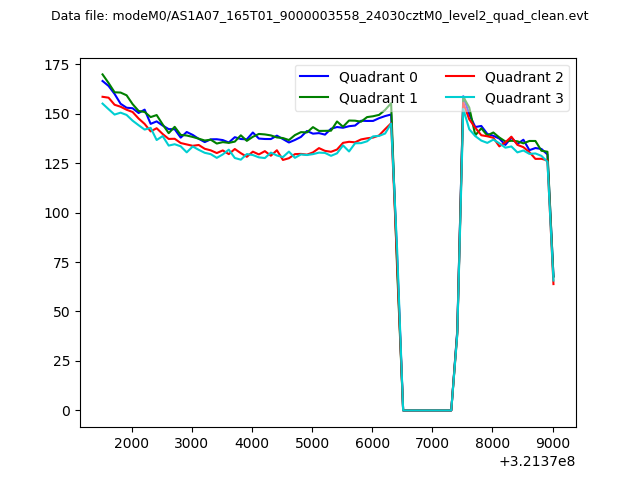 |
|
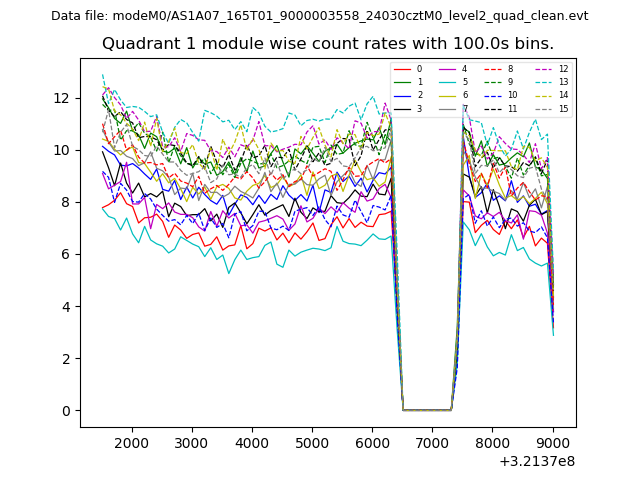
| Module-wise count rates for Quadrant A Data is divided into 100 sec bins |
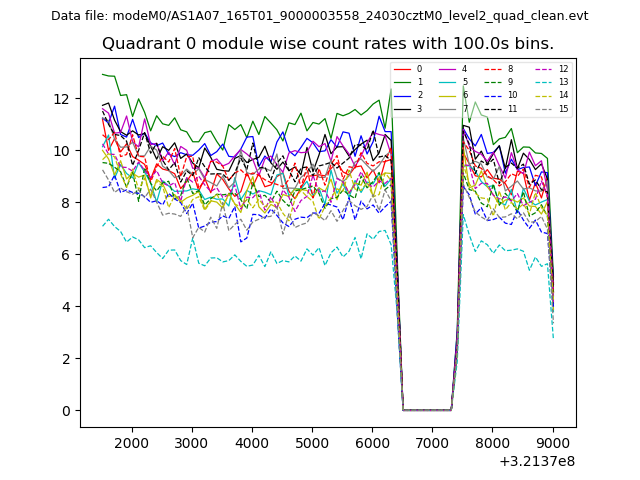 |
 |
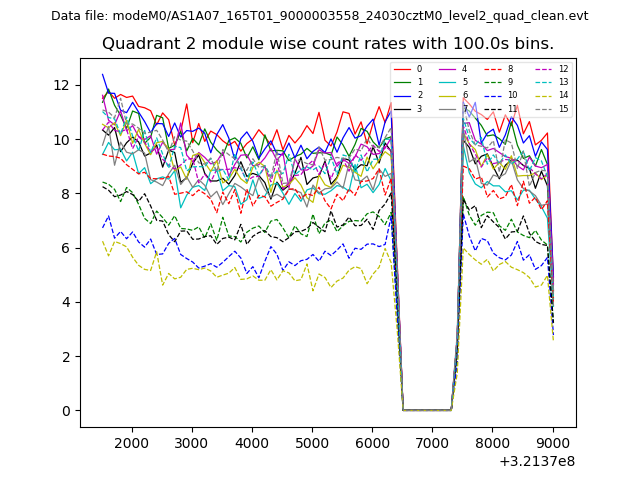
| Module-wise count rates for Quadrant B Data is divided into 100 sec bins |
 |
 |
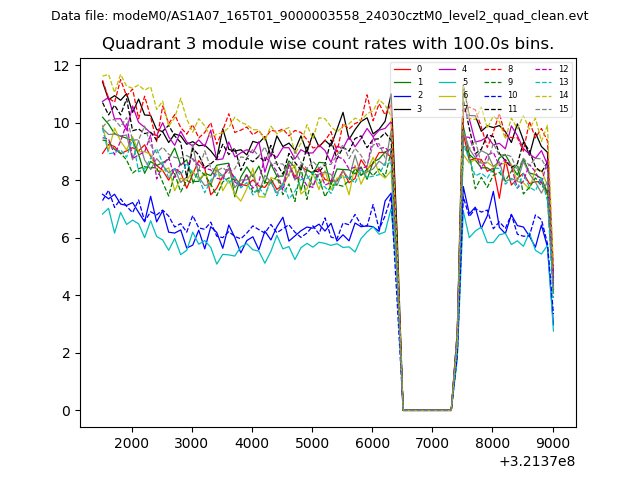
| Module-wise count rates for Quadrant C Data is divided into 100 sec bins |
 |
 |
| Module-wise count rates for Quadrant D Data is divided into 100 sec bins |
 |
 |
| Parameter | Plot |
|---|---|
| CZT HV Monitor | 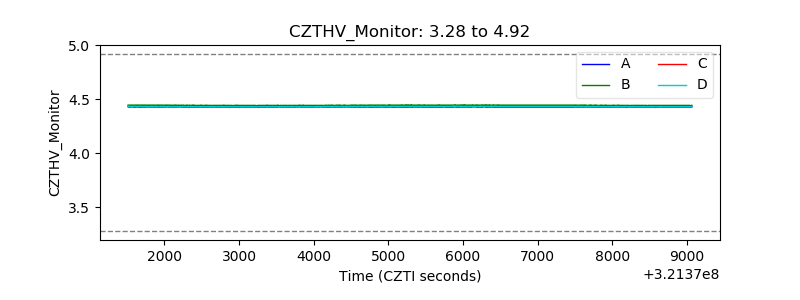 |
| D_VDD | 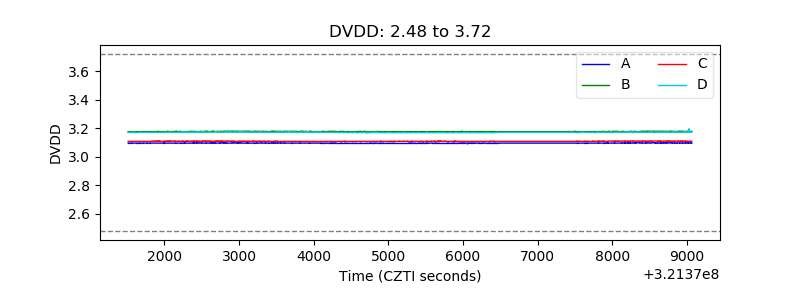 |
| Temperature 1 | 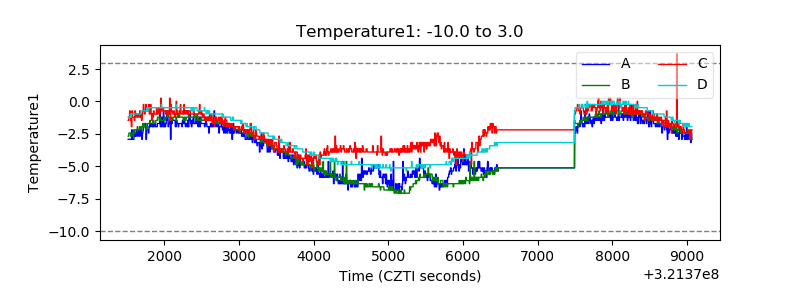 |
| Veto HV Monitor | 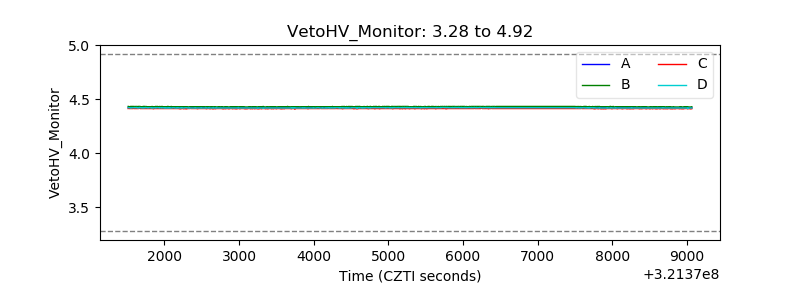 |
| Veto LLD | 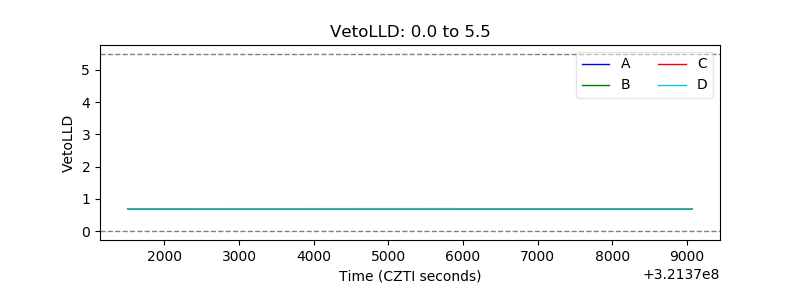 |
| Alpha Counter | 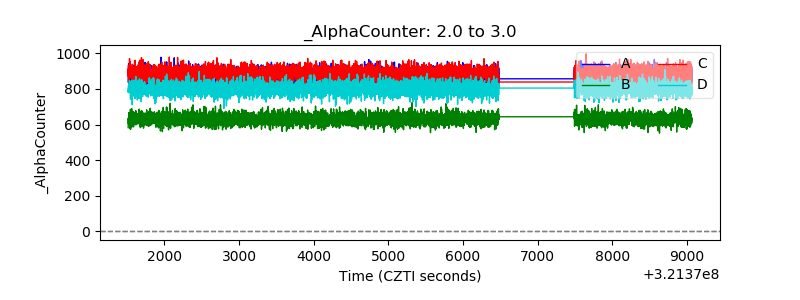 |
| _CPM_Rate | 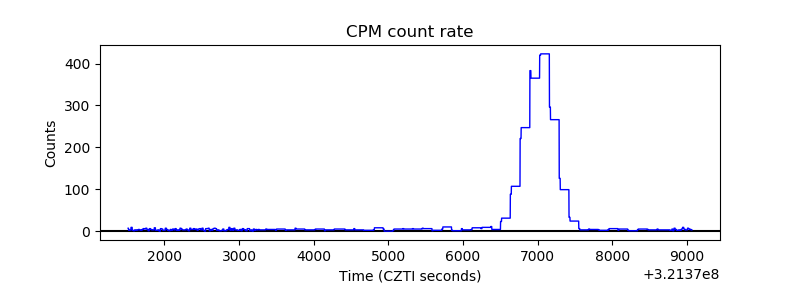 |
| CZT Counter | 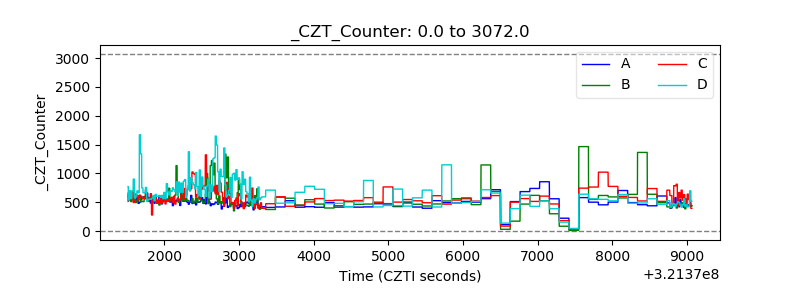 |
| +2.5 Volts monitor | 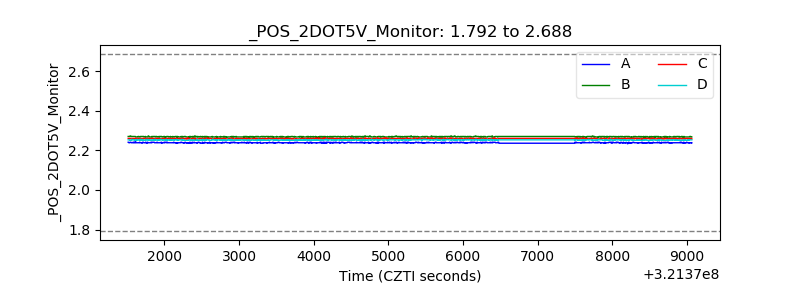 |
| +5 Volts monitor |  |
| _ROLL_ROT | 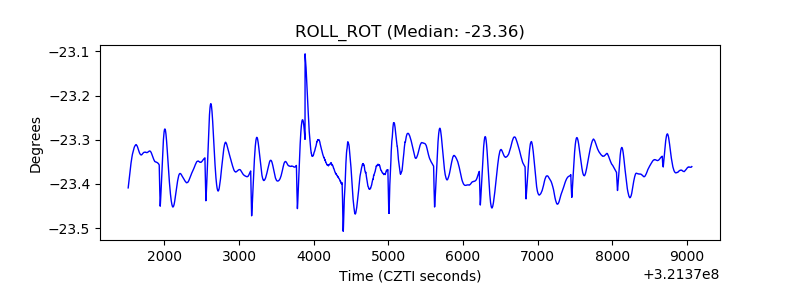 |
| _Roll_DEC |  |
| _Roll_RA | 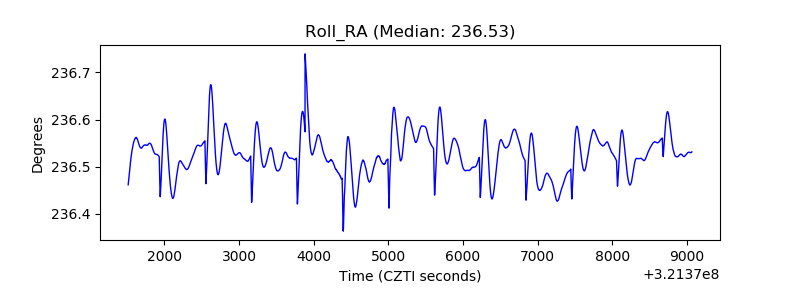 |
| Veto Counter | 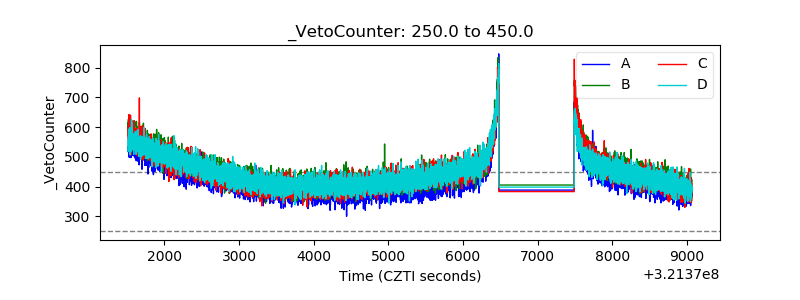 |