| Param | Original file | Final file |
|---|---|---|
| Filename | modeM0/AS1A07_165T01_9000003558_24032cztM0_level2.evt | modeM0/AS1A07_165T01_9000003558_24032cztM0_level2_quad_clean.evt |
| Size (bytes) | 493,712,640 | 130,919,040 |
| Size | 470.8 MB | 124.9 MB |
| Events in quadrant A | 3,159,131 | 888,721 |
| Events in quadrant B | 4,387,308 | 891,089 |
| Events in quadrant C | 3,300,684 | 860,386 |
| Events in quadrant D | 3,638,848 | 846,851 |
| Mode M9 | |||
|---|---|---|---|
| Quadrant | BADHDUFLAG | Total packets | Discarded packets |
| A | 0 | 4 | 0 |
| B | 0 | 4 | 0 |
| C | 0 | 4 | 0 |
| D | 0 | 4 | 0 |
| Mode M0 | |||
|---|---|---|---|
| Quadrant | BADHDUFLAG | Total packets | Discarded packets |
| A | 0 | 14034 | 1 |
| B | 0 | 17477 | 1 |
| C | 0 | 14268 | 1 |
| D | 0 | 15260 | 1 |
| Mode SS | |||
|---|---|---|---|
| Quadrant | BADHDUFLAG | Total packets | Discarded packets |
| A | 0 | 140 | 0 |
| B | 0 | 140 | 0 |
| C | 0 | 140 | 0 |
| D | 0 | 140 | 0 |
| Quadrant | Total seconds | Saturated seconds | Saturation percentage |
|---|---|---|---|
| A | 6861 | 55 | 0.801632% |
| B | 6862 | 246 | 3.584961% |
| C | 6862 | 90 | 1.311571% |
| D | 6862 | 41 | 0.597493% |
Noise dominated data is calculated using 1-second bins in cleaned event files. If a bin has >2000 counts, and if more than 50% of those come from <1% of pixels, then it is considered to be noise-dominated and hence unusable.
| Quadrant | # 1 sec bins | Bins with >0 counts | Bins with >2000 counts | High rate bins dominated by noise | Noise dominated (total time) | Noise dominated (detector-on time) | Marked lightcurve |
|---|---|---|---|---|---|---|---|
| A | 7231 | 6862 | 0 | 0 | 0.00% | 0.00% | 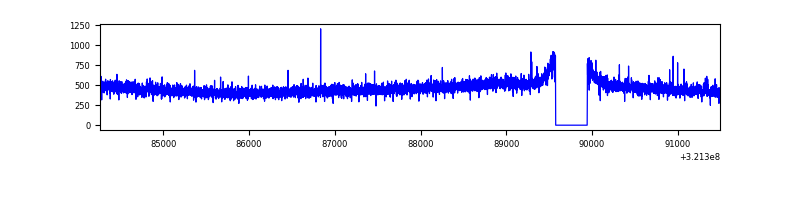 |
| B | 7232 | 6863 | 96 | 96 | 1.33% | 1.40% | 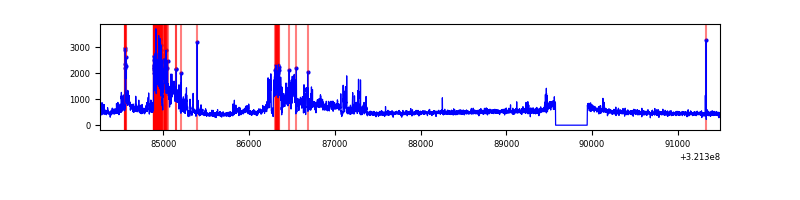 |
| C | 7232 | 6863 | 2 | 2 | 0.03% | 0.03% | 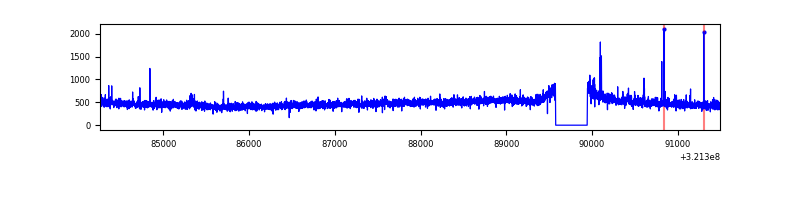 |
| D | 7232 | 6863 | 9 | 9 | 0.12% | 0.13% | 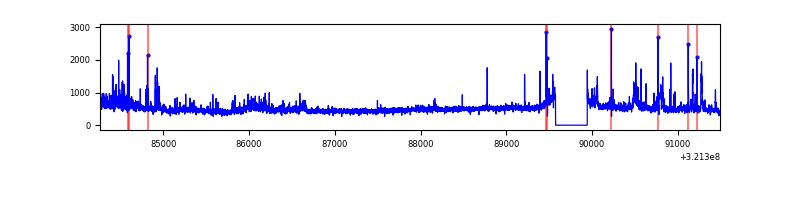 |
Top three noisy pixels from each quadrant. If the there are fewer than three noisy pixels in the level2.evt file, extra rows are filled as -1
| Pixel properties | Quadrant properties | ||||||
|---|---|---|---|---|---|---|---|
| Quadrant | DetID | PixID | Counts | Sigma | Mean | Median | Sigma |
| A | 13 | 254 | 11268 | 63.53 | 818 | 801 | 164.8 |
| A | 3 | 137 | 7055 | 37.96 | 818 | 801 | 164.8 |
| A | 0 | 226 | 6933 | 37.22 | 818 | 801 | 164.8 |
| B | 0 | 197 | 1142811 | 7482.34 | 811 | 794 | 152.6 |
| B | 0 | 189 | 42796 | 275.19 | 811 | 794 | 152.6 |
| B | 12 | 111 | 17723 | 110.92 | 811 | 794 | 152.6 |
| C | 14 | 238 | 124893 | 682.81 | 781 | 784 | 181.8 |
| C | 7 | 247 | 66262 | 360.24 | 781 | 784 | 181.8 |
| C | 0 | 239 | 57175 | 310.25 | 781 | 784 | 181.8 |
| D | 8 | 195 | 353325 | 1840.88 | 792 | 767 | 191.5 |
| D | 1 | 52 | 176537 | 917.78 | 792 | 767 | 191.5 |
| D | 7 | 38 | 52049 | 267.77 | 792 | 767 | 191.5 |
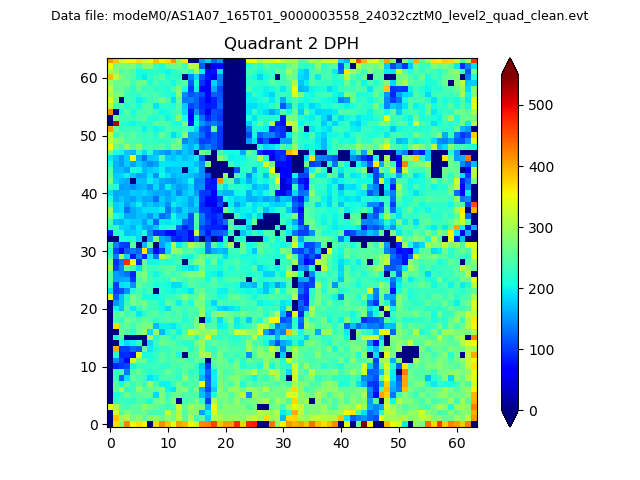
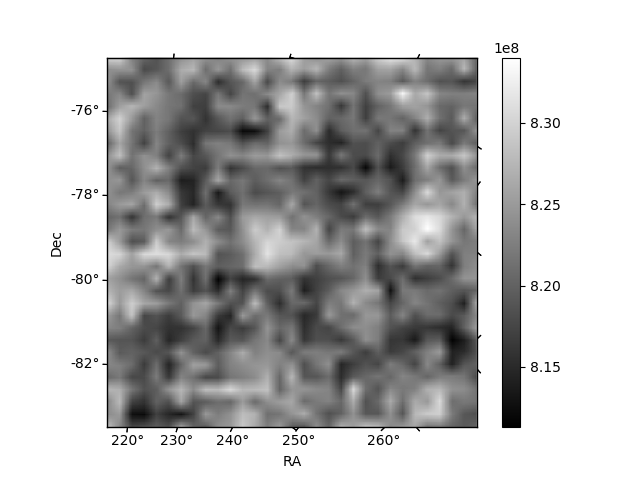
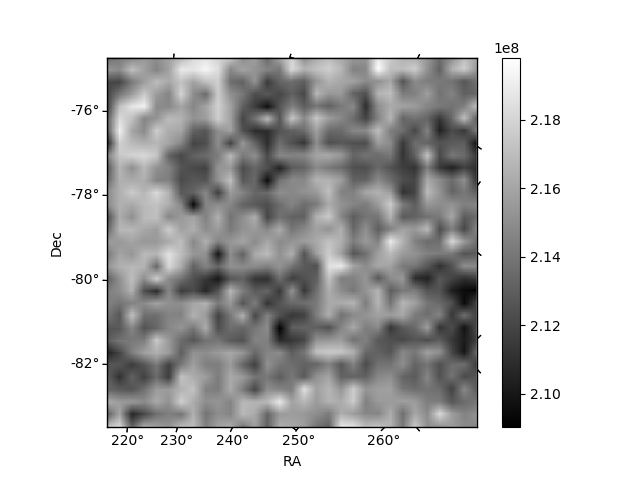
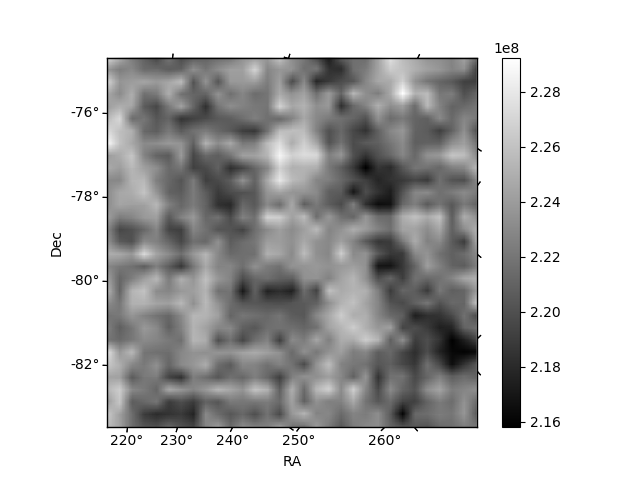
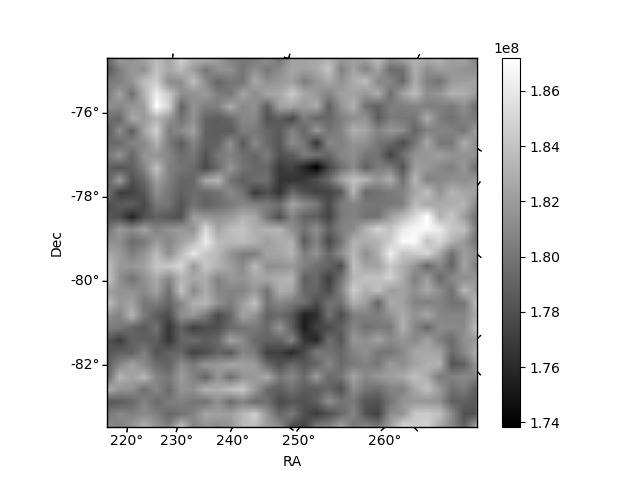
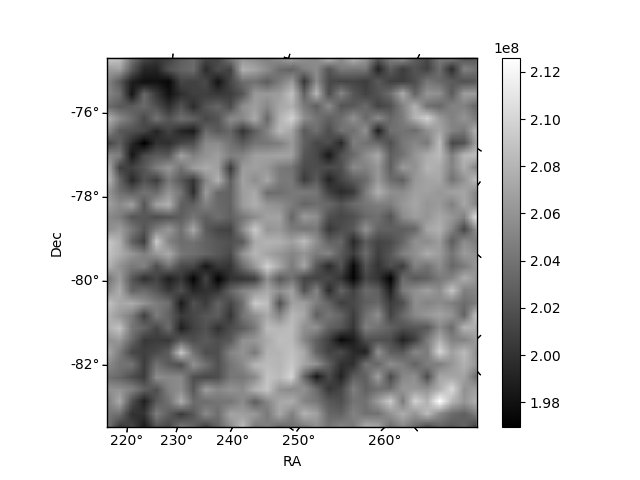
Histogram calculated using DETX and DETY for each event in the final _common_clean file
| Quadrant A | 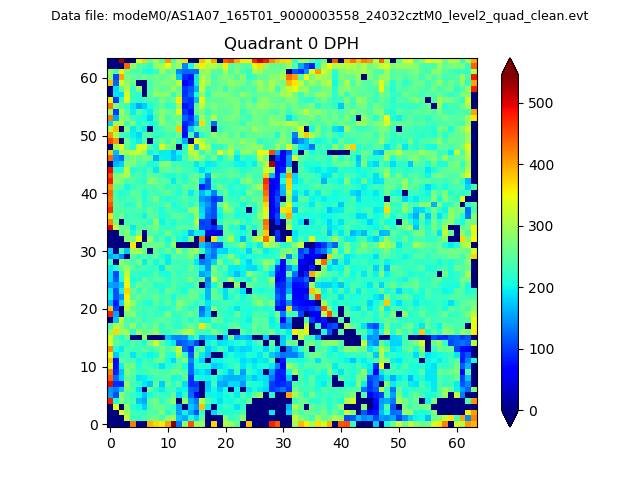 |
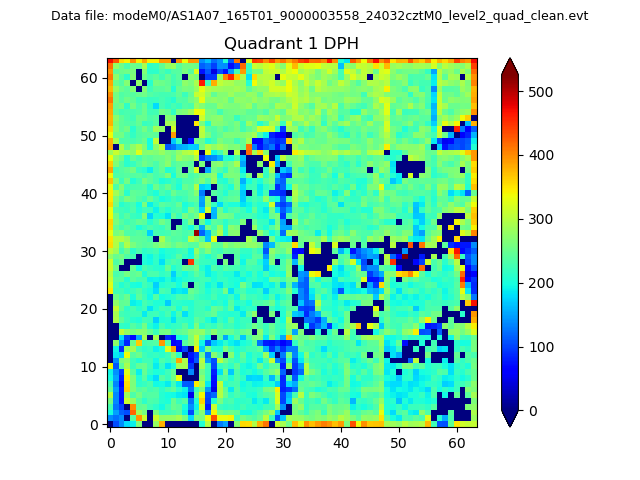 |
Quadrant B |
|---|---|---|---|
| Quadrant D | 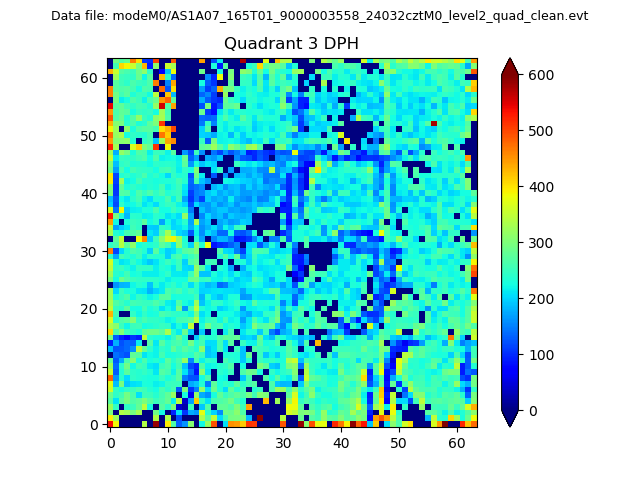 |
 |
Quadrant C |
| Plot type | Count rate plots | Images |
|---|---|---|
| Comparison with Poisson distribution Blue bars denote a histogram of data divided into 1 sec bins. Red curve is a Poisson curve with rate = median count rate of data. |
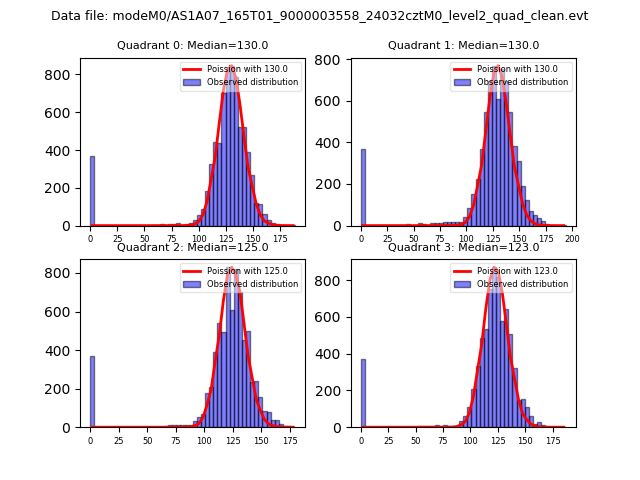 |
 |
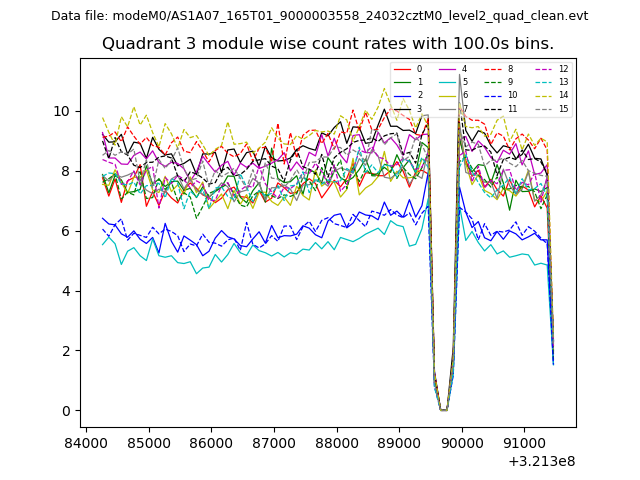
| Quadrant-wise count rates Data is divided into 100 sec bins |
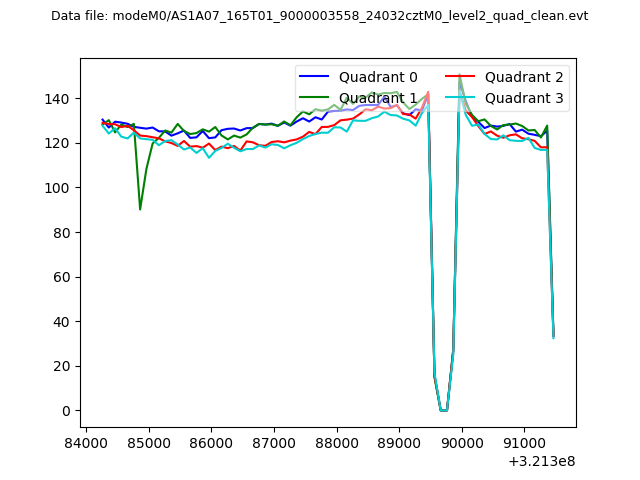 |
|
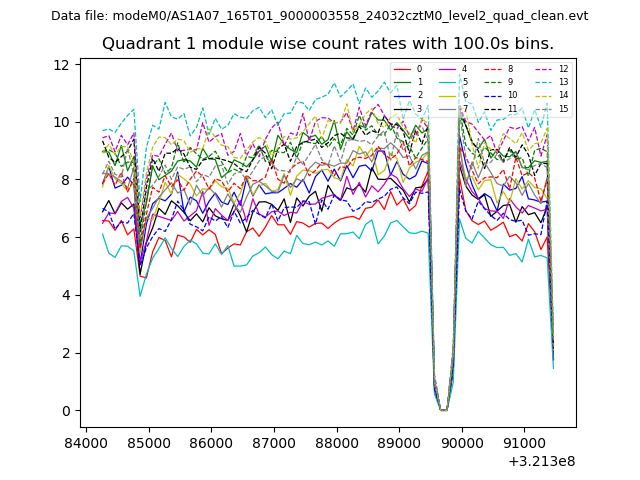
| Module-wise count rates for Quadrant A Data is divided into 100 sec bins |
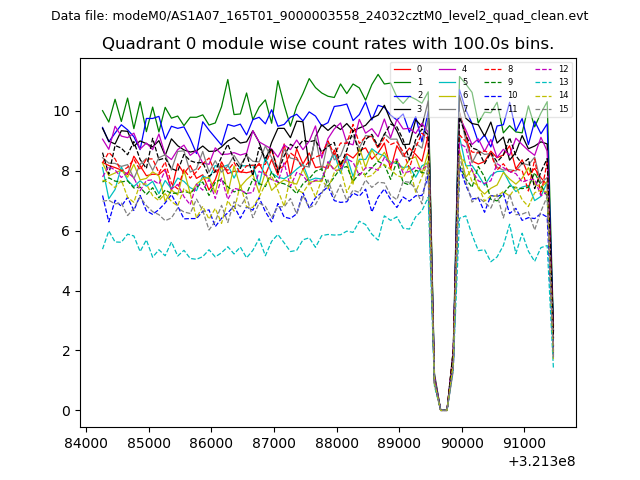 |
 |
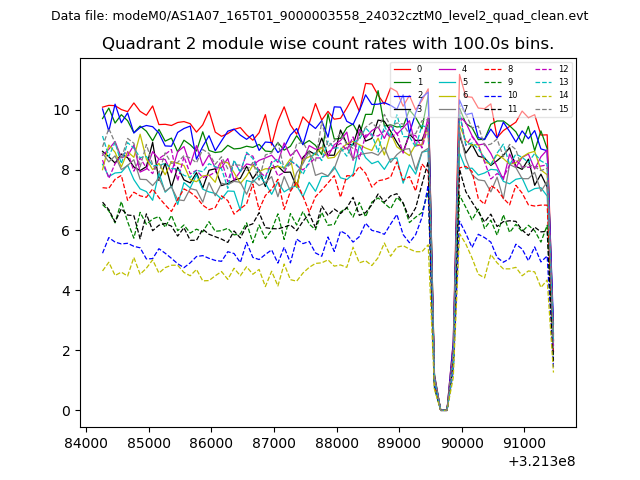
| Module-wise count rates for Quadrant B Data is divided into 100 sec bins |
 |
 |
| Module-wise count rates for Quadrant C Data is divided into 100 sec bins |
 |
 |
| Module-wise count rates for Quadrant D Data is divided into 100 sec bins |
 |
 |
| Parameter | Plot |
|---|---|
| CZT HV Monitor | 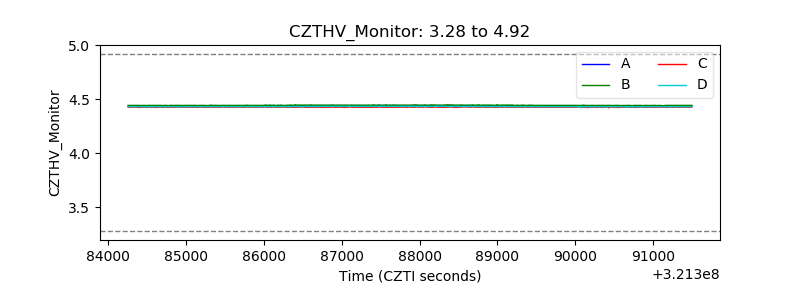 |
| D_VDD | 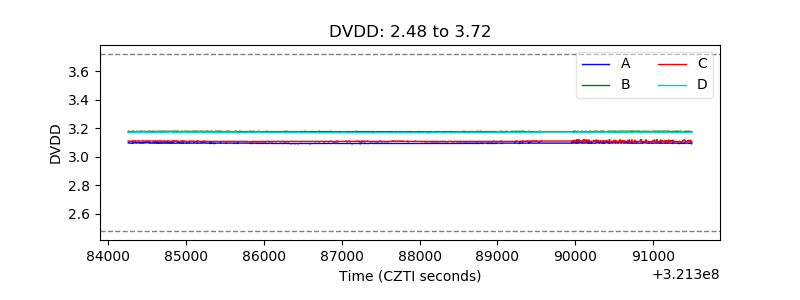 |
| Temperature 1 |  |
| Veto HV Monitor | 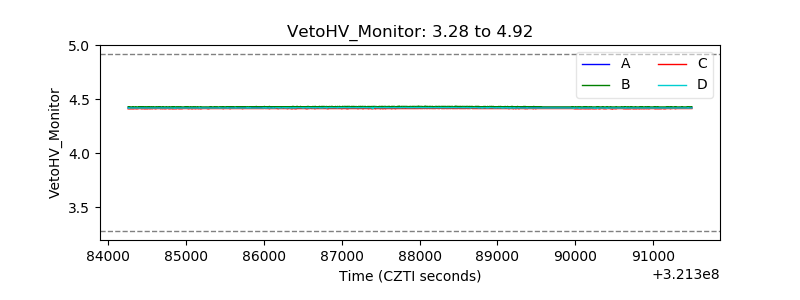 |
| Veto LLD | 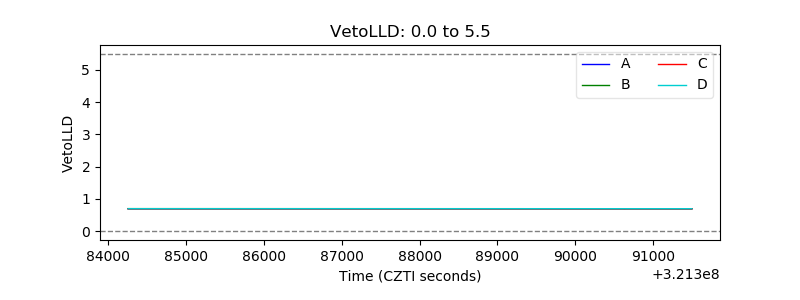 |
| Alpha Counter | 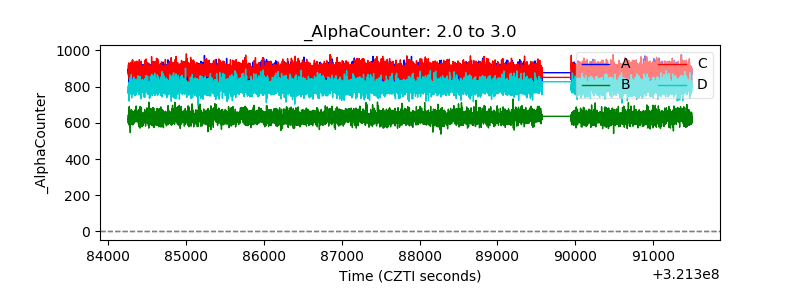 |
| _CPM_Rate | 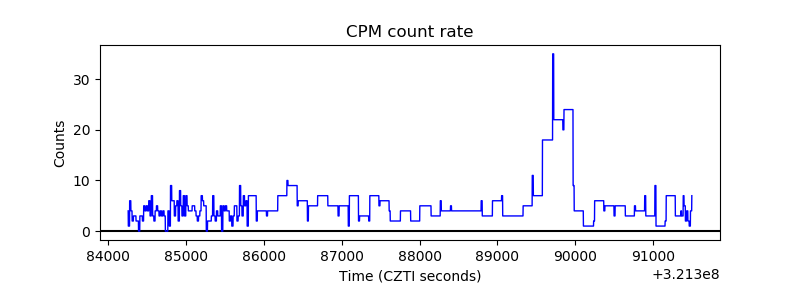 |
| CZT Counter | 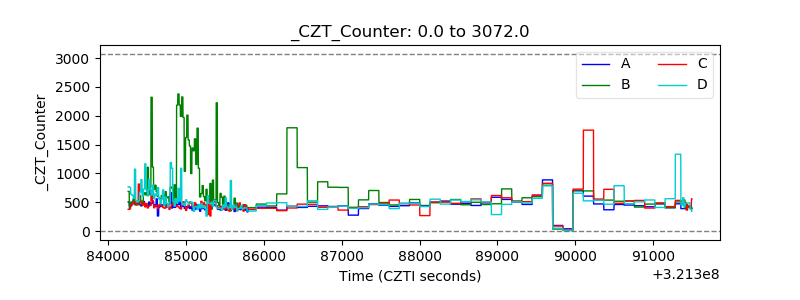 |
| +2.5 Volts monitor |  |
| +5 Volts monitor |  |
| _ROLL_ROT | 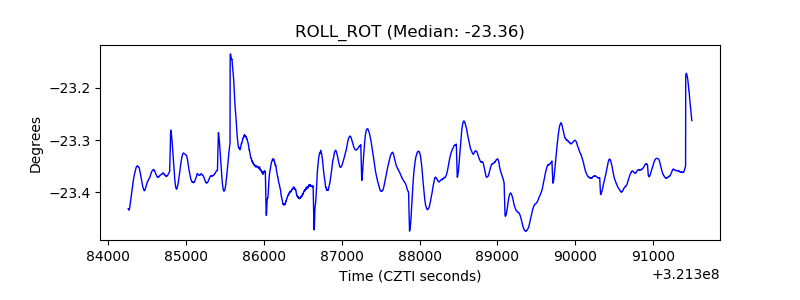 |
| _Roll_DEC | 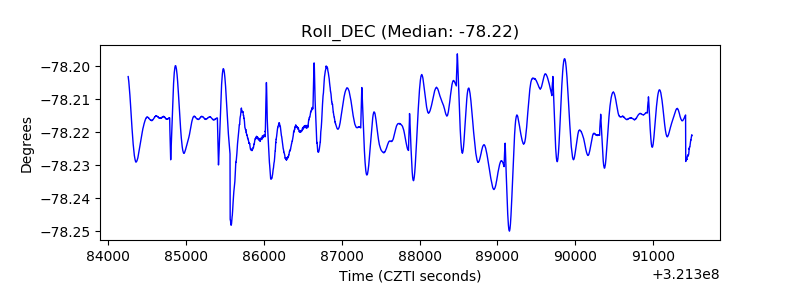 |
| _Roll_RA | 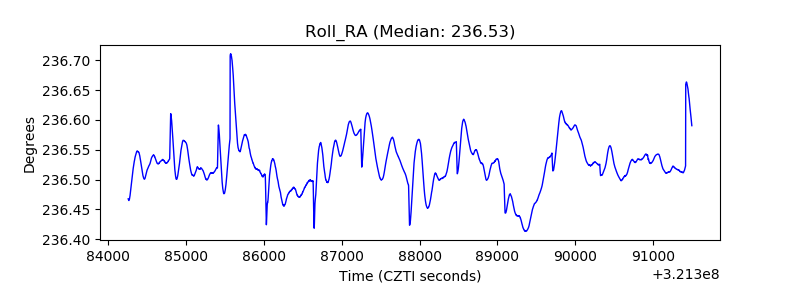 |
| Veto Counter | 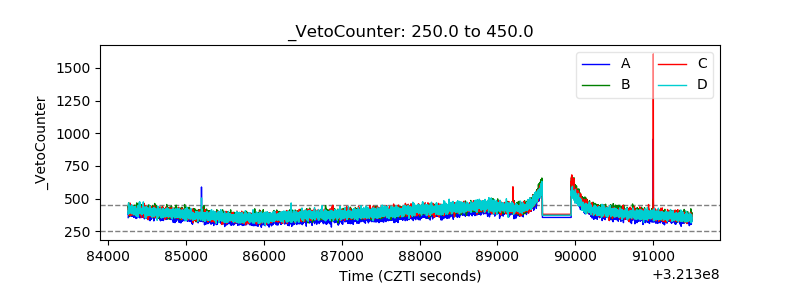 |