| Param | Original file | Final file |
|---|---|---|
| Filename | modeM0/AS1A07_165T01_9000003558_24036cztM0_level2.evt | modeM0/AS1A07_165T01_9000003558_24036cztM0_level2_quad_clean.evt |
| Size (bytes) | 1,227,389,760 | 341,144,640 |
| Size | 1.1 GB | 325.3 MB |
| Events in quadrant A | 8,270,570 | 2,307,643 |
| Events in quadrant B | 8,524,463 | 2,350,065 |
| Events in quadrant C | 8,521,733 | 2,239,399 |
| Events in quadrant D | 10,622,134 | 2,180,743 |
| Mode M9 | |||
|---|---|---|---|
| Quadrant | BADHDUFLAG | Total packets | Discarded packets |
| A | 0 | 20 | 0 |
| B | 0 | 20 | 0 |
| C | 0 | 20 | 0 |
| D | 0 | 20 | 0 |
| Mode M0 | |||
|---|---|---|---|
| Quadrant | BADHDUFLAG | Total packets | Discarded packets |
| A | 0 | 36848 | 3 |
| B | 0 | 37246 | 3 |
| C | 0 | 36937 | 3 |
| D | 0 | 43795 | 3 |
| Mode SS | |||
|---|---|---|---|
| Quadrant | BADHDUFLAG | Total packets | Discarded packets |
| A | 0 | 368 | 0 |
| B | 0 | 368 | 0 |
| C | 0 | 368 | 0 |
| D | 0 | 368 | 0 |
| Quadrant | Total seconds | Saturated seconds | Saturation percentage |
|---|---|---|---|
| A | 18237 | 59 | 0.323518% |
| B | 18238 | 88 | 0.482509% |
| C | 18238 | 157 | 0.860840% |
| D | 18238 | 215 | 1.178857% |
Noise dominated data is calculated using 1-second bins in cleaned event files. If a bin has >2000 counts, and if more than 50% of those come from <1% of pixels, then it is considered to be noise-dominated and hence unusable.
| Quadrant | # 1 sec bins | Bins with >0 counts | Bins with >2000 counts | High rate bins dominated by noise | Noise dominated (total time) | Noise dominated (detector-on time) | Marked lightcurve |
|---|---|---|---|---|---|---|---|
| A | 20132 | 18240 | 0 | 0 | 0.00% | 0.00% | 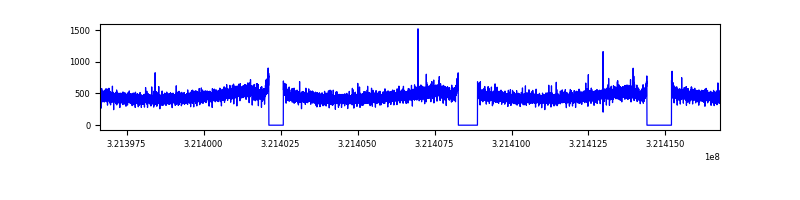 |
| B | 20133 | 18241 | 4 | 4 | 0.02% | 0.02% | 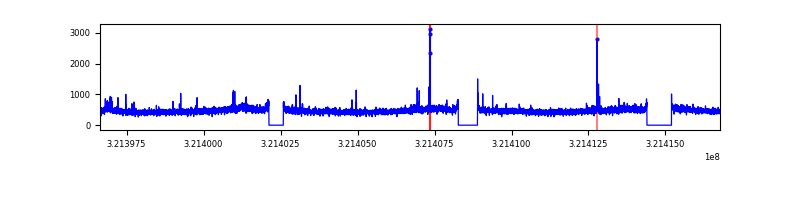 |
| C | 20133 | 18241 | 0 | 0 | 0.00% | 0.00% | 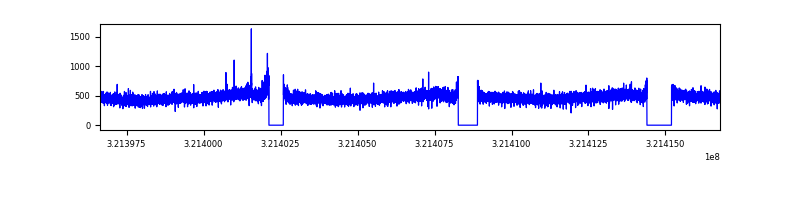 |
| D | 20133 | 18241 | 141 | 141 | 0.70% | 0.77% | 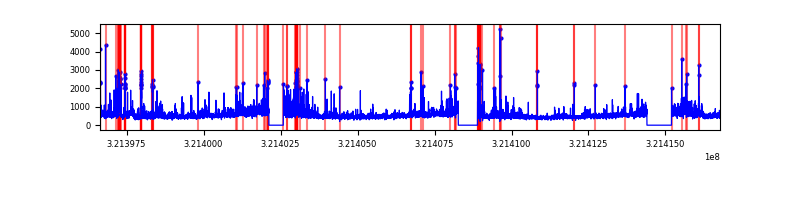 |
Top three noisy pixels from each quadrant. If the there are fewer than three noisy pixels in the level2.evt file, extra rows are filled as -1
| Pixel properties | Quadrant properties | ||||||
|---|---|---|---|---|---|---|---|
| Quadrant | DetID | PixID | Counts | Sigma | Mean | Median | Sigma |
| A | 13 | 254 | 28559 | 61.72 | 2142 | 2091 | 428.9 |
| A | 3 | 137 | 18571 | 38.43 | 2142 | 2091 | 428.9 |
| A | 0 | 226 | 18204 | 37.57 | 2142 | 2091 | 428.9 |
| B | 12 | 111 | 48769 | 115.87 | 2145 | 2087 | 402.9 |
| B | 11 | 111 | 42764 | 100.96 | 2145 | 2087 | 402.9 |
| B | 14 | 111 | 37102 | 86.91 | 2145 | 2087 | 402.9 |
| C | 14 | 238 | 330005 | 681.09 | 2066 | 2070 | 481.5 |
| C | 7 | 247 | 102228 | 208.02 | 2066 | 2070 | 481.5 |
| C | 0 | 239 | 20735 | 38.77 | 2066 | 2070 | 481.5 |
| D | 1 | 52 | 1268769 | 2510.83 | 2082 | 2019 | 504.5 |
| D | 8 | 195 | 1233726 | 2441.37 | 2082 | 2019 | 504.5 |
| D | 2 | 234 | 85105 | 164.69 | 2082 | 2019 | 504.5 |
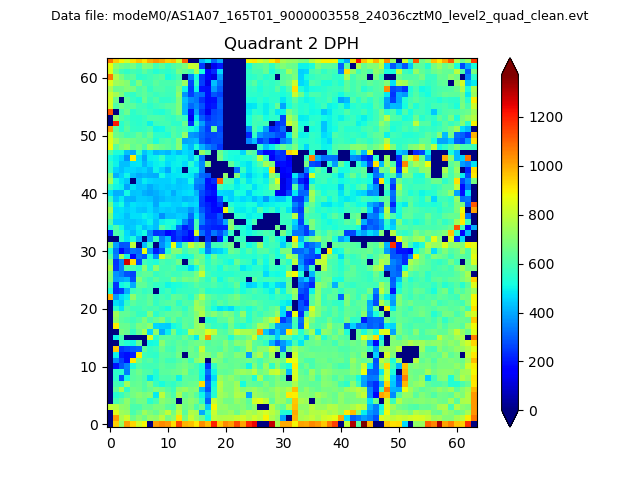
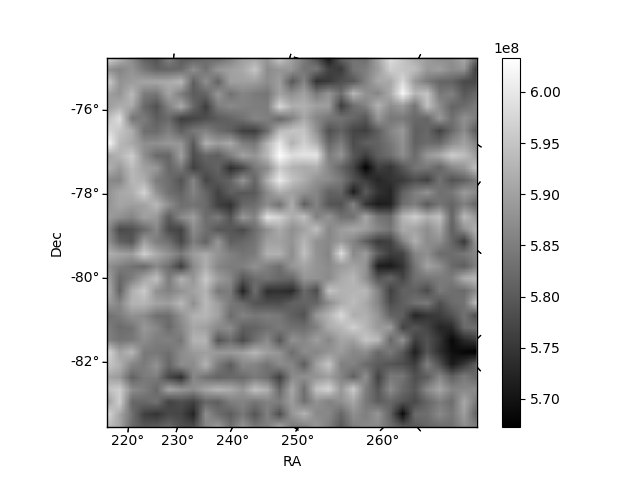
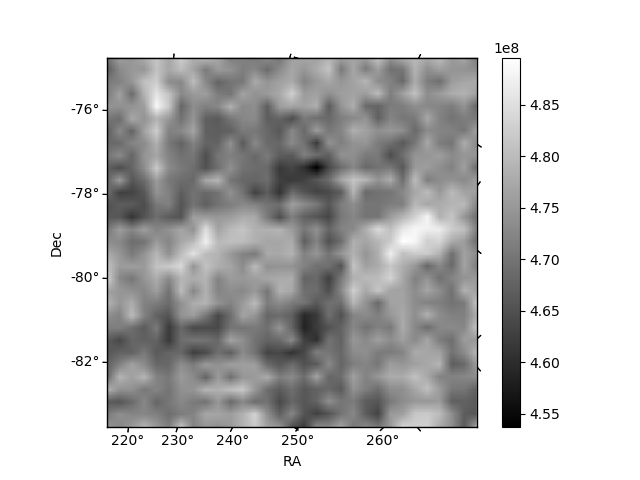
Histogram calculated using DETX and DETY for each event in the final _common_clean file
| Quadrant A | 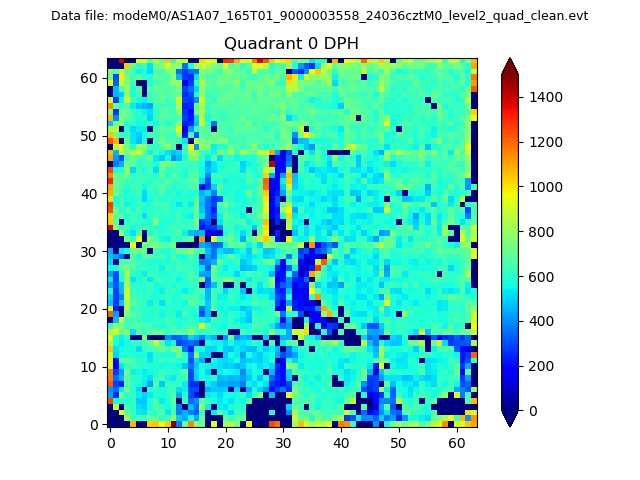 |
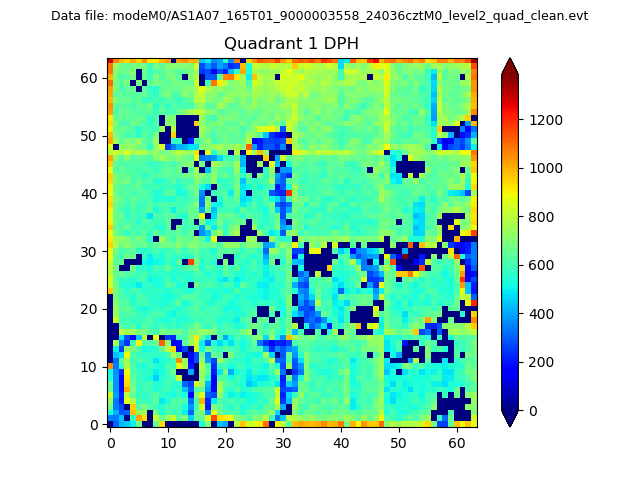 |
Quadrant B |
|---|---|---|---|
| Quadrant D | 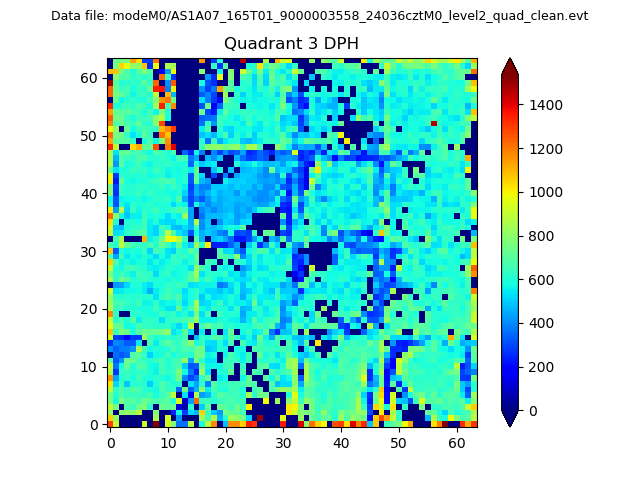 |
 |
Quadrant C |
| Plot type | Count rate plots | Images |
|---|---|---|
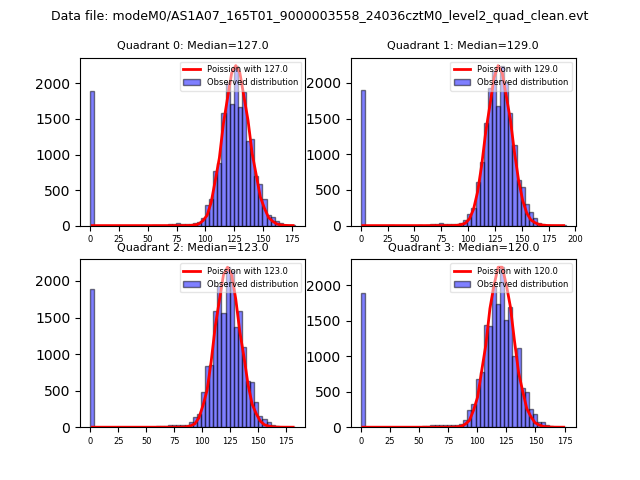
| Comparison with Poisson distribution Blue bars denote a histogram of data divided into 1 sec bins. Red curve is a Poisson curve with rate = median count rate of data. |
 |
 |
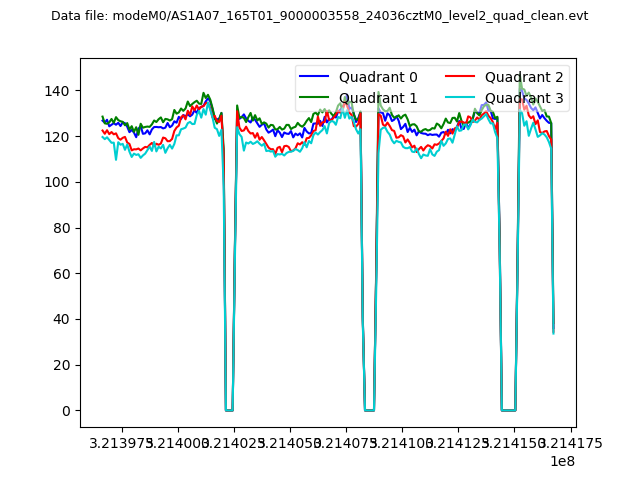
| Quadrant-wise count rates Data is divided into 100 sec bins |
 |
|
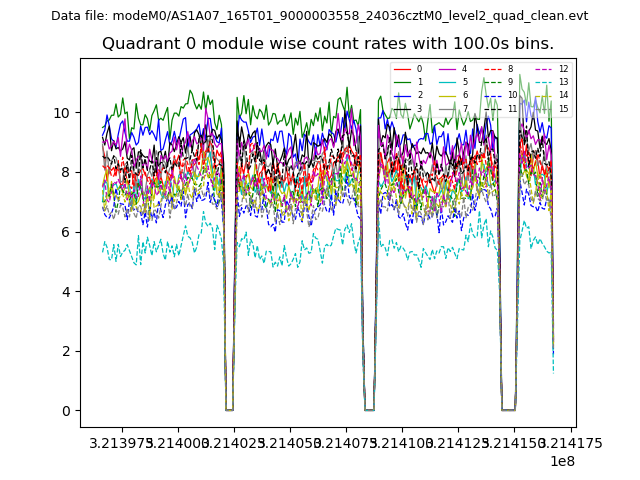
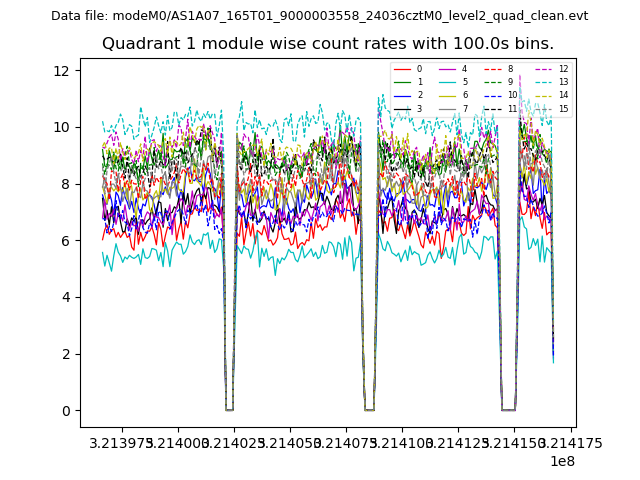
| Module-wise count rates for Quadrant A Data is divided into 100 sec bins |
 |
 |
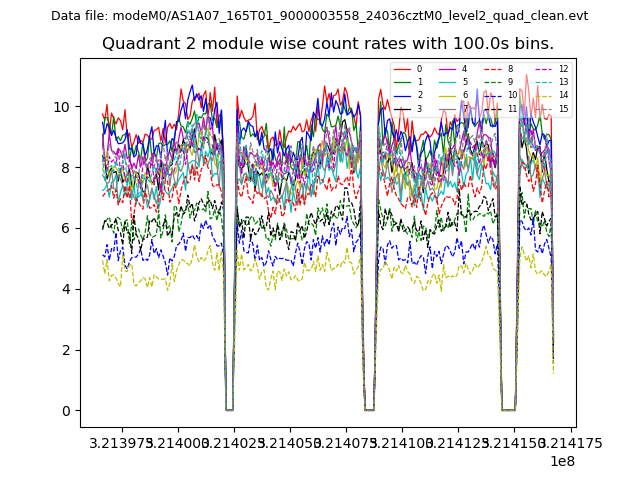
| Module-wise count rates for Quadrant B Data is divided into 100 sec bins |
 |
 |
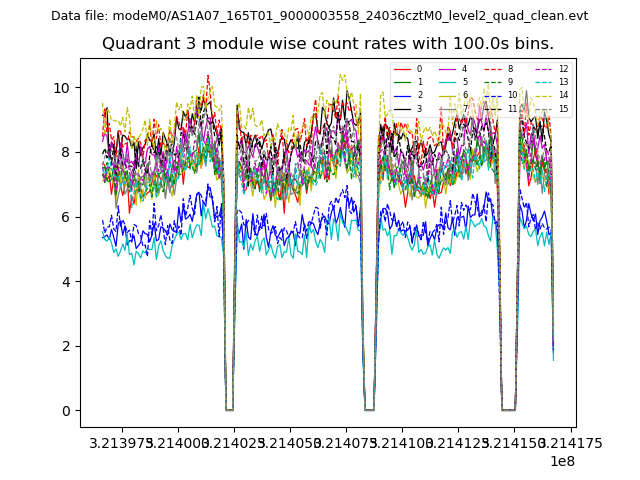
| Module-wise count rates for Quadrant C Data is divided into 100 sec bins |
 |
 |
| Module-wise count rates for Quadrant D Data is divided into 100 sec bins |
 |
 |
| Parameter | Plot |
|---|---|
| CZT HV Monitor |  |
| D_VDD | 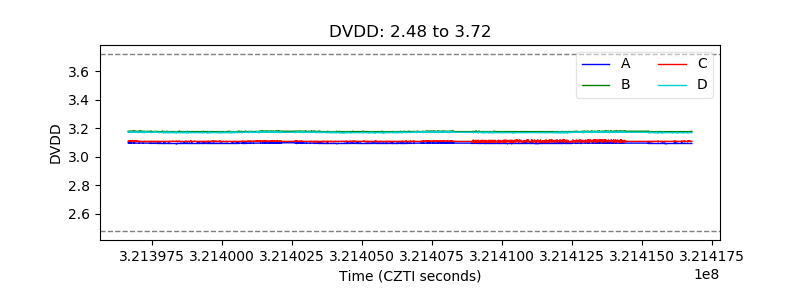 |
| Temperature 1 | 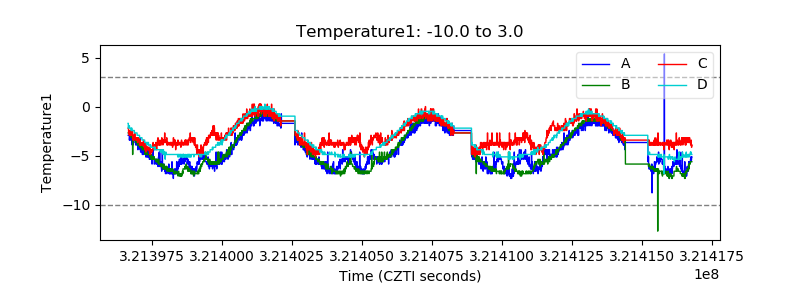 |
| Veto HV Monitor | 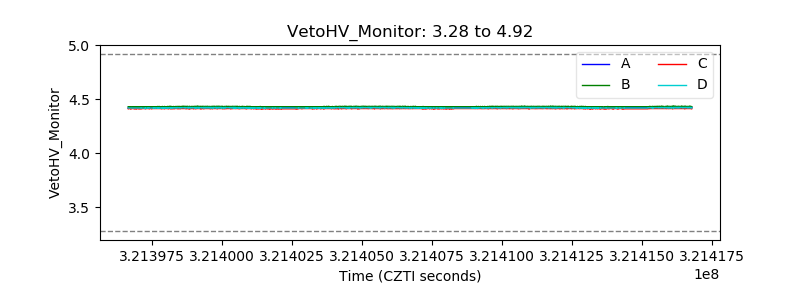 |
| Veto LLD | 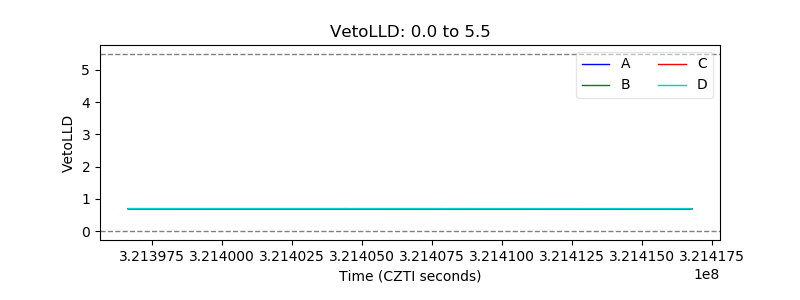 |
| Alpha Counter | 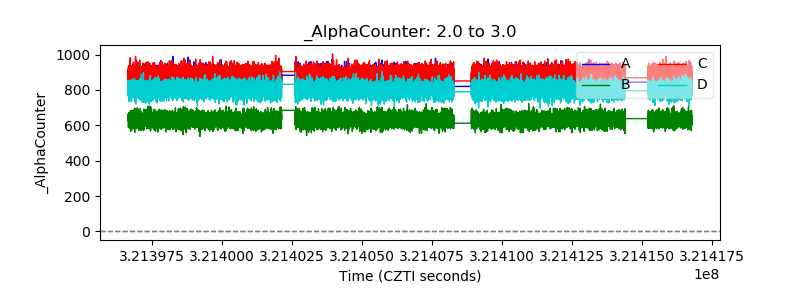 |
| _CPM_Rate | 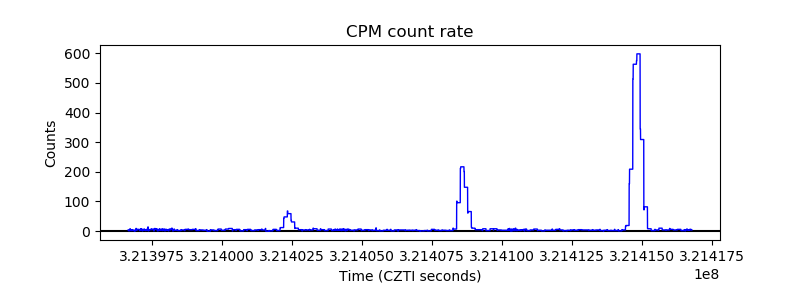 |
| CZT Counter | 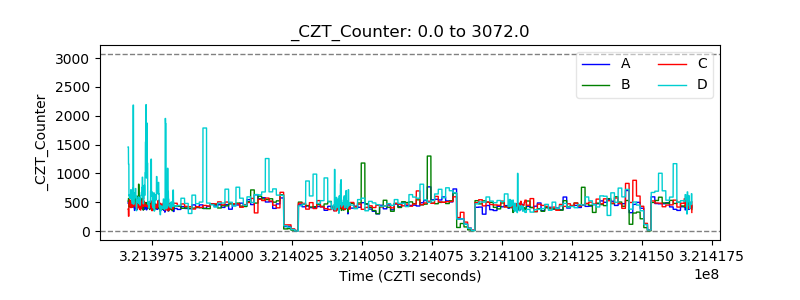 |
| +2.5 Volts monitor |  |
| +5 Volts monitor |  |
| _ROLL_ROT | 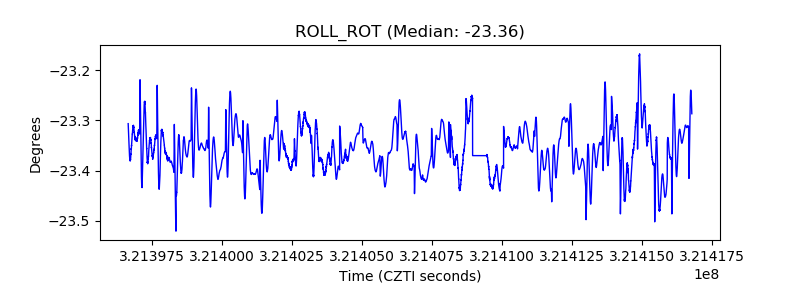 |
| _Roll_DEC | 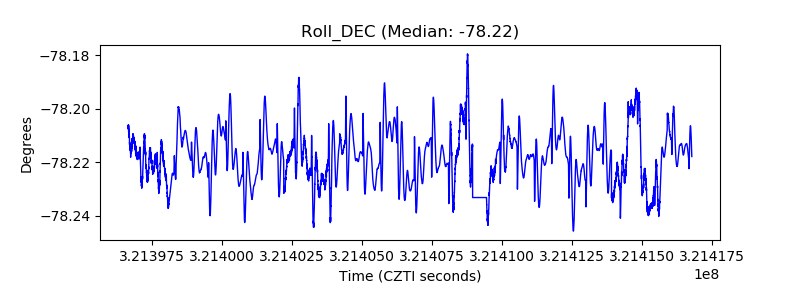 |
| _Roll_RA |  |
| Veto Counter | 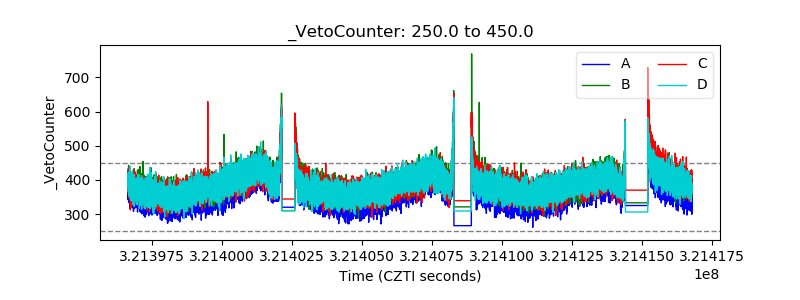 |