| Param | Original file | Final file |
|---|---|---|
| Filename | modeM0/AS1A07_165T01_9000003558_24037cztM0_level2.evt | modeM0/AS1A07_165T01_9000003558_24037cztM0_level2_quad_clean.evt |
| Size (bytes) | 497,687,040 | 131,564,160 |
| Size | 474.6 MB | 125.5 MB |
| Events in quadrant A | 3,159,760 | 890,521 |
| Events in quadrant B | 3,388,199 | 908,657 |
| Events in quadrant C | 3,323,216 | 871,275 |
| Events in quadrant D | 4,738,535 | 839,378 |
| Mode M9 | |||
|---|---|---|---|
| Quadrant | BADHDUFLAG | Total packets | Discarded packets |
| A | 0 | 11 | 0 |
| B | 0 | 12 | 0 |
| C | 0 | 12 | 0 |
| D | 0 | 12 | 0 |
| Mode M0 | |||
|---|---|---|---|
| Quadrant | BADHDUFLAG | Total packets | Discarded packets |
| A | 0 | 13805 | 2 |
| B | 0 | 14274 | 2 |
| C | 0 | 13931 | 2 |
| D | 0 | 18812 | 2 |
| Mode SS | |||
|---|---|---|---|
| Quadrant | BADHDUFLAG | Total packets | Discarded packets |
| A | 0 | 138 | 0 |
| B | 0 | 138 | 0 |
| C | 0 | 138 | 0 |
| D | 0 | 138 | 0 |
| Quadrant | Total seconds | Saturated seconds | Saturation percentage |
|---|---|---|---|
| A | 6821 | 29 | 0.425158% |
| B | 6821 | 47 | 0.689049% |
| C | 6821 | 79 | 1.158188% |
| D | 6821 | 51 | 0.747691% |
Noise dominated data is calculated using 1-second bins in cleaned event files. If a bin has >2000 counts, and if more than 50% of those come from <1% of pixels, then it is considered to be noise-dominated and hence unusable.
| Quadrant | # 1 sec bins | Bins with >0 counts | Bins with >2000 counts | High rate bins dominated by noise | Noise dominated (total time) | Noise dominated (detector-on time) | Marked lightcurve |
|---|---|---|---|---|---|---|---|
| A | 7746 | 6822 | 0 | 0 | 0.00% | 0.00% | 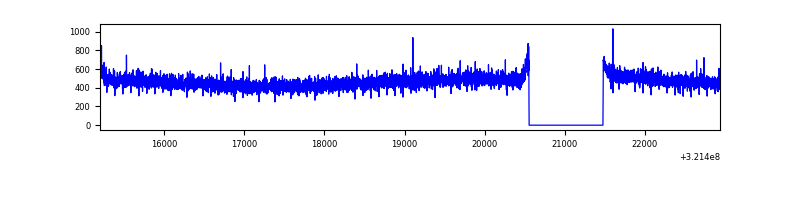 |
| B | 7746 | 6822 | 6 | 6 | 0.08% | 0.09% | 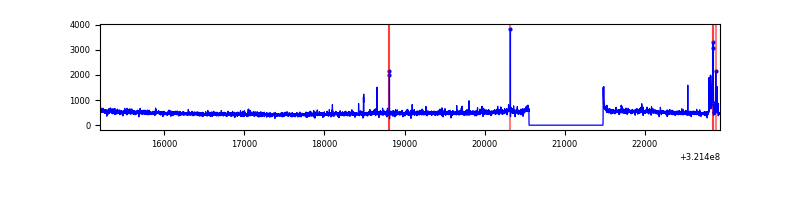 |
| C | 7746 | 6822 | 0 | 0 | 0.00% | 0.00% | 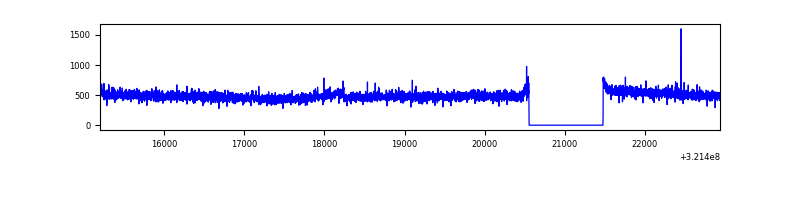 |
| D | 7746 | 6822 | 10 | 10 | 0.13% | 0.15% | 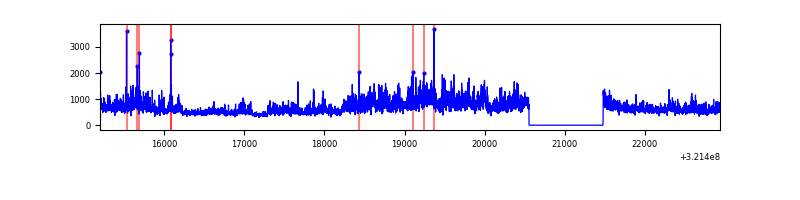 |
Top three noisy pixels from each quadrant. If the there are fewer than three noisy pixels in the level2.evt file, extra rows are filled as -1
| Pixel properties | Quadrant properties | ||||||
|---|---|---|---|---|---|---|---|
| Quadrant | DetID | PixID | Counts | Sigma | Mean | Median | Sigma |
| A | 13 | 254 | 10105 | 56.77 | 819 | 800 | 163.9 |
| A | 0 | 226 | 7046 | 38.11 | 819 | 800 | 163.9 |
| A | 3 | 137 | 6990 | 37.77 | 819 | 800 | 163.9 |
| B | 0 | 197 | 94811 | 607.31 | 823 | 803 | 154.8 |
| B | 7 | 202 | 41200 | 260.97 | 823 | 803 | 154.8 |
| B | 12 | 111 | 18616 | 115.08 | 823 | 803 | 154.8 |
| C | 14 | 238 | 126848 | 672.78 | 798 | 802 | 187.4 |
| C | 7 | 247 | 81161 | 428.92 | 798 | 802 | 187.4 |
| C | 13 | 61 | 5590 | 25.56 | 798 | 802 | 187.4 |
| D | 8 | 195 | 1583236 | 8202.38 | 800 | 777 | 192.9 |
| D | 1 | 52 | 53675 | 274.19 | 800 | 777 | 192.9 |
| D | 12 | 218 | 31582 | 159.67 | 800 | 777 | 192.9 |
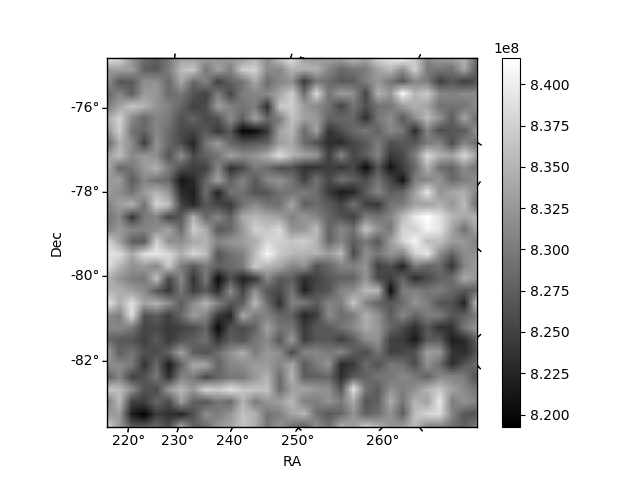
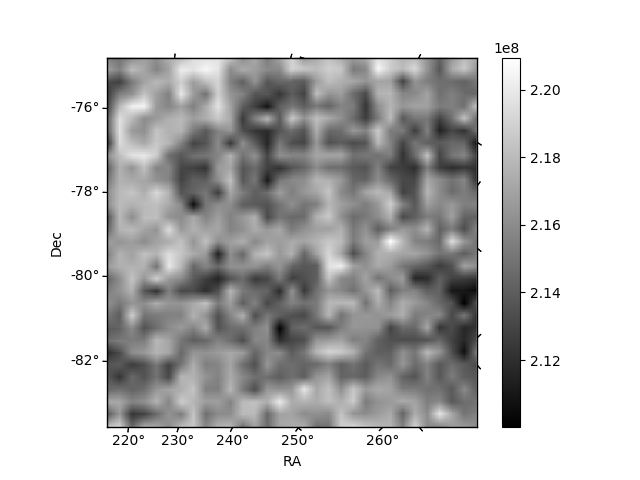
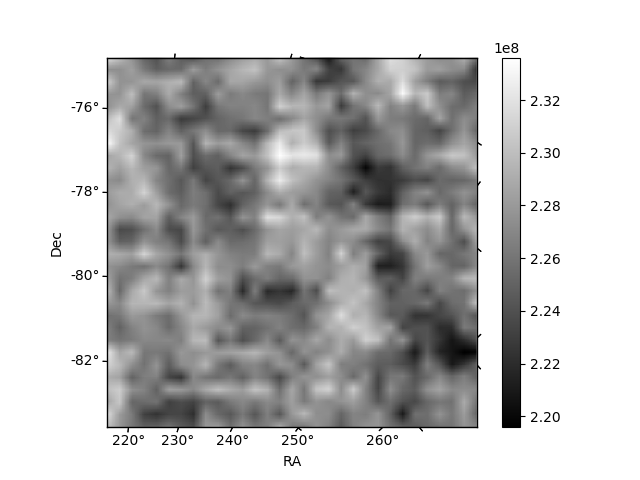
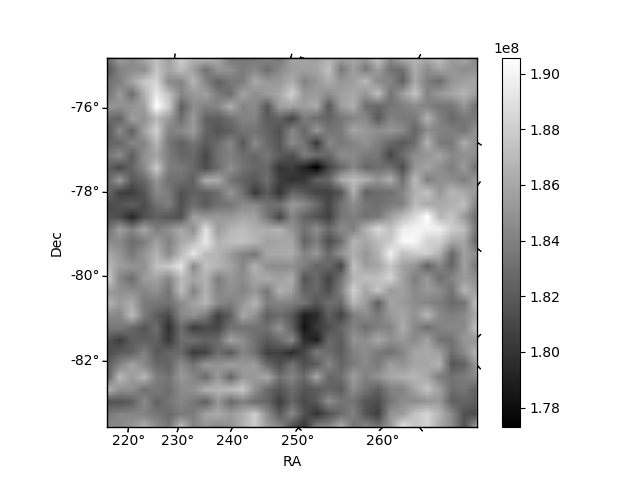
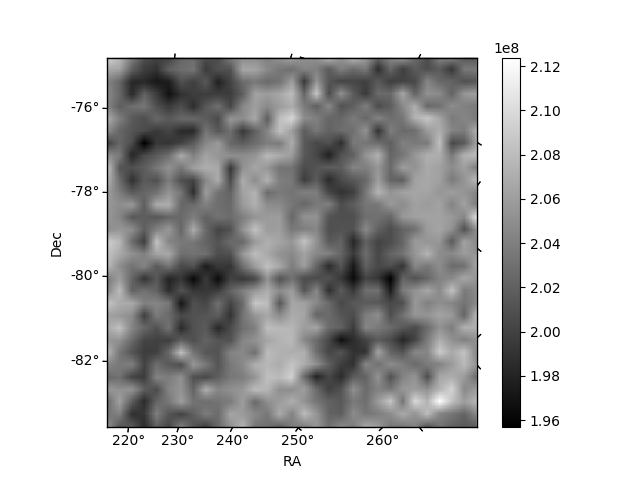
Histogram calculated using DETX and DETY for each event in the final _common_clean file
| Quadrant A | 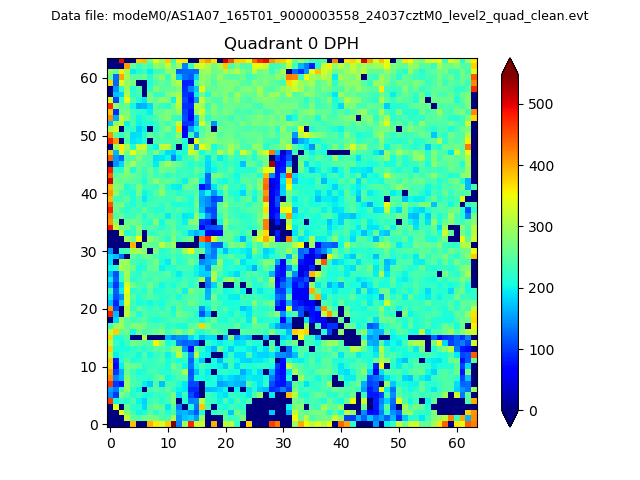 |
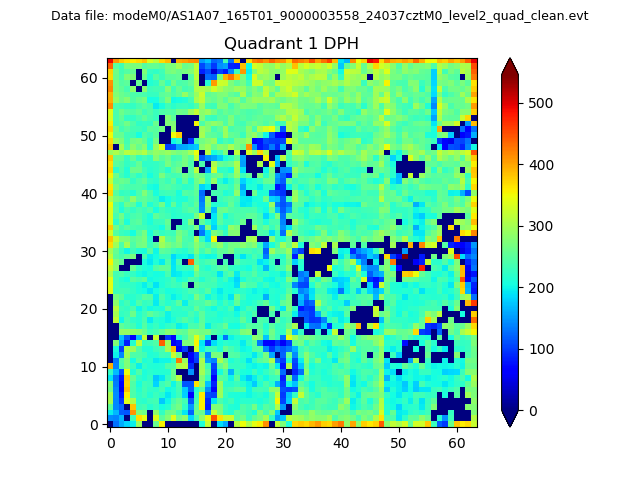 |
Quadrant B |
|---|---|---|---|
| Quadrant D |  |
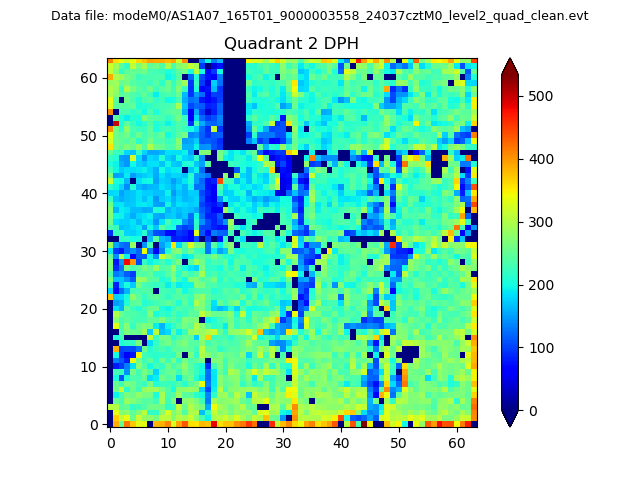 |
Quadrant C |
| Plot type | Count rate plots | Images |
|---|---|---|
| Comparison with Poisson distribution Blue bars denote a histogram of data divided into 1 sec bins. Red curve is a Poisson curve with rate = median count rate of data. |
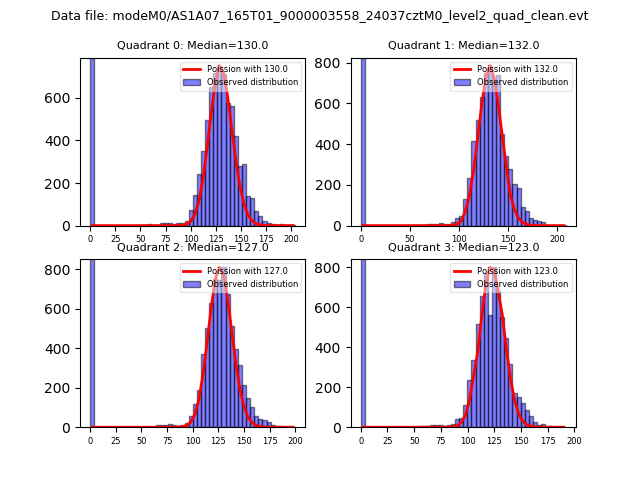 |
 |
| Quadrant-wise count rates Data is divided into 100 sec bins |
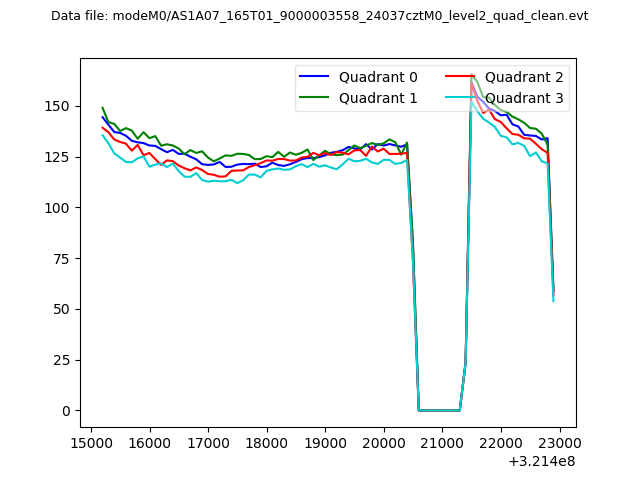 |
|
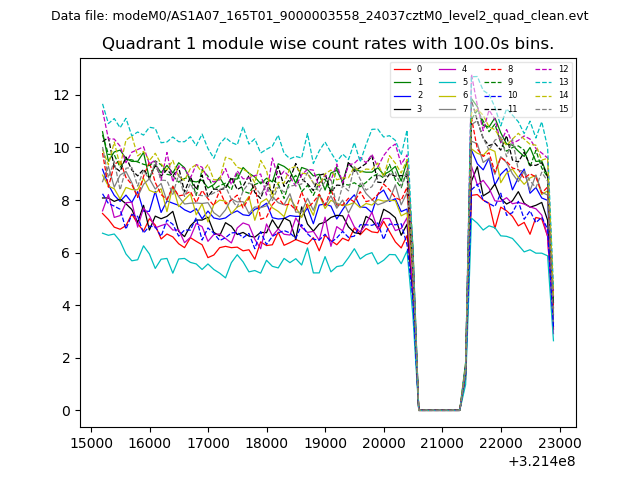
| Module-wise count rates for Quadrant A Data is divided into 100 sec bins |
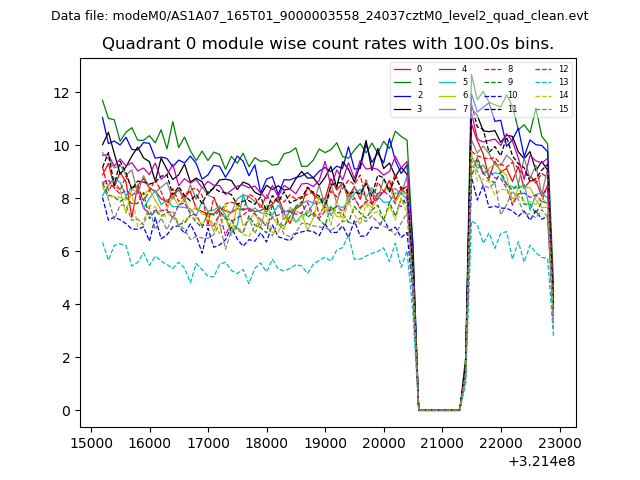 |
 |
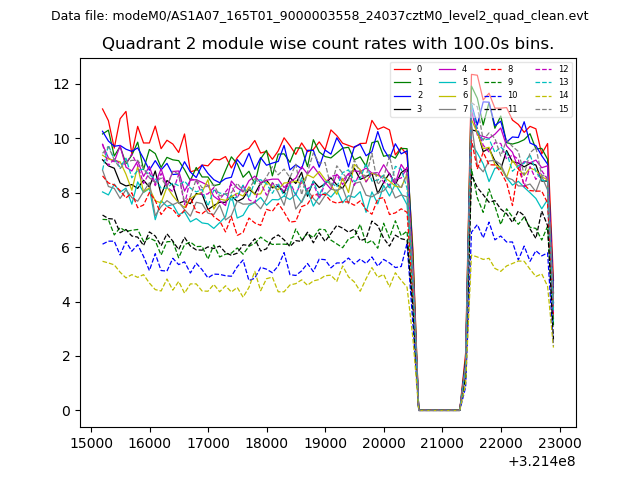
| Module-wise count rates for Quadrant B Data is divided into 100 sec bins |
 |
 |
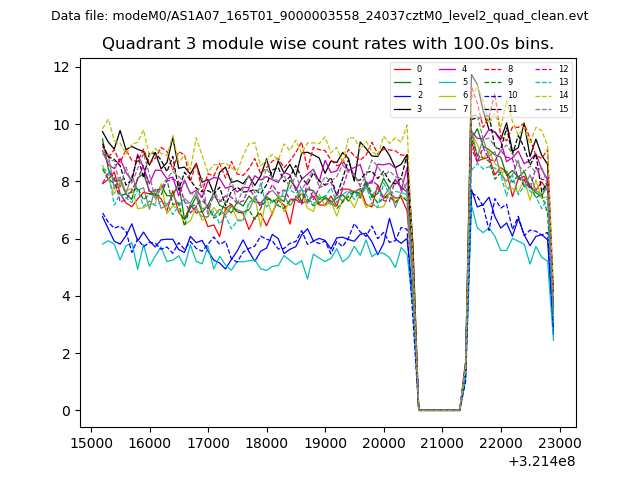
| Module-wise count rates for Quadrant C Data is divided into 100 sec bins |
 |
 |
| Module-wise count rates for Quadrant D Data is divided into 100 sec bins |
 |
 |
| Parameter | Plot |
|---|---|
| CZT HV Monitor | 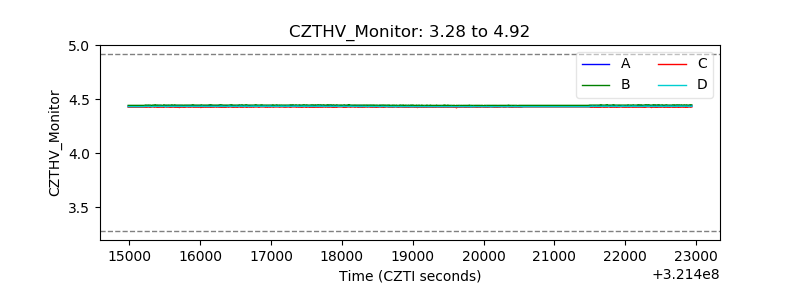 |
| D_VDD | 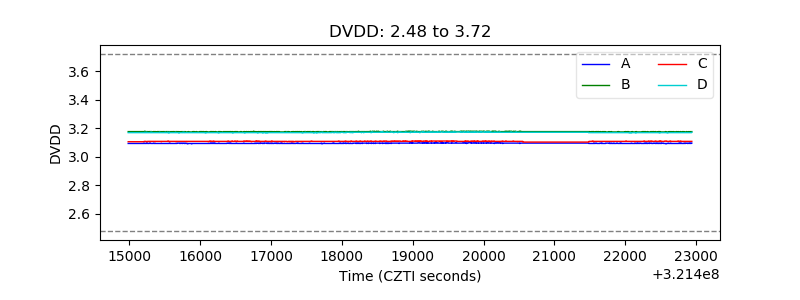 |
| Temperature 1 | 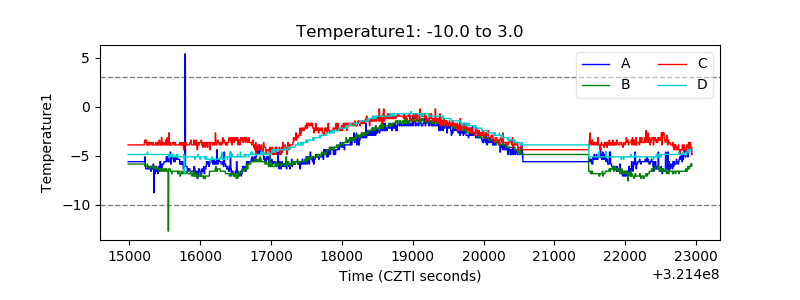 |
| Veto HV Monitor | 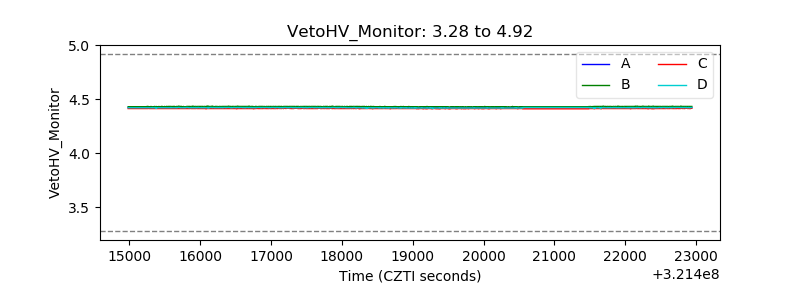 |
| Veto LLD | 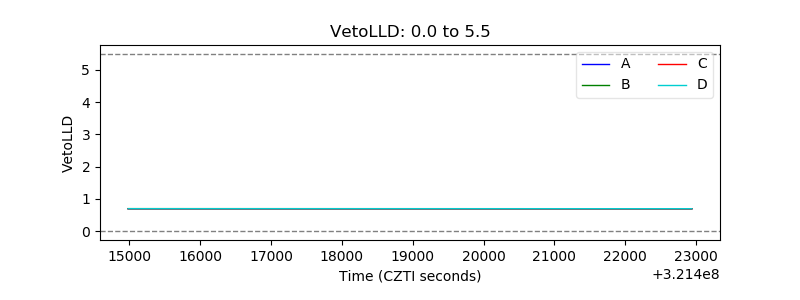 |
| Alpha Counter | 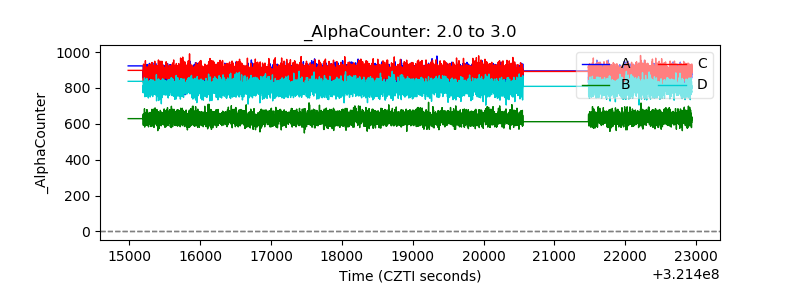 |
| _CPM_Rate | 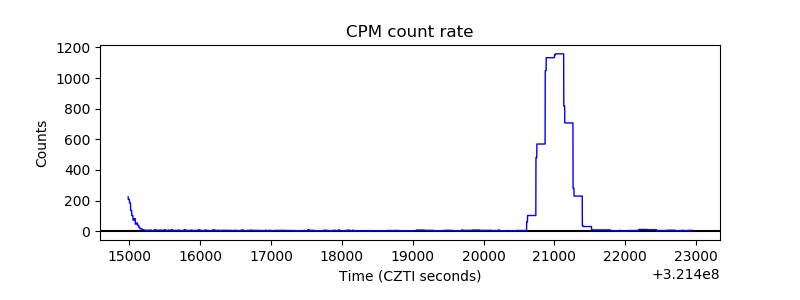 |
| CZT Counter | 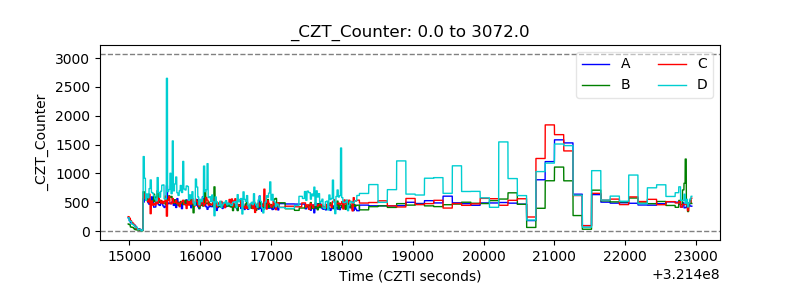 |
| +2.5 Volts monitor |  |
| +5 Volts monitor |  |
| _ROLL_ROT | 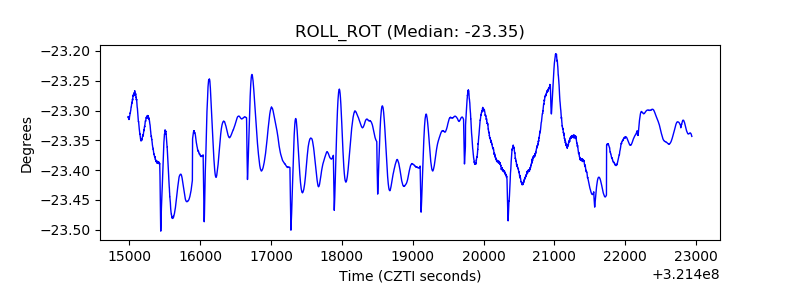 |
| _Roll_DEC | 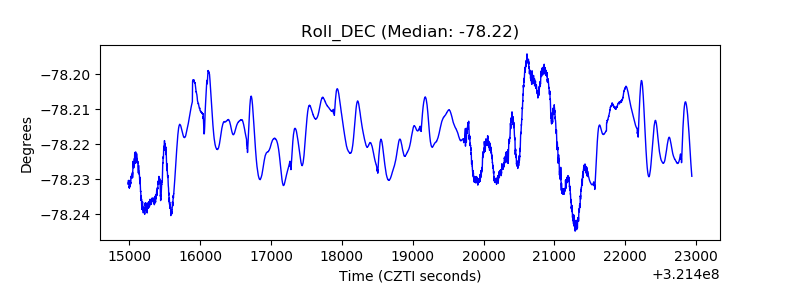 |
| _Roll_RA | 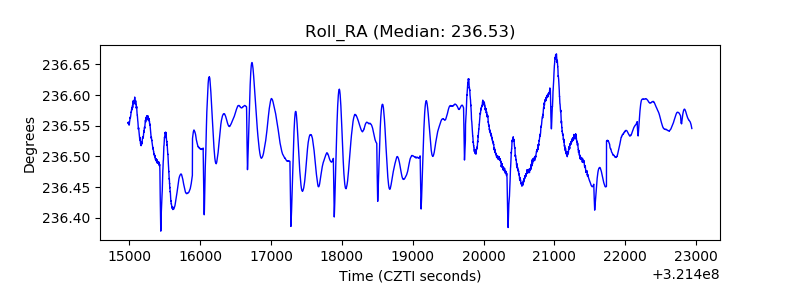 |
| Veto Counter | 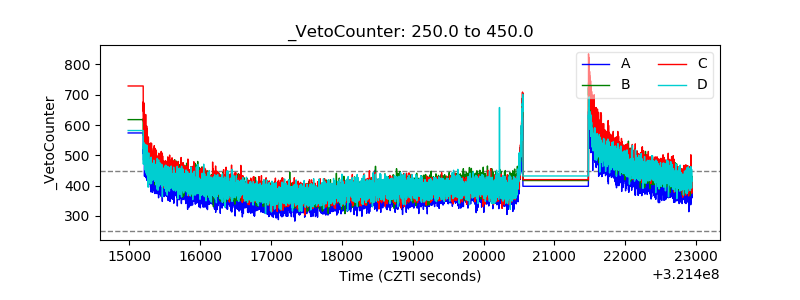 |