| Param | Original file | Final file |
|---|---|---|
| Filename | modeM0/AS1A07_165T01_9000003558_24038cztM0_level2.evt | modeM0/AS1A07_165T01_9000003558_24038cztM0_level2_quad_clean.evt |
| Size (bytes) | 481,872,960 | 125,498,880 |
| Size | 459.5 MB | 119.7 MB |
| Events in quadrant A | 2,972,412 | 855,631 |
| Events in quadrant B | 3,587,361 | 862,865 |
| Events in quadrant C | 3,110,579 | 838,682 |
| Events in quadrant D | 4,499,206 | 807,970 |
| Mode M9 | |||
|---|---|---|---|
| Quadrant | BADHDUFLAG | Total packets | Discarded packets |
| A | 0 | 10 | 0 |
| B | 0 | 10 | 0 |
| C | 0 | 10 | 0 |
| D | 0 | 10 | 0 |
| Mode M0 | |||
|---|---|---|---|
| Quadrant | BADHDUFLAG | Total packets | Discarded packets |
| A | 0 | 12795 | 1 |
| B | 0 | 14536 | 1 |
| C | 0 | 13091 | 1 |
| D | 0 | 17673 | 1 |
| Mode SS | |||
|---|---|---|---|
| Quadrant | BADHDUFLAG | Total packets | Discarded packets |
| A | 0 | 128 | 0 |
| B | 0 | 128 | 0 |
| C | 0 | 128 | 0 |
| D | 0 | 128 | 0 |
| Quadrant | Total seconds | Saturated seconds | Saturation percentage |
|---|---|---|---|
| A | 6243 | 19 | 0.304341% |
| B | 6244 | 164 | 2.626521% |
| C | 6244 | 63 | 1.008969% |
| D | 6244 | 96 | 1.537476% |
Noise dominated data is calculated using 1-second bins in cleaned event files. If a bin has >2000 counts, and if more than 50% of those come from <1% of pixels, then it is considered to be noise-dominated and hence unusable.
| Quadrant | # 1 sec bins | Bins with >0 counts | Bins with >2000 counts | High rate bins dominated by noise | Noise dominated (total time) | Noise dominated (detector-on time) | Marked lightcurve |
|---|---|---|---|---|---|---|---|
| A | 7303 | 6244 | 0 | 0 | 0.00% | 0.00% | 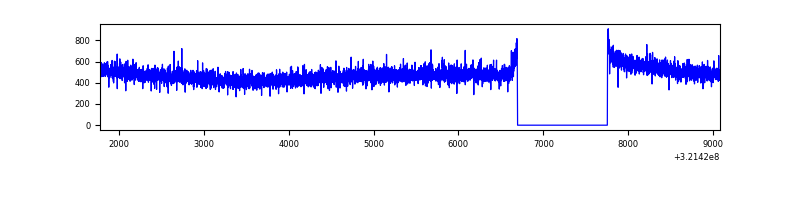 |
| B | 7304 | 6245 | 92 | 92 | 1.26% | 1.47% | 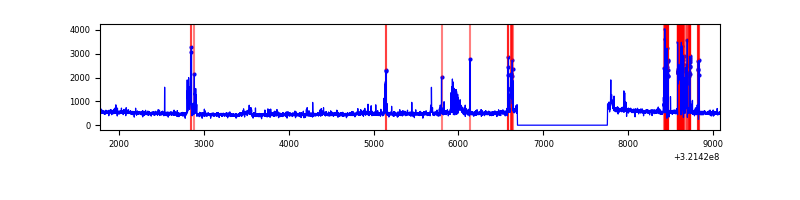 |
| C | 7304 | 6245 | 0 | 0 | 0.00% | 0.00% | 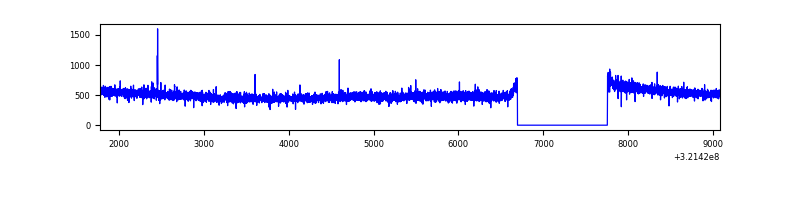 |
| D | 7304 | 6245 | 52 | 52 | 0.71% | 0.83% | 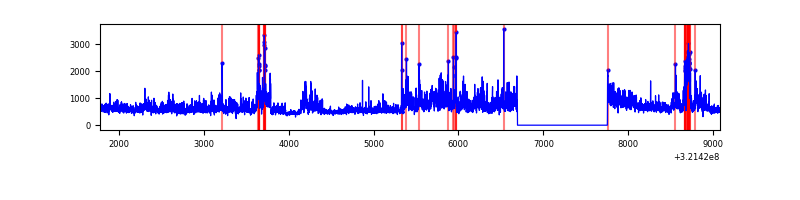 |
Top three noisy pixels from each quadrant. If the there are fewer than three noisy pixels in the level2.evt file, extra rows are filled as -1
| Pixel properties | Quadrant properties | ||||||
|---|---|---|---|---|---|---|---|
| Quadrant | DetID | PixID | Counts | Sigma | Mean | Median | Sigma |
| A | 13 | 254 | 9824 | 58.95 | 770 | 752 | 153.9 |
| A | 0 | 226 | 6729 | 38.84 | 770 | 752 | 153.9 |
| A | 3 | 137 | 6377 | 36.55 | 770 | 752 | 153.9 |
| B | 0 | 197 | 507985 | 3601.75 | 761 | 745 | 140.8 |
| B | 7 | 202 | 53011 | 371.12 | 761 | 745 | 140.8 |
| B | 0 | 230 | 17734 | 120.63 | 761 | 745 | 140.8 |
| C | 14 | 238 | 119756 | 685.99 | 751 | 759 | 173.5 |
| C | 7 | 247 | 53873 | 306.19 | 751 | 759 | 173.5 |
| C | 2 | 16 | 6584 | 33.58 | 751 | 759 | 173.5 |
| D | 8 | 195 | 1290008 | 7094.14 | 754 | 731 | 181.7 |
| D | 12 | 218 | 151014 | 826.92 | 754 | 731 | 181.7 |
| D | 2 | 82 | 109905 | 600.72 | 754 | 731 | 181.7 |
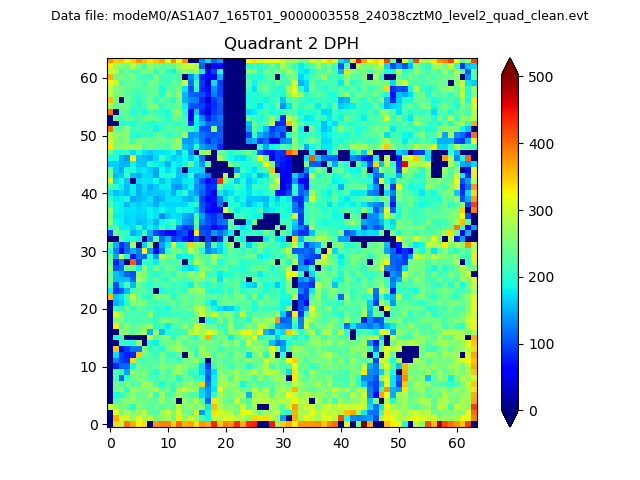
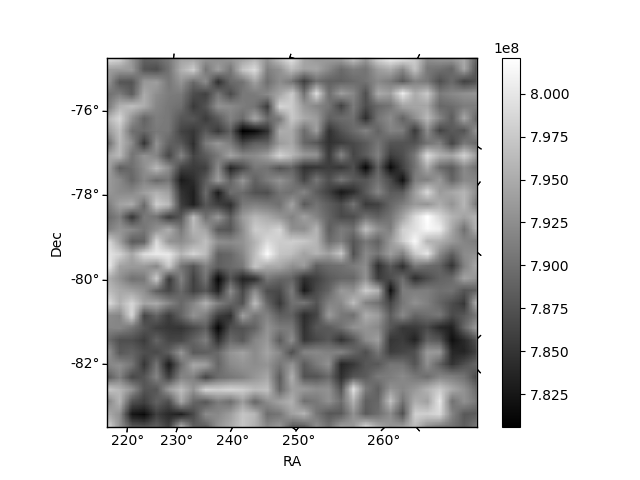
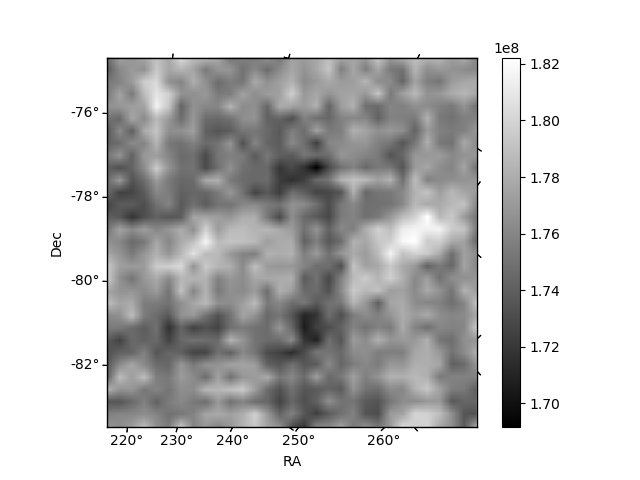
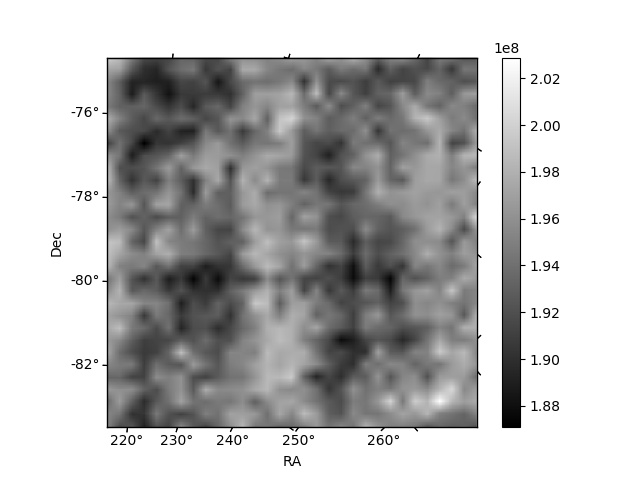
Histogram calculated using DETX and DETY for each event in the final _common_clean file
| Quadrant A | 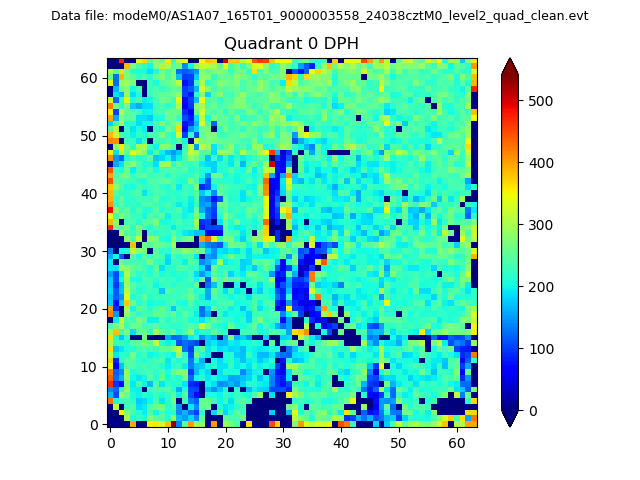 |
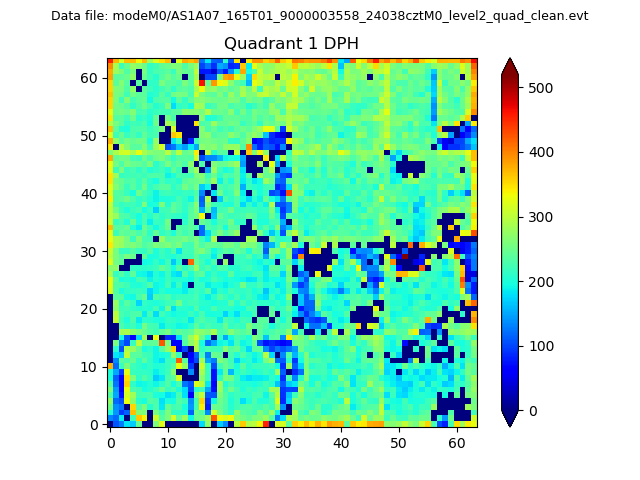 |
Quadrant B |
|---|---|---|---|
| Quadrant D | 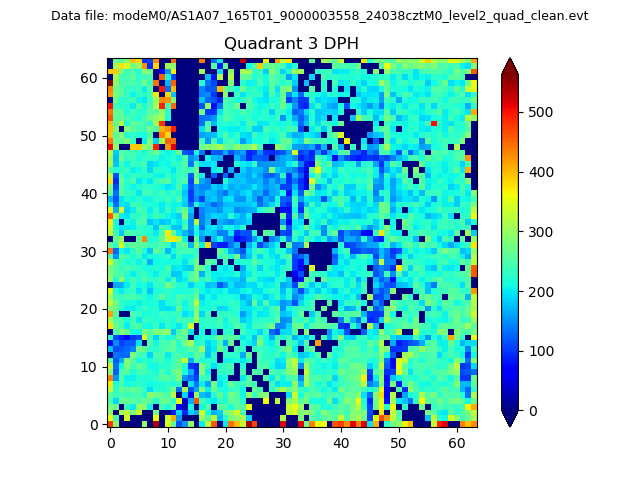 |
 |
Quadrant C |
| Plot type | Count rate plots | Images |
|---|---|---|
| Comparison with Poisson distribution Blue bars denote a histogram of data divided into 1 sec bins. Red curve is a Poisson curve with rate = median count rate of data. |
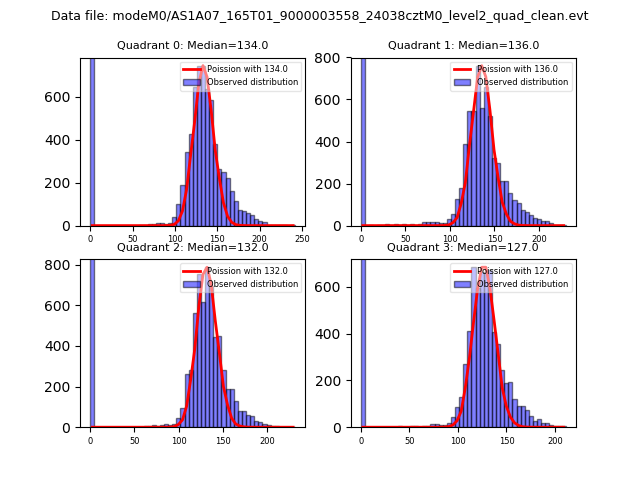 |
 |
| Quadrant-wise count rates Data is divided into 100 sec bins |
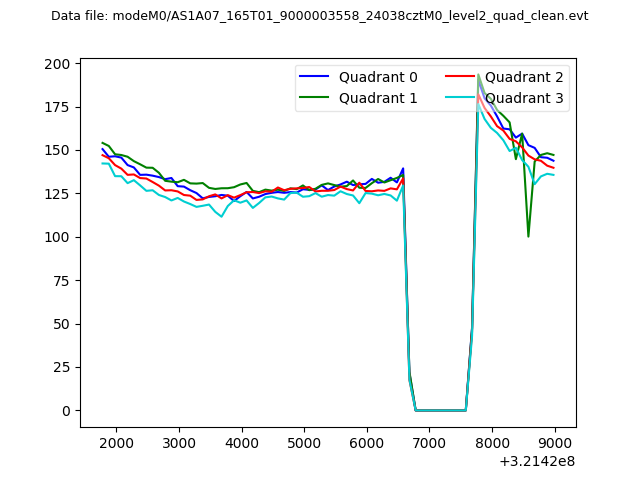 |
|
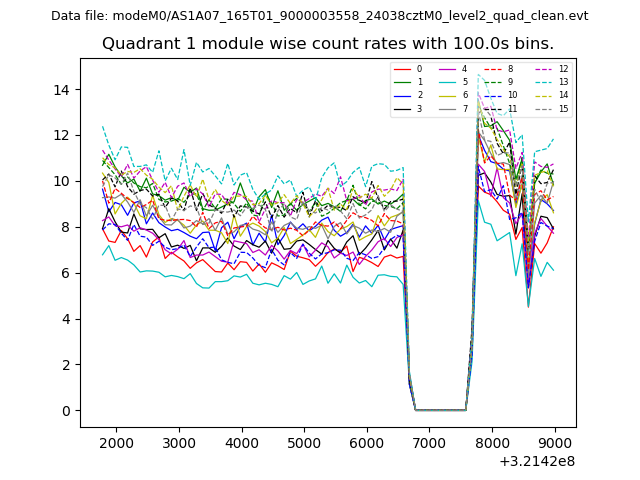
| Module-wise count rates for Quadrant A Data is divided into 100 sec bins |
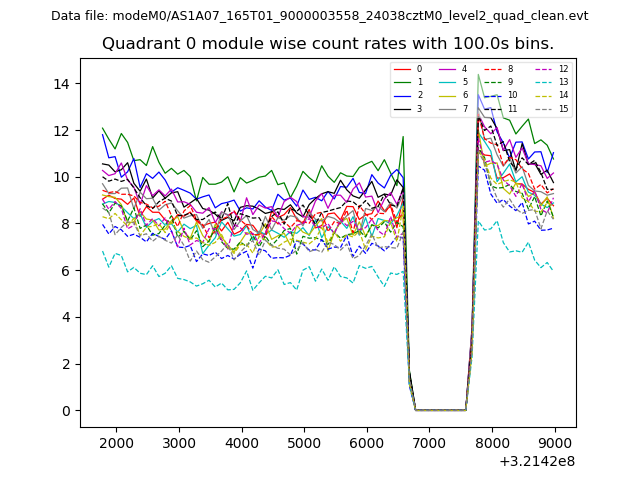 |
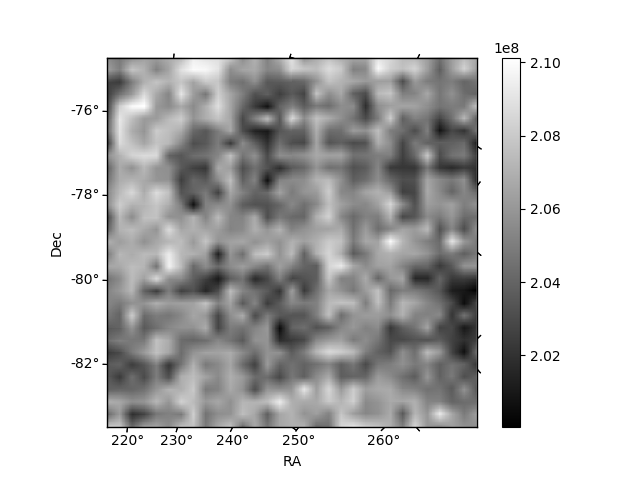 |
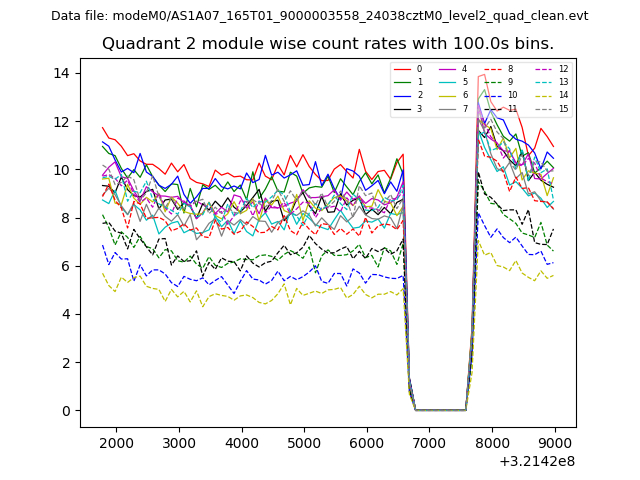
| Module-wise count rates for Quadrant B Data is divided into 100 sec bins |
 |
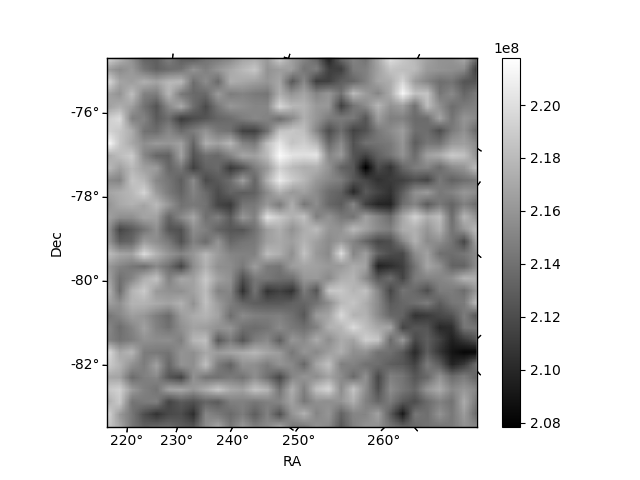 |
| Module-wise count rates for Quadrant C Data is divided into 100 sec bins |
 |
 |
| Module-wise count rates for Quadrant D Data is divided into 100 sec bins |
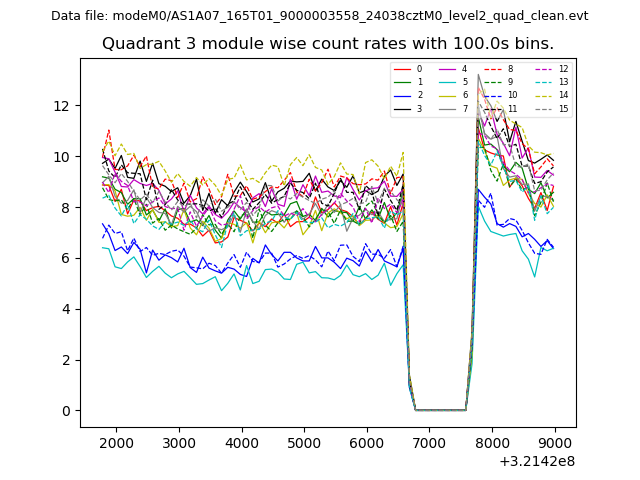 |
 |
| Parameter | Plot |
|---|---|
| CZT HV Monitor | 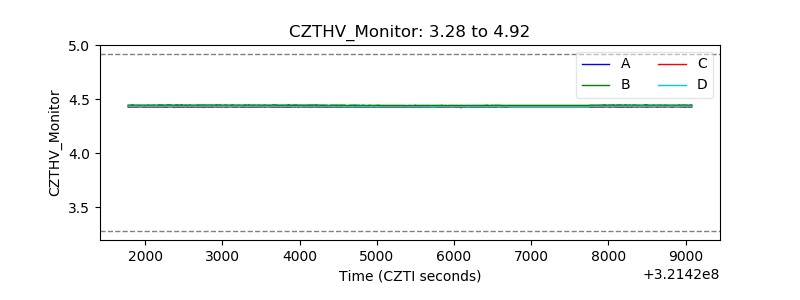 |
| D_VDD | 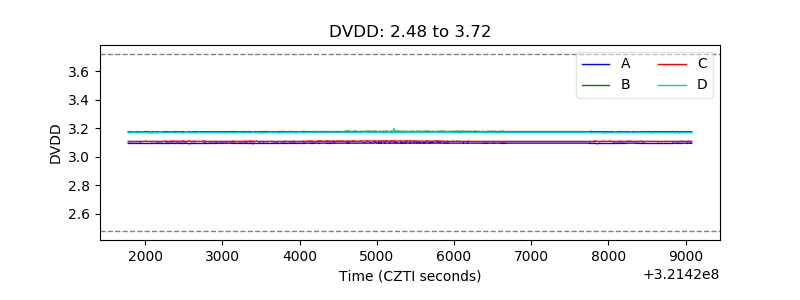 |
| Temperature 1 | 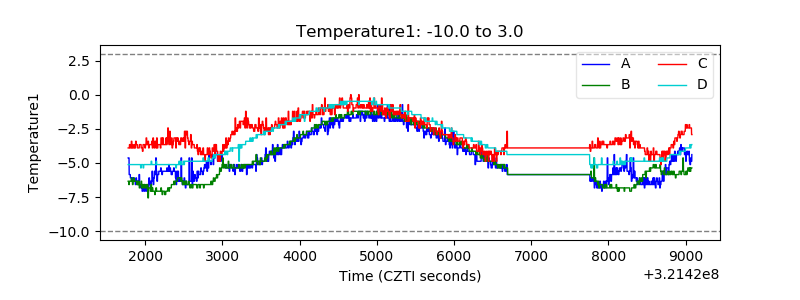 |
| Veto HV Monitor | 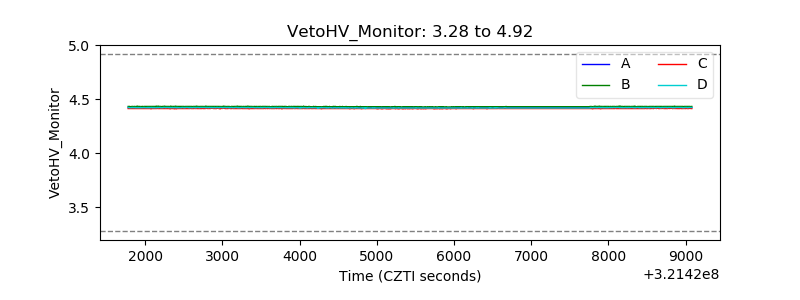 |
| Veto LLD | 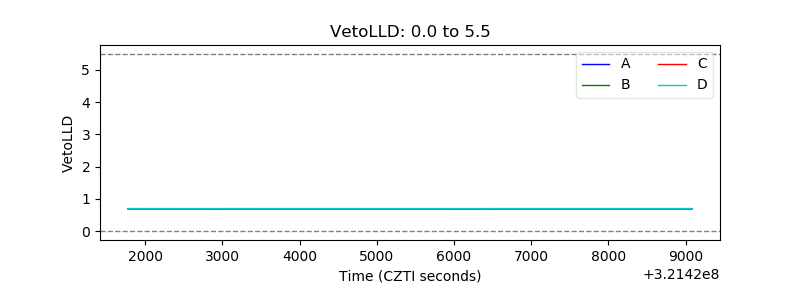 |
| Alpha Counter | 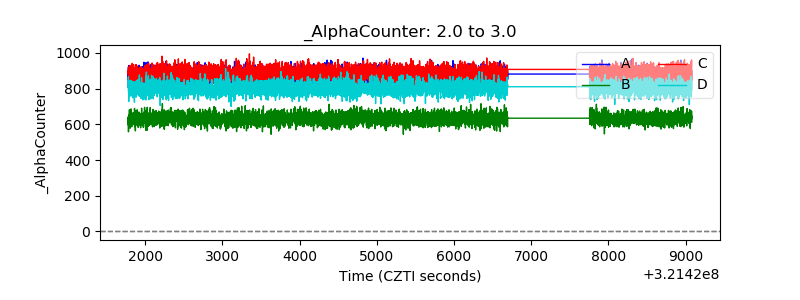 |
| _CPM_Rate | 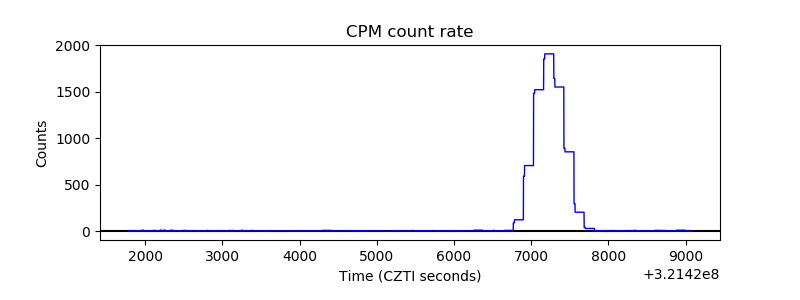 |
| CZT Counter |  |
| +2.5 Volts monitor |  |
| +5 Volts monitor |  |
| _ROLL_ROT |  |
| _Roll_DEC | 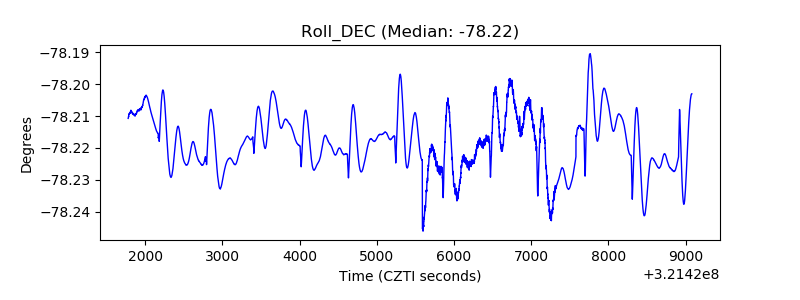 |
| _Roll_RA | 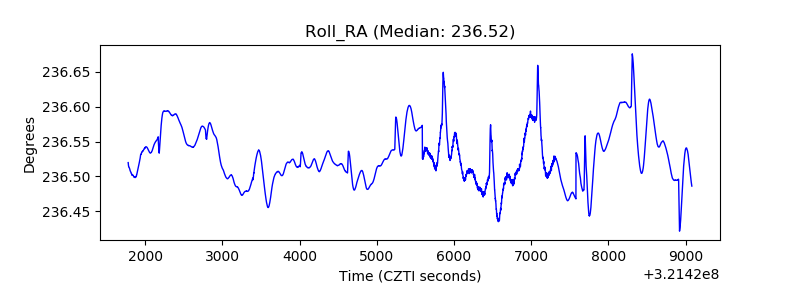 |
| Veto Counter | 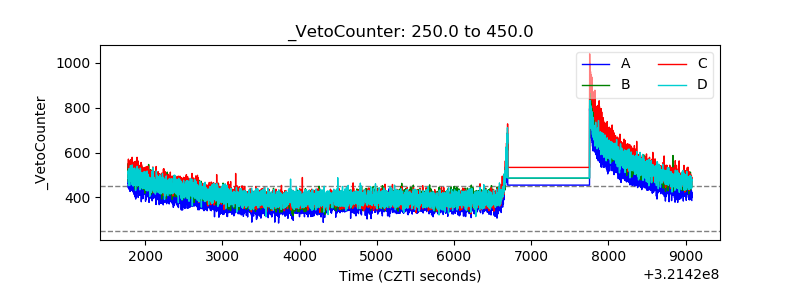 |