| Param | Original file | Final file |
|---|---|---|
| Filename | modeM0/AS1A07_165T01_9000003558_24047cztM0_level2.evt | modeM0/AS1A07_165T01_9000003558_24047cztM0_level2_quad_clean.evt |
| Size (bytes) | 588,453,120 | 133,496,640 |
| Size | 561.2 MB | 127.3 MB |
| Events in quadrant A | 3,269,573 | 906,654 |
| Events in quadrant B | 3,695,143 | 920,075 |
| Events in quadrant C | 3,538,755 | 882,540 |
| Events in quadrant D | 6,839,406 | 841,863 |
| Mode M9 | |||
|---|---|---|---|
| Quadrant | BADHDUFLAG | Total packets | Discarded packets |
| A | 0 | 3 | 0 |
| B | 0 | 3 | 0 |
| C | 0 | 3 | 0 |
| D | 0 | 3 | 0 |
| Mode M0 | |||
|---|---|---|---|
| Quadrant | BADHDUFLAG | Total packets | Discarded packets |
| A | 0 | 14508 | 1 |
| B | 0 | 15311 | 1 |
| C | 0 | 14728 | 1 |
| D | 0 | 25265 | 1 |
| Mode SS | |||
|---|---|---|---|
| Quadrant | BADHDUFLAG | Total packets | Discarded packets |
| A | 0 | 142 | 0 |
| B | 0 | 142 | 0 |
| C | 0 | 142 | 0 |
| D | 0 | 142 | 0 |
| Quadrant | Total seconds | Saturated seconds | Saturation percentage |
|---|---|---|---|
| A | 7070 | 75 | 1.060820% |
| B | 7071 | 157 | 2.220337% |
| C | 7071 | 111 | 1.569792% |
| D | 7071 | 338 | 4.780088% |
Noise dominated data is calculated using 1-second bins in cleaned event files. If a bin has >2000 counts, and if more than 50% of those come from <1% of pixels, then it is considered to be noise-dominated and hence unusable.
| Quadrant | # 1 sec bins | Bins with >0 counts | Bins with >2000 counts | High rate bins dominated by noise | Noise dominated (total time) | Noise dominated (detector-on time) | Marked lightcurve |
|---|---|---|---|---|---|---|---|
| A | 7330 | 7071 | 0 | 0 | 0.00% | 0.00% |  |
| B | 7331 | 7072 | 21 | 21 | 0.29% | 0.30% |  |
| C | 7331 | 7072 | 1 | 1 | 0.01% | 0.01% |  |
| D | 7331 | 7072 | 194 | 194 | 2.65% | 2.74% |  |
Top three noisy pixels from each quadrant. If the there are fewer than three noisy pixels in the level2.evt file, extra rows are filled as -1
| Pixel properties | Quadrant properties | ||||||
|---|---|---|---|---|---|---|---|
| Quadrant | DetID | PixID | Counts | Sigma | Mean | Median | Sigma |
| A | 13 | 254 | 12299 | 67.79 | 843 | 823 | 169.3 |
| A | 3 | 1 | 8629 | 46.11 | 843 | 823 | 169.3 |
| A | 0 | 226 | 7265 | 38.05 | 843 | 823 | 169.3 |
| B | 0 | 197 | 239804 | 1526.68 | 836 | 817 | 156.5 |
| B | 0 | 189 | 56912 | 358.34 | 836 | 817 | 156.5 |
| B | 5 | 172 | 45896 | 287.97 | 836 | 817 | 156.5 |
| C | 7 | 247 | 268795 | 1439.54 | 802 | 807 | 186.2 |
| C | 14 | 238 | 128457 | 685.69 | 802 | 807 | 186.2 |
| C | 0 | 239 | 12276 | 61.61 | 802 | 807 | 186.2 |
| D | 8 | 195 | 2913021 | 14817.44 | 806 | 781 | 196.5 |
| D | 1 | 52 | 772508 | 3926.54 | 806 | 781 | 196.5 |
| D | 12 | 233 | 53938 | 270.46 | 806 | 781 | 196.5 |
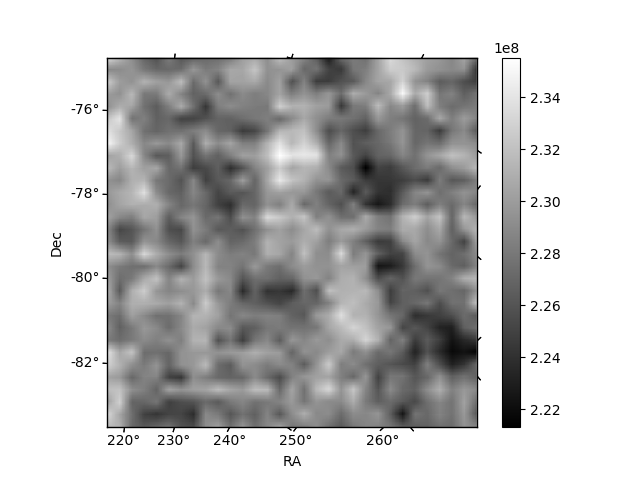
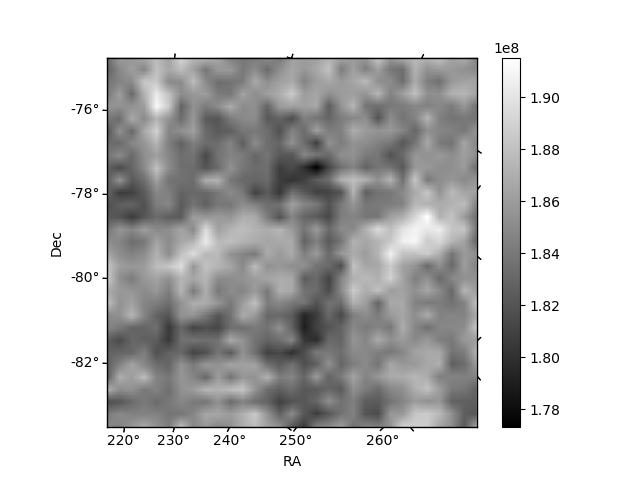
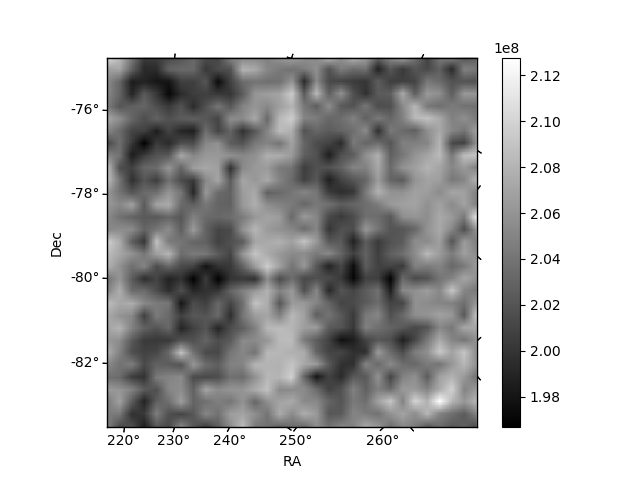
Histogram calculated using DETX and DETY for each event in the final _common_clean file
| Quadrant A | 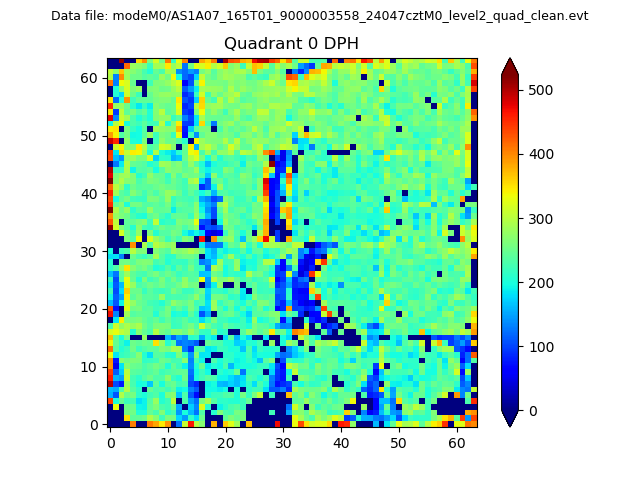 |
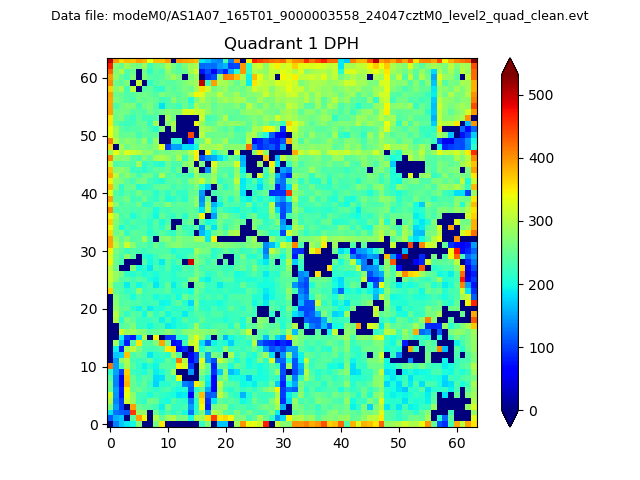 |
Quadrant B |
|---|---|---|---|
| Quadrant D | 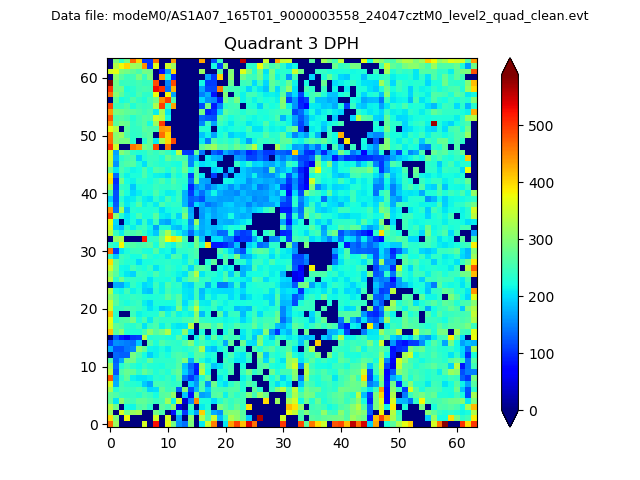 |
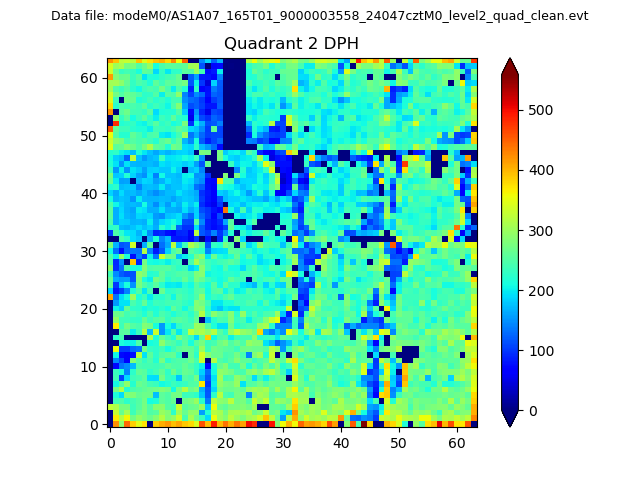 |
Quadrant C |
| Plot type | Count rate plots | Images |
|---|---|---|
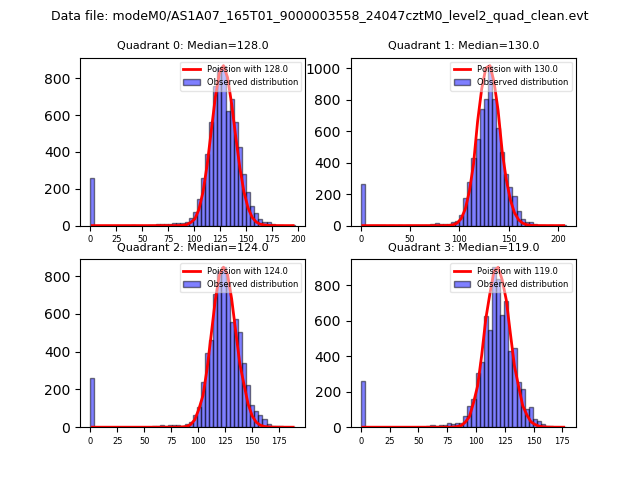
| Comparison with Poisson distribution Blue bars denote a histogram of data divided into 1 sec bins. Red curve is a Poisson curve with rate = median count rate of data. |
 |
 |
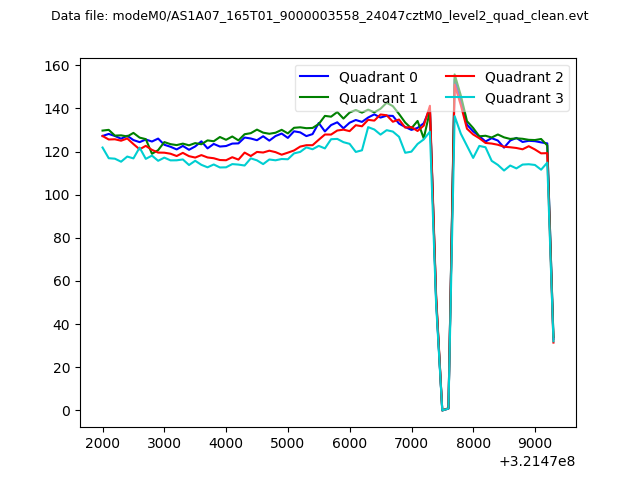
| Quadrant-wise count rates Data is divided into 100 sec bins |
 |
|
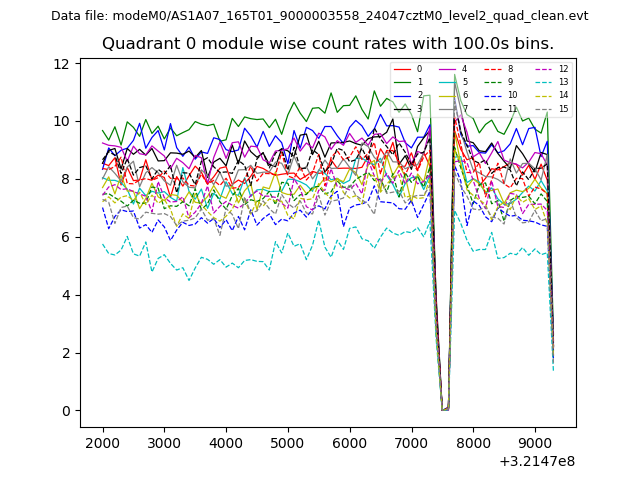
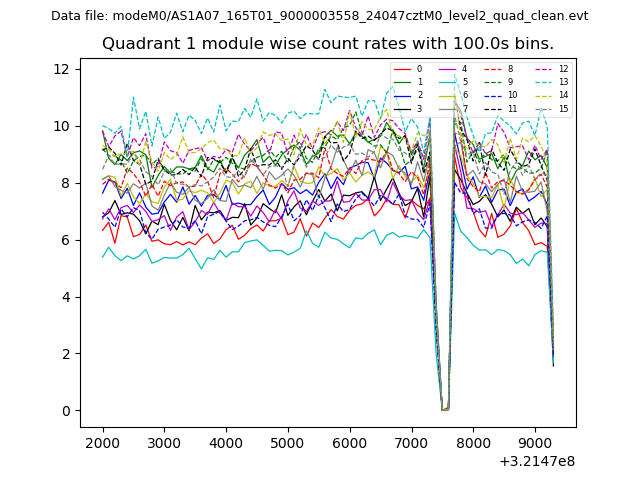
| Module-wise count rates for Quadrant A Data is divided into 100 sec bins |
 |
 |
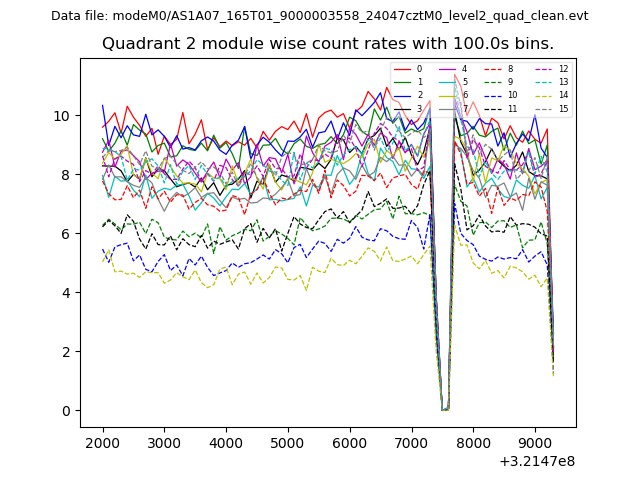
| Module-wise count rates for Quadrant B Data is divided into 100 sec bins |
 |
 |
| Module-wise count rates for Quadrant C Data is divided into 100 sec bins |
 |
 |
| Module-wise count rates for Quadrant D Data is divided into 100 sec bins |
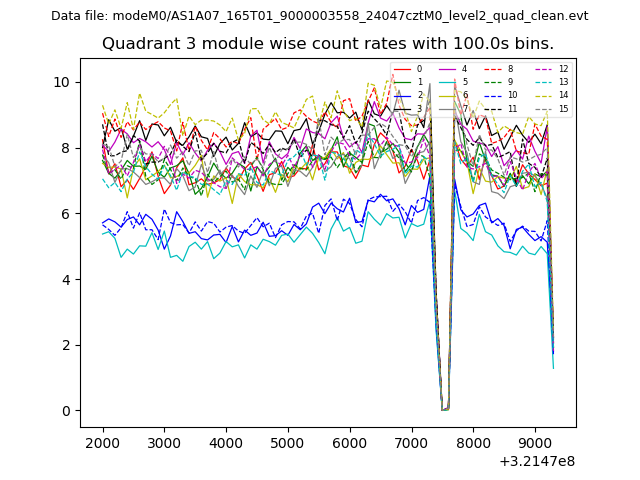 |
 |
| Parameter | Plot |
|---|---|
| CZT HV Monitor | 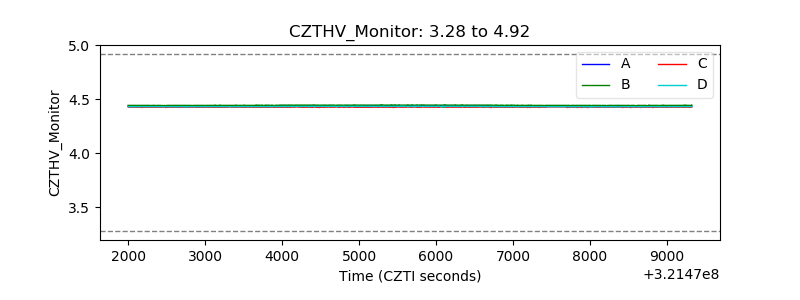 |
| D_VDD | 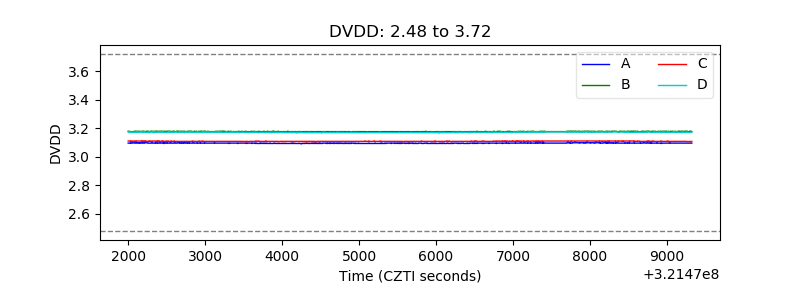 |
| Temperature 1 | 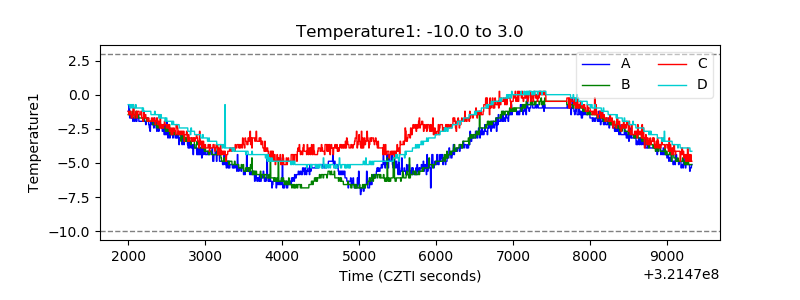 |
| Veto HV Monitor | 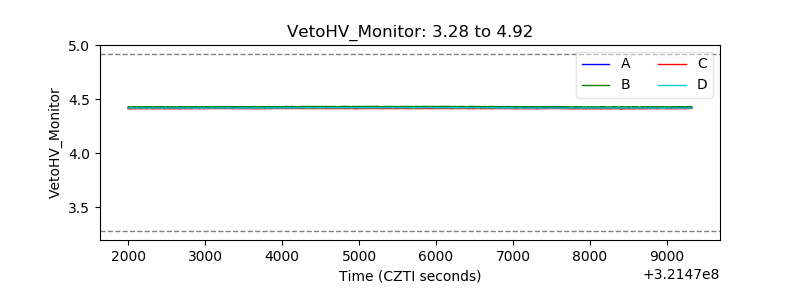 |
| Veto LLD | 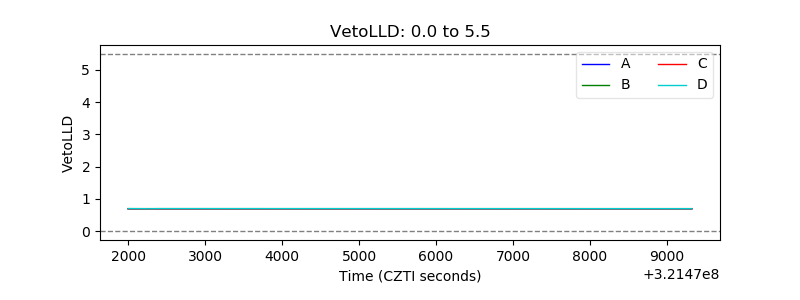 |
| Alpha Counter | 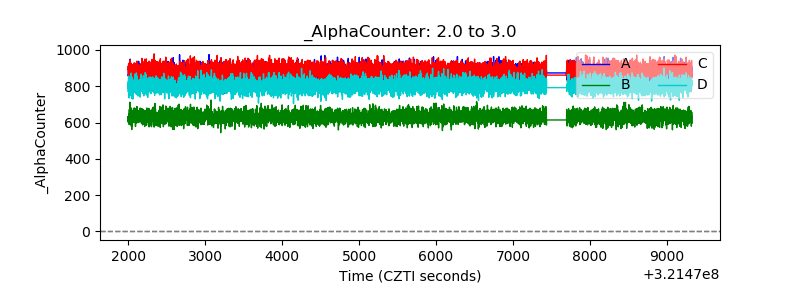 |
| _CPM_Rate | 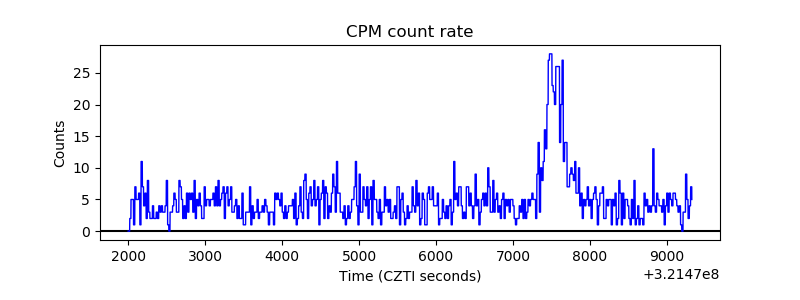 |
| CZT Counter | 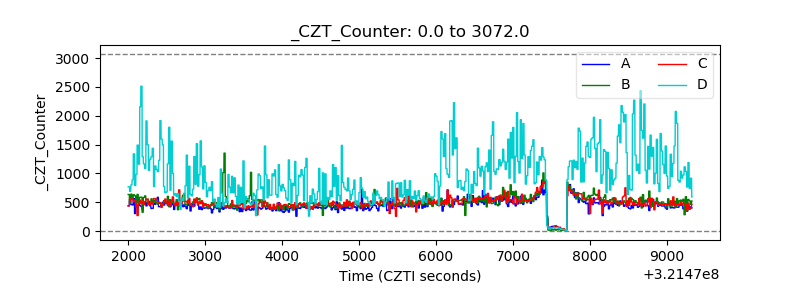 |
| +2.5 Volts monitor |  |
| +5 Volts monitor |  |
| _ROLL_ROT | 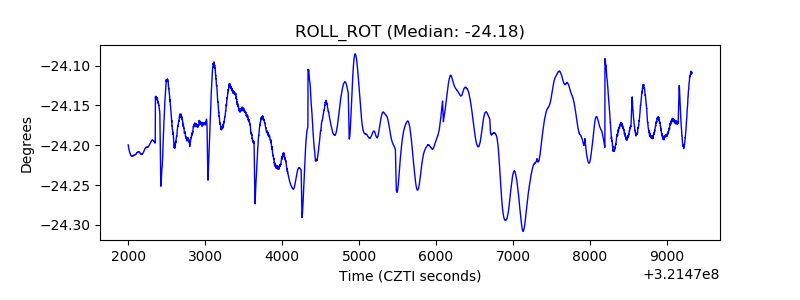 |
| _Roll_DEC | 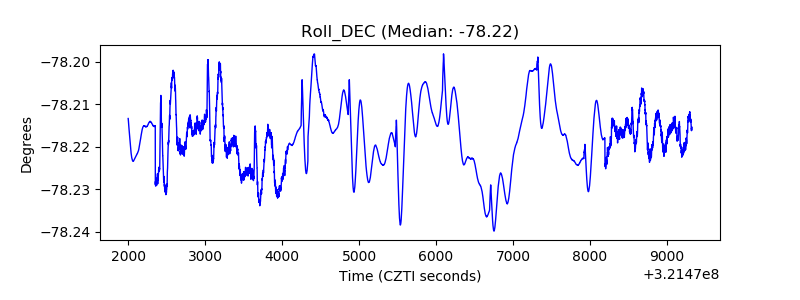 |
| _Roll_RA | 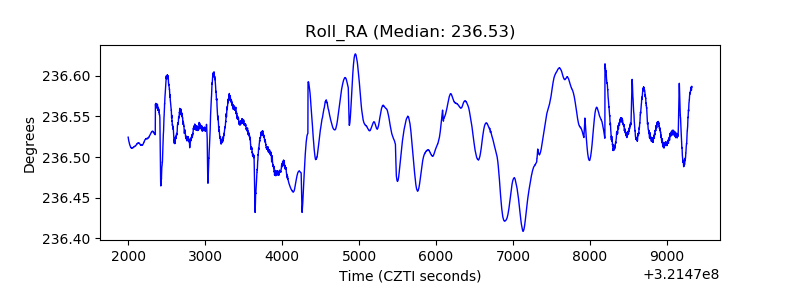 |
| Veto Counter |  |