| Param | Original file | Final file |
|---|---|---|
| Filename | modeM0/AS1A07_165T01_9000003558_24048cztM0_level2.evt | modeM0/AS1A07_165T01_9000003558_24048cztM0_level2_quad_clean.evt |
| Size (bytes) | 529,205,760 | 128,041,920 |
| Size | 504.7 MB | 122.1 MB |
| Events in quadrant A | 3,106,537 | 868,515 |
| Events in quadrant B | 3,650,429 | 879,189 |
| Events in quadrant C | 3,415,363 | 838,615 |
| Events in quadrant D | 5,390,618 | 814,774 |
| Mode M9 | |||
|---|---|---|---|
| Quadrant | BADHDUFLAG | Total packets | Discarded packets |
| A | 0 | 4 | 0 |
| B | 0 | 4 | 0 |
| C | 0 | 4 | 0 |
| D | 0 | 4 | 0 |
| Mode M0 | |||
|---|---|---|---|
| Quadrant | BADHDUFLAG | Total packets | Discarded packets |
| A | 0 | 13911 | 1 |
| B | 0 | 14863 | 1 |
| C | 0 | 14246 | 1 |
| D | 0 | 20754 | 3 |
| Mode SS | |||
|---|---|---|---|
| Quadrant | BADHDUFLAG | Total packets | Discarded packets |
| A | 0 | 140 | 0 |
| B | 0 | 140 | 0 |
| C | 0 | 140 | 0 |
| D | 0 | 140 | 0 |
| Quadrant | Total seconds | Saturated seconds | Saturation percentage |
|---|---|---|---|
| A | 6844 | 28 | 0.409117% |
| B | 6844 | 45 | 0.657510% |
| C | 6844 | 55 | 0.803624% |
| D | 6843 | 107 | 1.563642% |
Noise dominated data is calculated using 1-second bins in cleaned event files. If a bin has >2000 counts, and if more than 50% of those come from <1% of pixels, then it is considered to be noise-dominated and hence unusable.
| Quadrant | # 1 sec bins | Bins with >0 counts | Bins with >2000 counts | High rate bins dominated by noise | Noise dominated (total time) | Noise dominated (detector-on time) | Marked lightcurve |
|---|---|---|---|---|---|---|---|
| A | 7254 | 6845 | 0 | 0 | 0.00% | 0.00% | 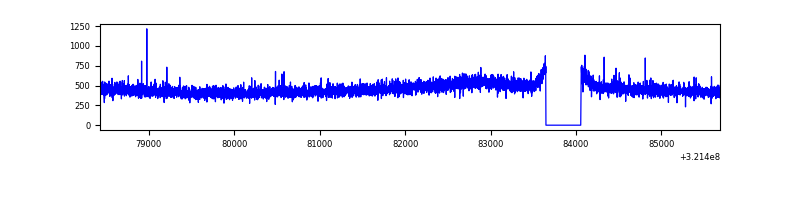 |
| B | 7254 | 6845 | 5 | 5 | 0.07% | 0.07% | 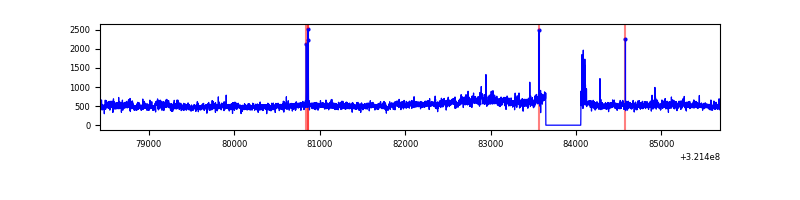 |
| C | 7254 | 6845 | 0 | 0 | 0.00% | 0.00% | 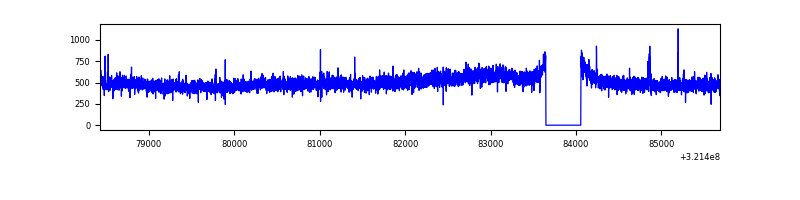 |
| D | 7253 | 6844 | 101 | 101 | 1.39% | 1.48% | 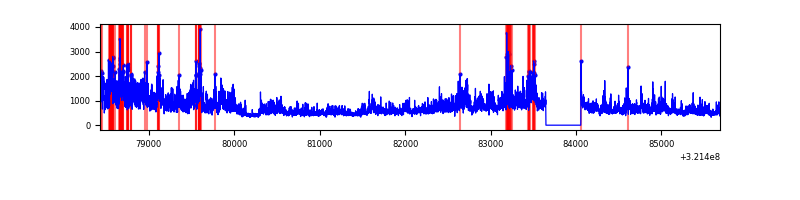 |
Top three noisy pixels from each quadrant. If the there are fewer than three noisy pixels in the level2.evt file, extra rows are filled as -1
| Pixel properties | Quadrant properties | ||||||
|---|---|---|---|---|---|---|---|
| Quadrant | DetID | PixID | Counts | Sigma | Mean | Median | Sigma |
| A | 3 | 1 | 14696 | 85.68 | 801 | 780 | 162.4 |
| A | 13 | 254 | 10803 | 61.71 | 801 | 780 | 162.4 |
| A | 3 | 137 | 7079 | 38.78 | 801 | 780 | 162.4 |
| B | 0 | 197 | 406495 | 2698.72 | 800 | 781 | 150.3 |
| B | 0 | 189 | 47936 | 313.66 | 800 | 781 | 150.3 |
| B | 14 | 207 | 26363 | 170.17 | 800 | 781 | 150.3 |
| C | 7 | 247 | 290644 | 1630.82 | 765 | 769 | 177.7 |
| C | 14 | 238 | 121239 | 677.76 | 765 | 769 | 177.7 |
| C | 3 | 233 | 9307 | 48.03 | 765 | 769 | 177.7 |
| D | 8 | 195 | 2243344 | 11991.47 | 771 | 749 | 187.0 |
| D | 12 | 233 | 114634 | 608.96 | 771 | 749 | 187.0 |
| D | 1 | 52 | 48548 | 255.59 | 771 | 749 | 187.0 |
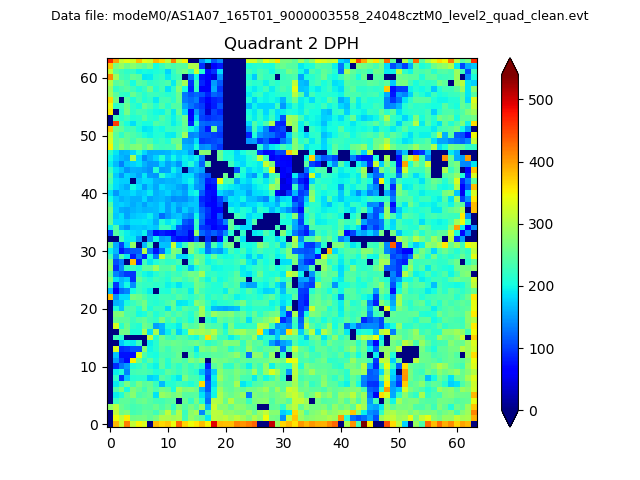
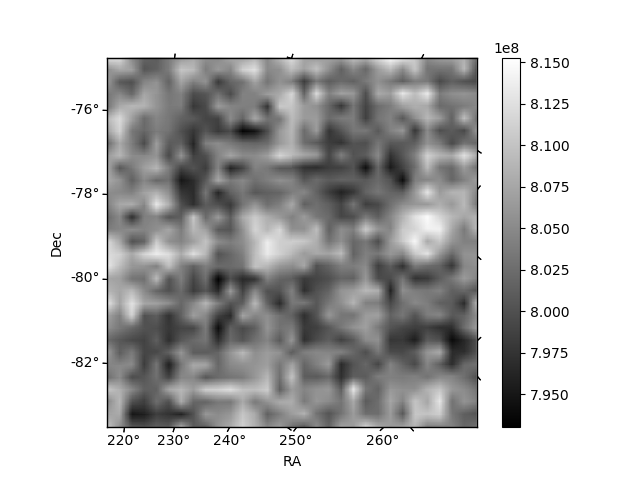
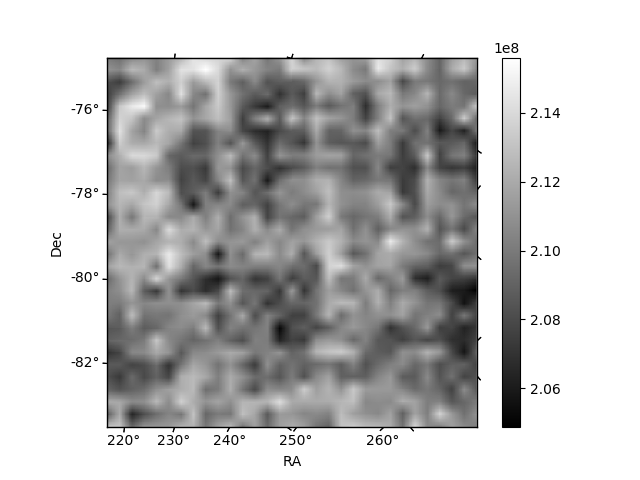
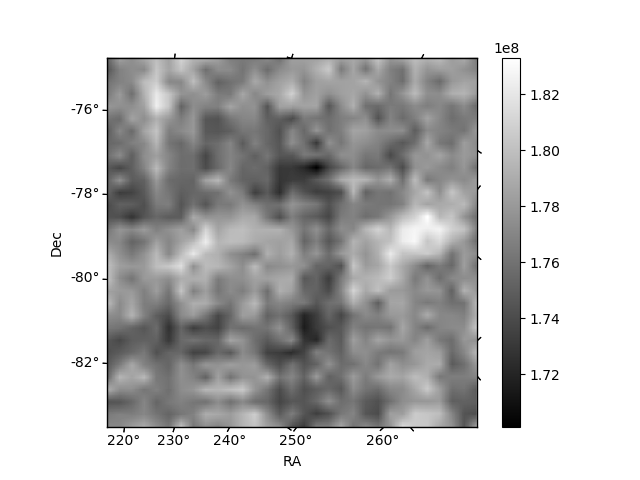
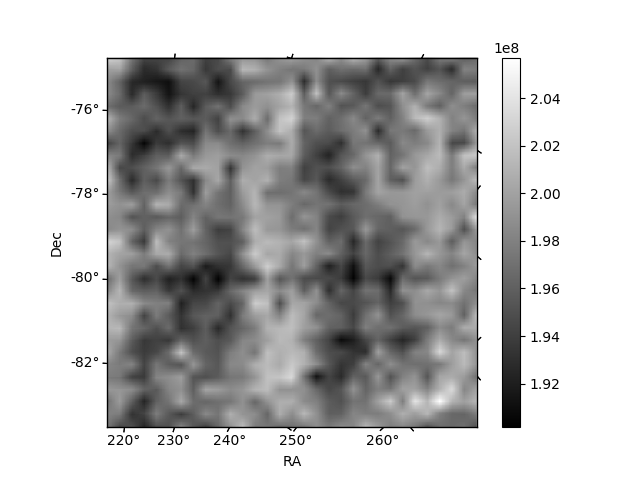
Histogram calculated using DETX and DETY for each event in the final _common_clean file
| Quadrant A | 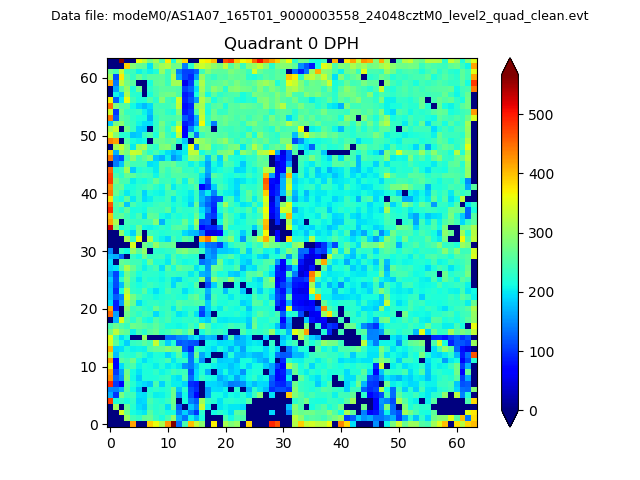 |
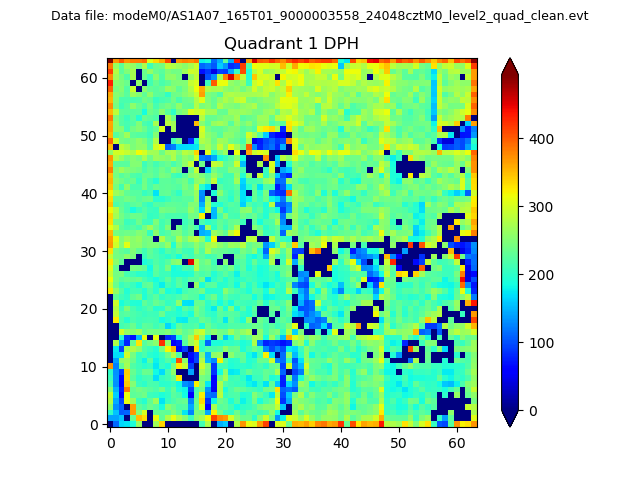 |
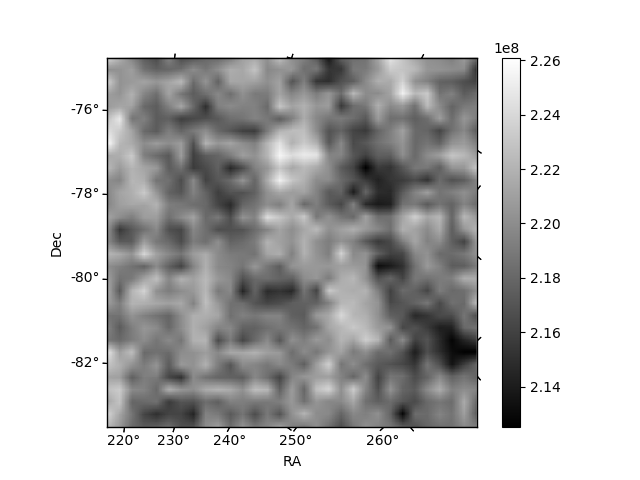
Quadrant B |
|---|---|---|---|
| Quadrant D | 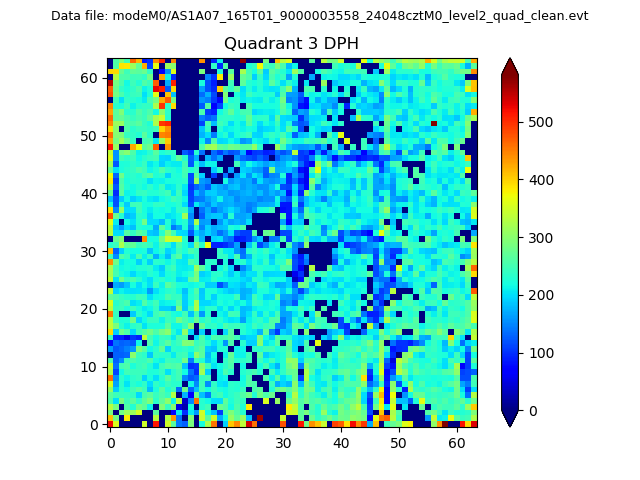 |
 |
Quadrant C |
| Plot type | Count rate plots | Images |
|---|---|---|
| Comparison with Poisson distribution Blue bars denote a histogram of data divided into 1 sec bins. Red curve is a Poisson curve with rate = median count rate of data. |
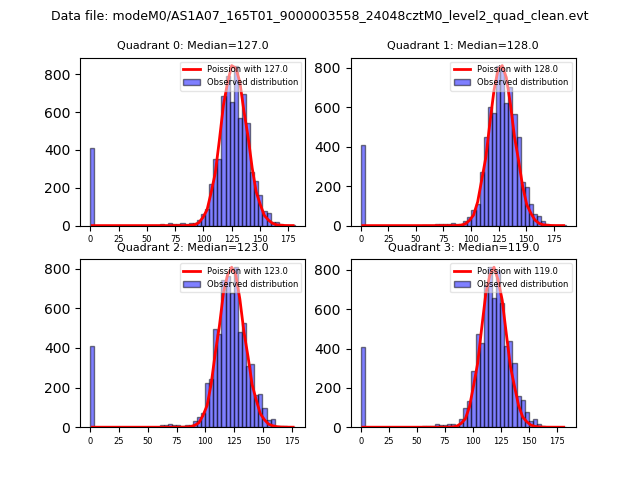 |
 |
| Quadrant-wise count rates Data is divided into 100 sec bins |
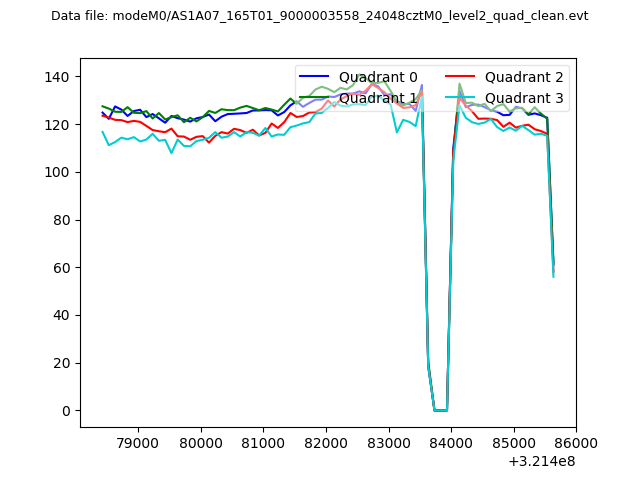 |
|
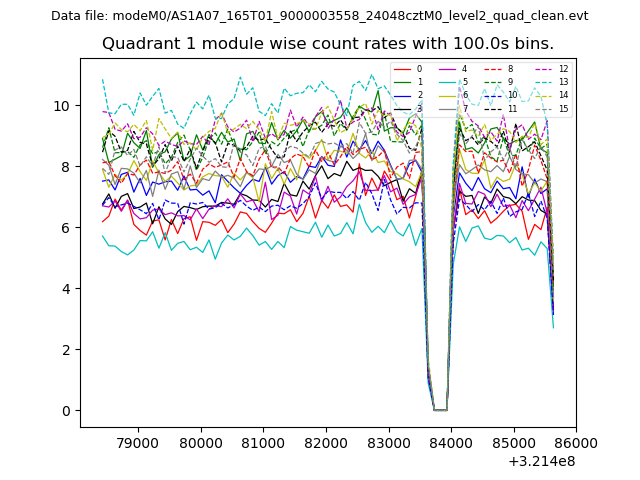
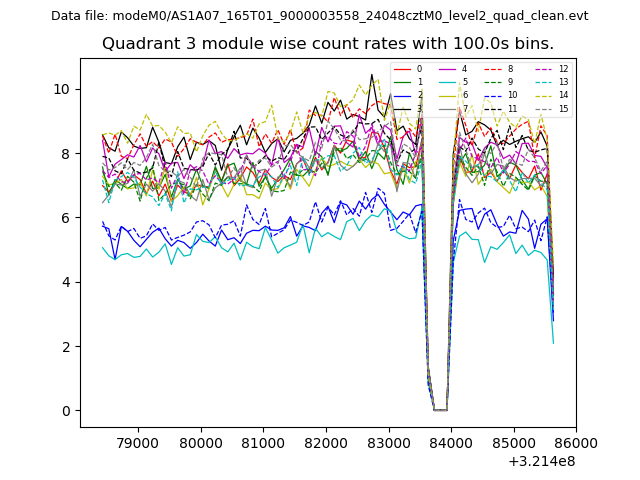
| Module-wise count rates for Quadrant A Data is divided into 100 sec bins |
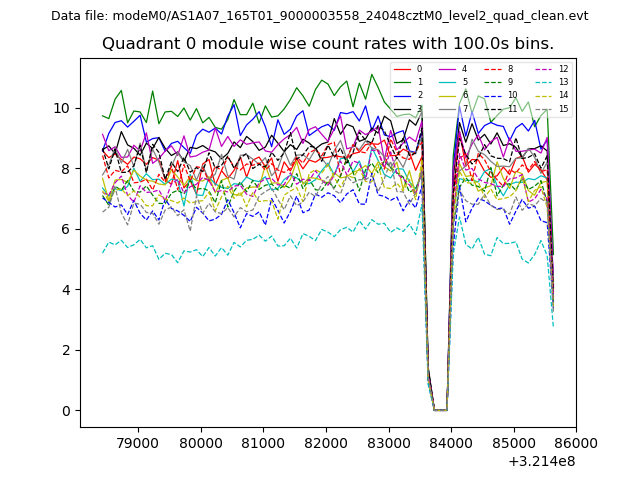 |
 |
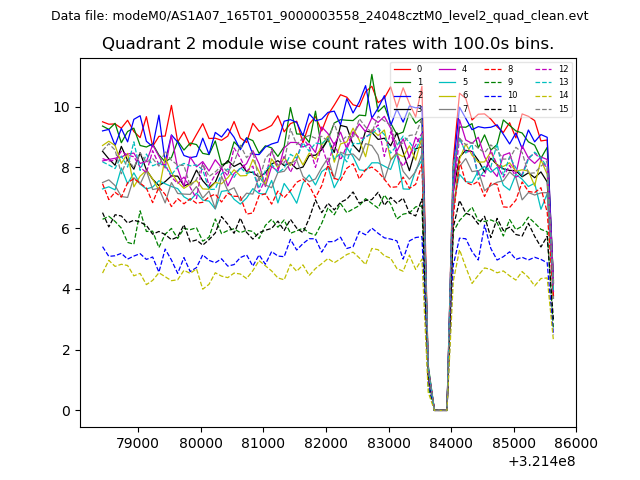
| Module-wise count rates for Quadrant B Data is divided into 100 sec bins |
 |
 |
| Module-wise count rates for Quadrant C Data is divided into 100 sec bins |
 |
 |
| Module-wise count rates for Quadrant D Data is divided into 100 sec bins |
 |
 |
| Parameter | Plot |
|---|---|
| CZT HV Monitor | 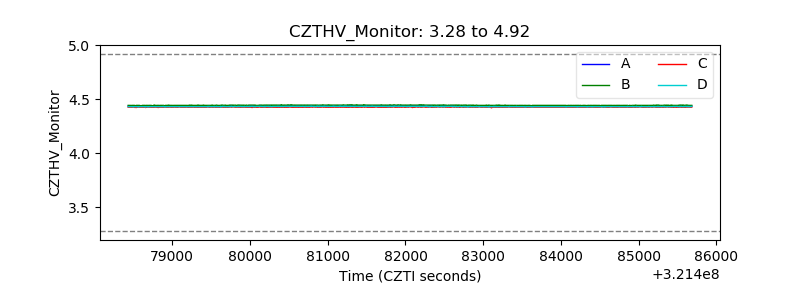 |
| D_VDD | 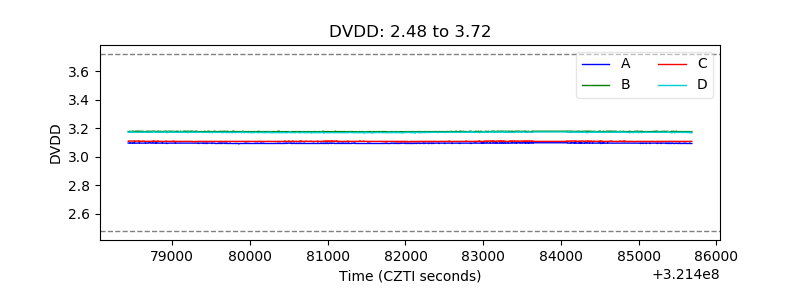 |
| Temperature 1 | 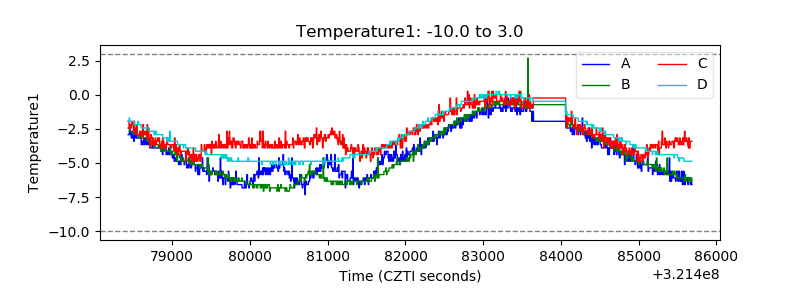 |
| Veto HV Monitor | 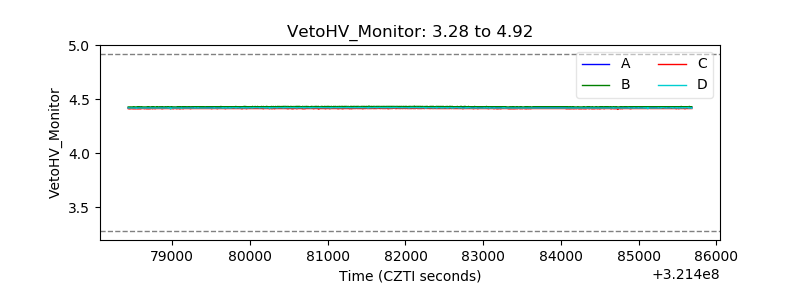 |
| Veto LLD | 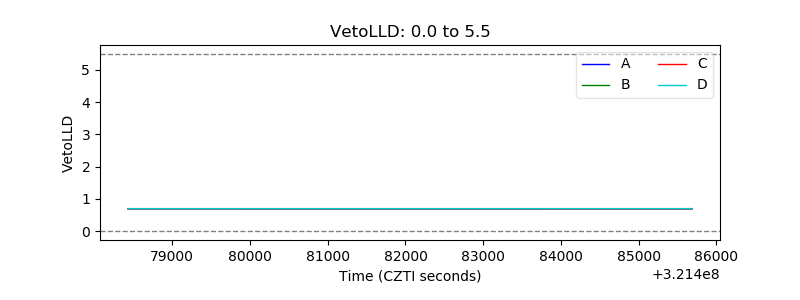 |
| Alpha Counter | 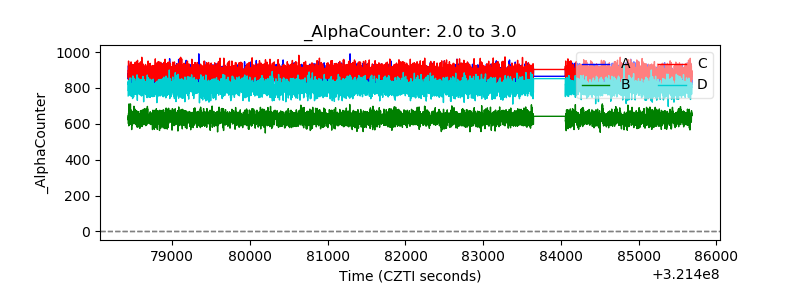 |
| _CPM_Rate | 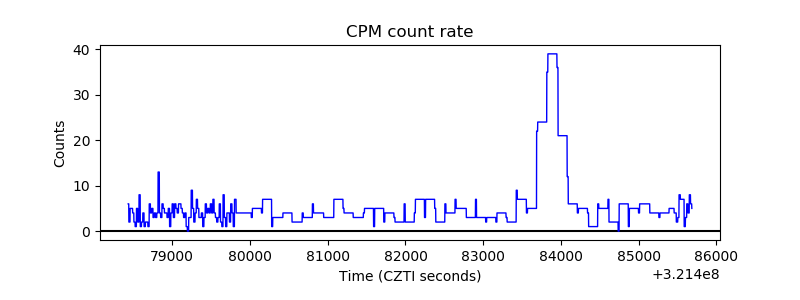 |
| CZT Counter | 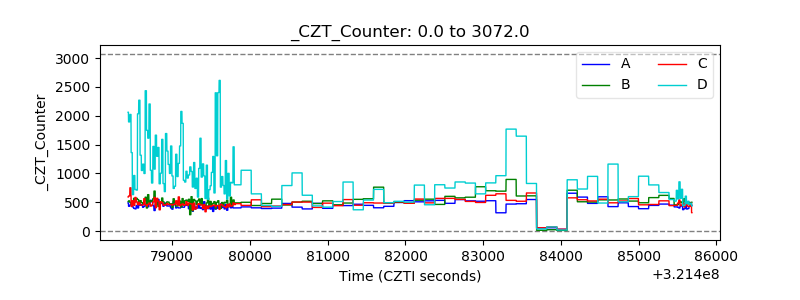 |
| +2.5 Volts monitor |  |
| +5 Volts monitor |  |
| _ROLL_ROT | 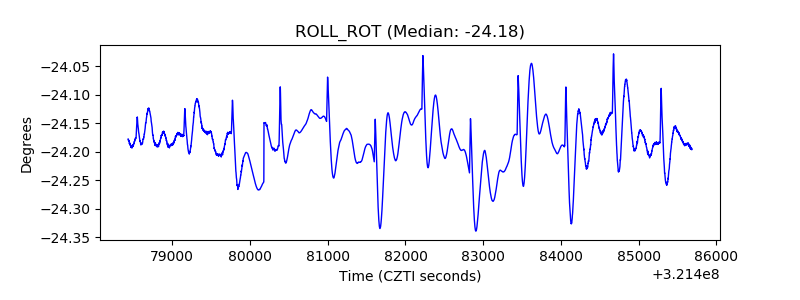 |
| _Roll_DEC |  |
| _Roll_RA | 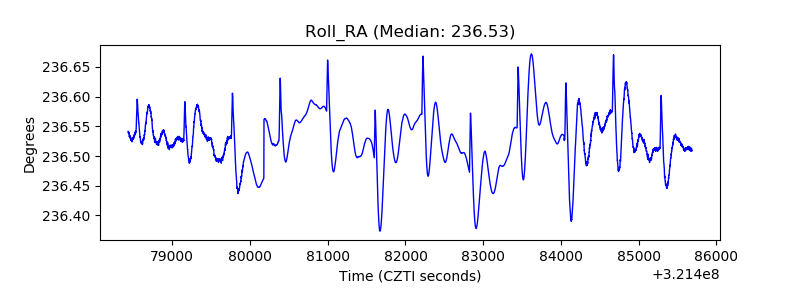 |
| Veto Counter | 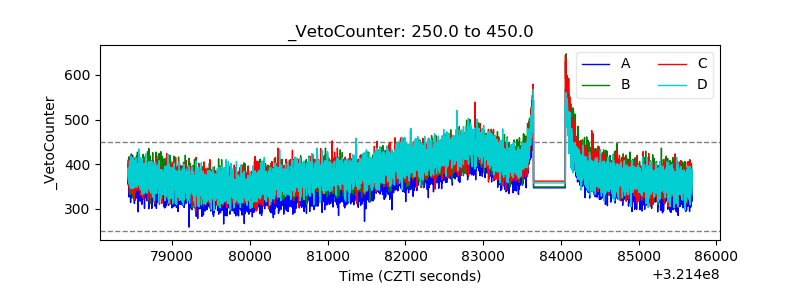 |