| Param | Original file | Final file |
|---|---|---|
| Filename | modeM0/AS1A07_165T01_9000003558_24051cztM0_level2.evt | modeM0/AS1A07_165T01_9000003558_24051cztM0_level2_quad_clean.evt |
| Size (bytes) | 1,268,228,160 | 343,131,840 |
| Size | 1.2 GB | 327.2 MB |
| Events in quadrant A | 8,401,780 | 2,314,525 |
| Events in quadrant B | 9,710,043 | 2,359,548 |
| Events in quadrant C | 8,928,699 | 2,254,422 |
| Events in quadrant D | 10,134,345 | 2,208,011 |
| Mode M9 | |||
|---|---|---|---|
| Quadrant | BADHDUFLAG | Total packets | Discarded packets |
| A | 0 | 22 | 0 |
| B | 0 | 22 | 0 |
| C | 0 | 22 | 0 |
| D | 0 | 22 | 0 |
| Mode M0 | |||
|---|---|---|---|
| Quadrant | BADHDUFLAG | Total packets | Discarded packets |
| A | 0 | 37032 | 4 |
| B | 0 | 40278 | 4 |
| C | 0 | 37249 | 4 |
| D | 0 | 42238 | 4 |
| Mode SS | |||
|---|---|---|---|
| Quadrant | BADHDUFLAG | Total packets | Discarded packets |
| A | 0 | 370 | 0 |
| B | 0 | 370 | 0 |
| C | 0 | 370 | 0 |
| D | 0 | 370 | 0 |
| Quadrant | Total seconds | Saturated seconds | Saturation percentage |
|---|---|---|---|
| A | 18255 | 80 | 0.438236% |
| B | 18256 | 147 | 0.805215% |
| C | 18256 | 169 | 0.925723% |
| D | 18256 | 157 | 0.859991% |
Noise dominated data is calculated using 1-second bins in cleaned event files. If a bin has >2000 counts, and if more than 50% of those come from <1% of pixels, then it is considered to be noise-dominated and hence unusable.
| Quadrant | # 1 sec bins | Bins with >0 counts | Bins with >2000 counts | High rate bins dominated by noise | Noise dominated (total time) | Noise dominated (detector-on time) | Marked lightcurve |
|---|---|---|---|---|---|---|---|
| A | 20410 | 18258 | 0 | 0 | 0.00% | 0.00% | 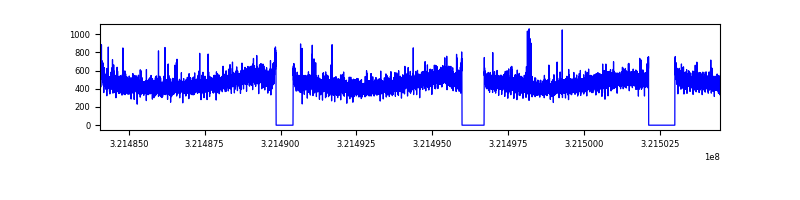 |
| B | 20411 | 18259 | 18 | 18 | 0.09% | 0.10% | 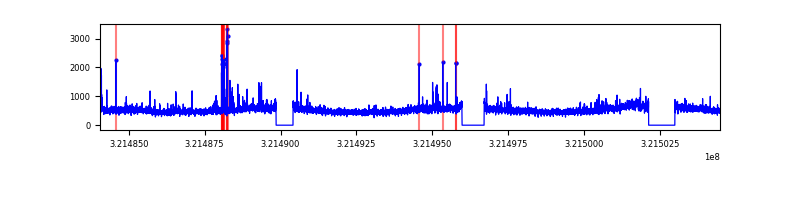 |
| C | 20411 | 18258 | 0 | 0 | 0.00% | 0.00% | 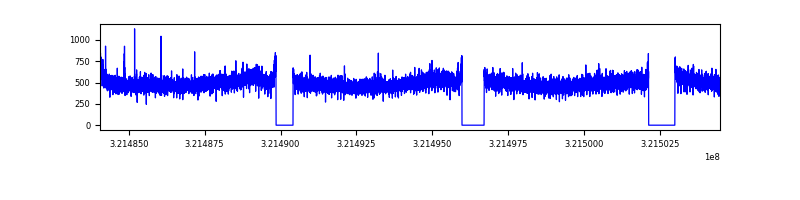 |
| D | 20411 | 18259 | 50 | 50 | 0.24% | 0.27% | 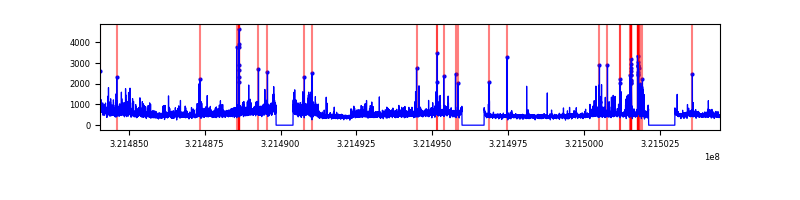 |
Top three noisy pixels from each quadrant. If the there are fewer than three noisy pixels in the level2.evt file, extra rows are filled as -1
| Pixel properties | Quadrant properties | ||||||
|---|---|---|---|---|---|---|---|
| Quadrant | DetID | PixID | Counts | Sigma | Mean | Median | Sigma |
| A | 3 | 1 | 44790 | 98.49 | 2161 | 2110 | 433.4 |
| A | 13 | 254 | 29201 | 62.51 | 2161 | 2110 | 433.4 |
| A | 6 | 16 | 19348 | 39.78 | 2161 | 2110 | 433.4 |
| B | 0 | 197 | 749227 | 1826.98 | 2162 | 2106 | 408.9 |
| B | 14 | 207 | 164342 | 396.72 | 2162 | 2106 | 408.9 |
| B | 0 | 189 | 110189 | 264.3 | 2162 | 2106 | 408.9 |
| C | 7 | 247 | 469469 | 973.52 | 2081 | 2096 | 480.1 |
| C | 14 | 238 | 331060 | 685.22 | 2081 | 2096 | 480.1 |
| C | 3 | 233 | 18848 | 34.89 | 2081 | 2096 | 480.1 |
| D | 8 | 195 | 1639848 | 3225.05 | 2101 | 2039 | 507.8 |
| D | 1 | 52 | 301680 | 590.03 | 2101 | 2039 | 507.8 |
| D | 12 | 233 | 98327 | 189.6 | 2101 | 2039 | 507.8 |
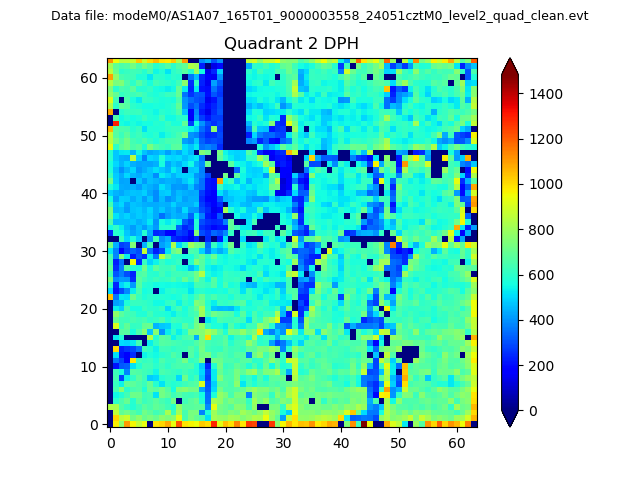
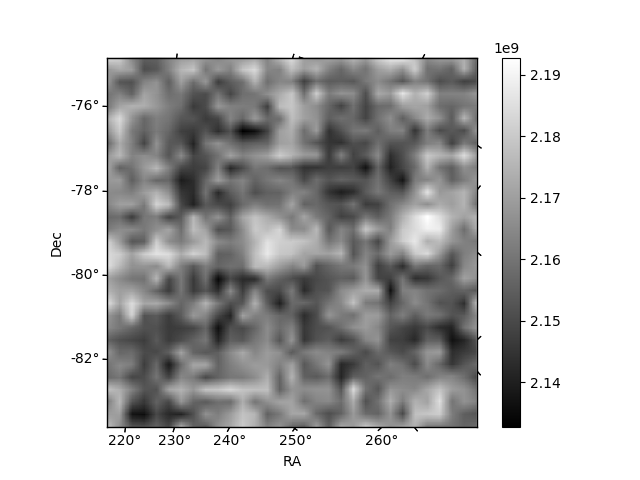
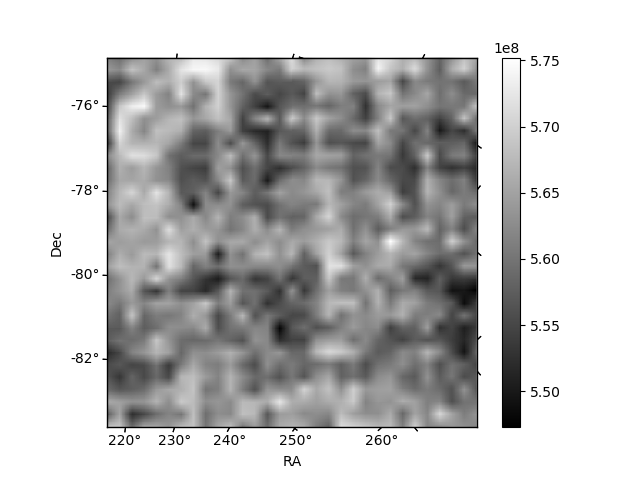
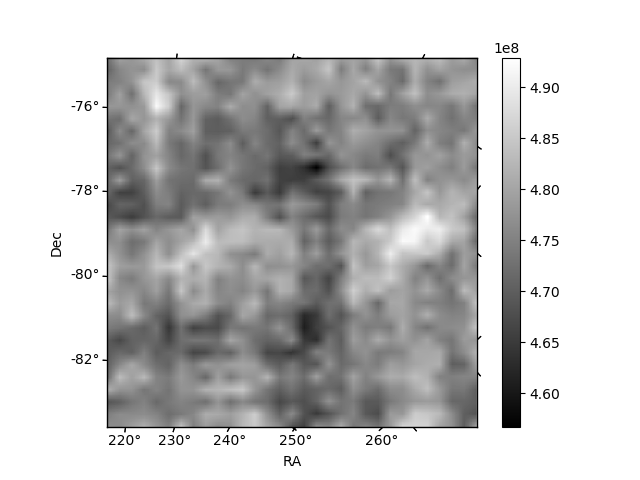
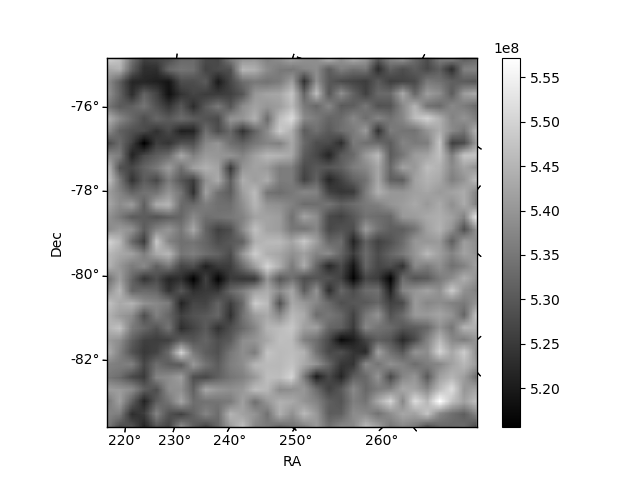
Histogram calculated using DETX and DETY for each event in the final _common_clean file
| Quadrant A | 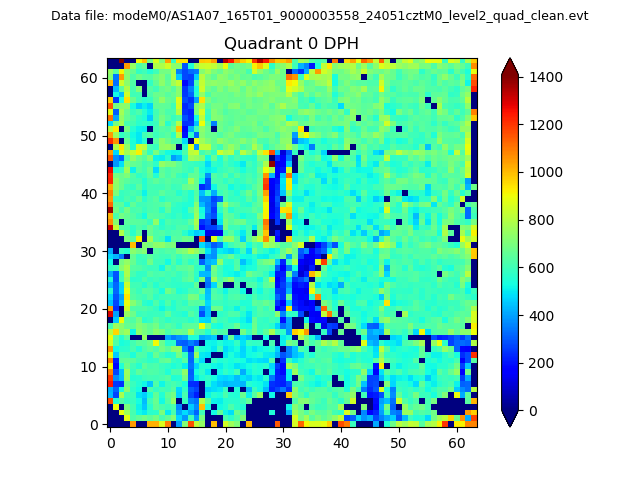 |
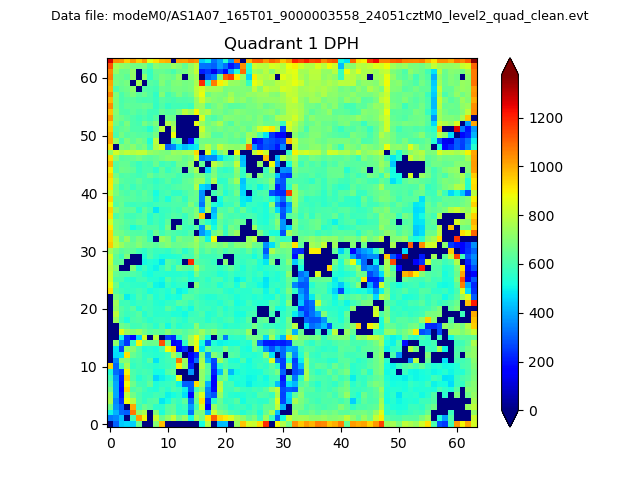 |
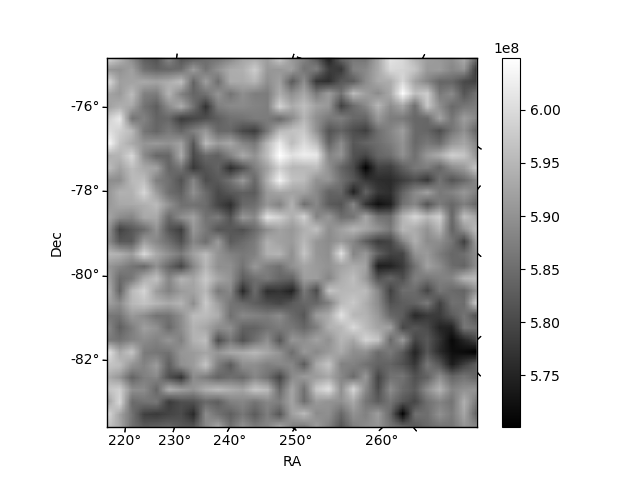
Quadrant B |
|---|---|---|---|
| Quadrant D | 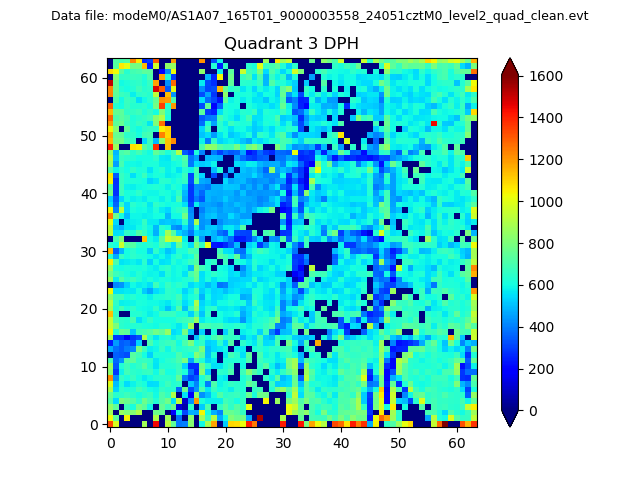 |
 |
Quadrant C |
| Plot type | Count rate plots | Images |
|---|---|---|
| Comparison with Poisson distribution Blue bars denote a histogram of data divided into 1 sec bins. Red curve is a Poisson curve with rate = median count rate of data. |
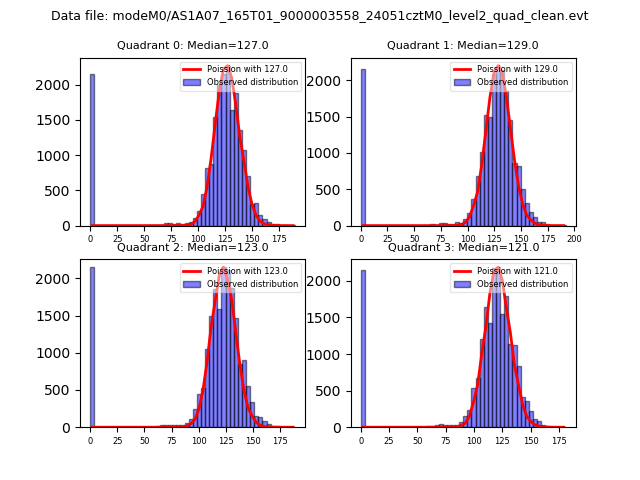 |
 |
| Quadrant-wise count rates Data is divided into 100 sec bins |
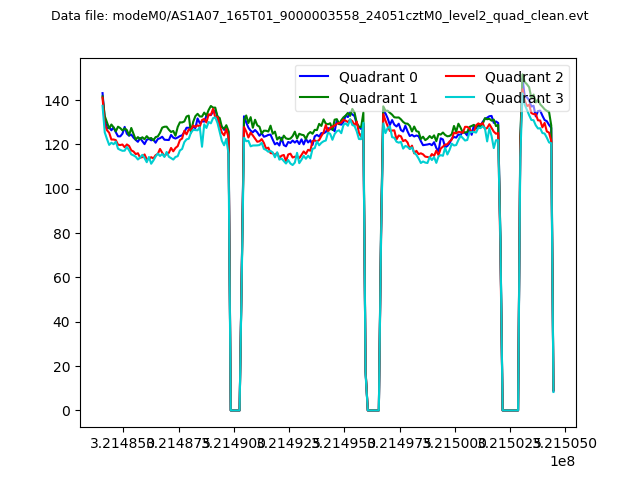 |
|
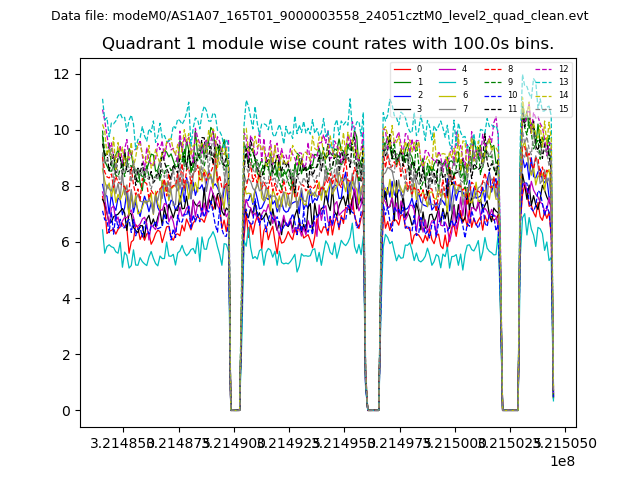
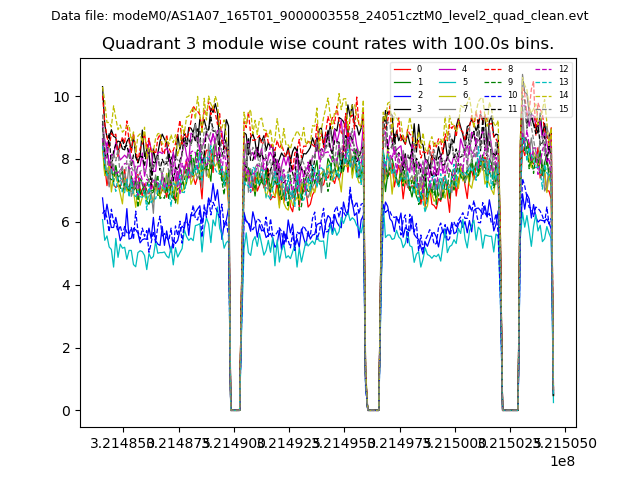
| Module-wise count rates for Quadrant A Data is divided into 100 sec bins |
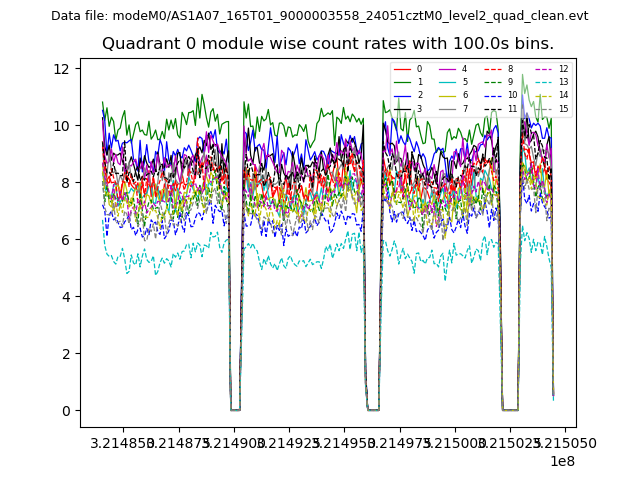 |
 |
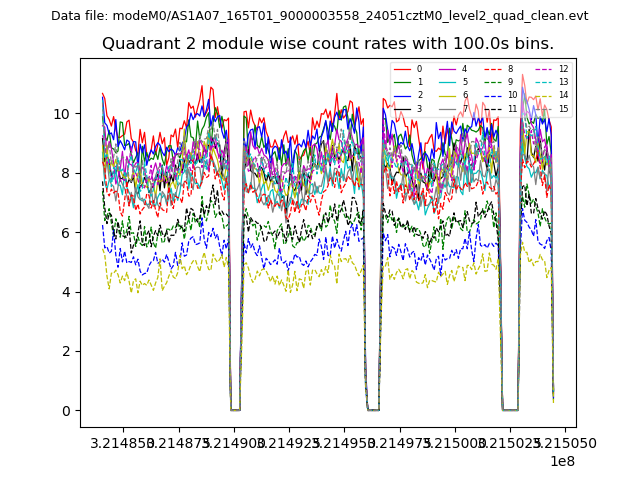
| Module-wise count rates for Quadrant B Data is divided into 100 sec bins |
 |
 |
| Module-wise count rates for Quadrant C Data is divided into 100 sec bins |
 |
 |
| Module-wise count rates for Quadrant D Data is divided into 100 sec bins |
 |
 |
| Parameter | Plot |
|---|---|
| CZT HV Monitor | 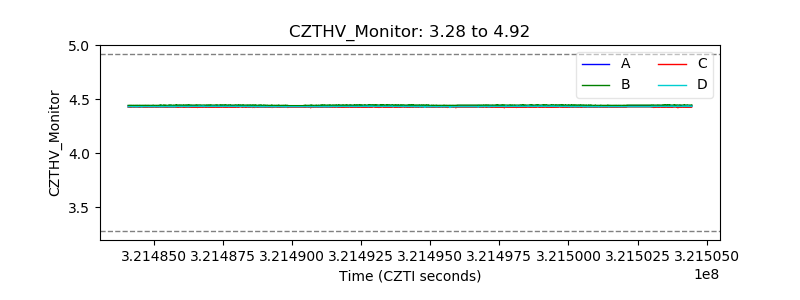 |
| D_VDD | 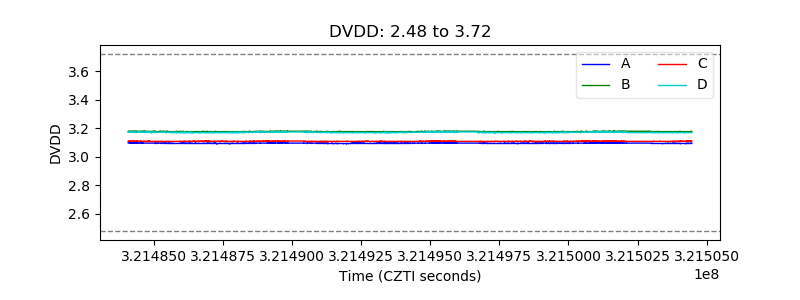 |
| Temperature 1 | 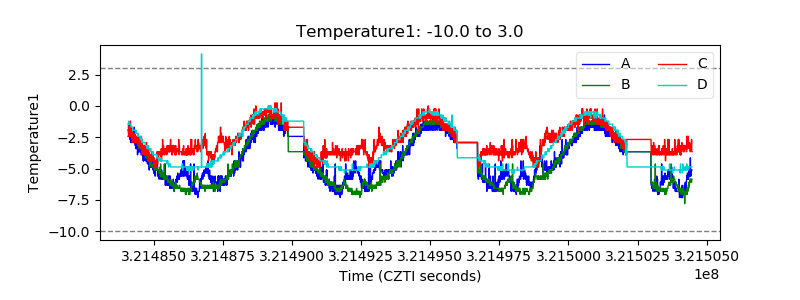 |
| Veto HV Monitor | 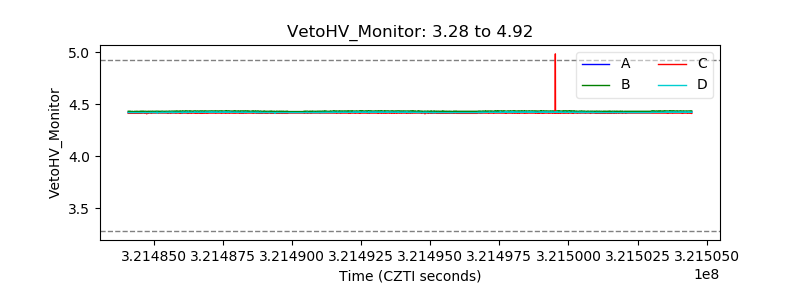 |
| Veto LLD | 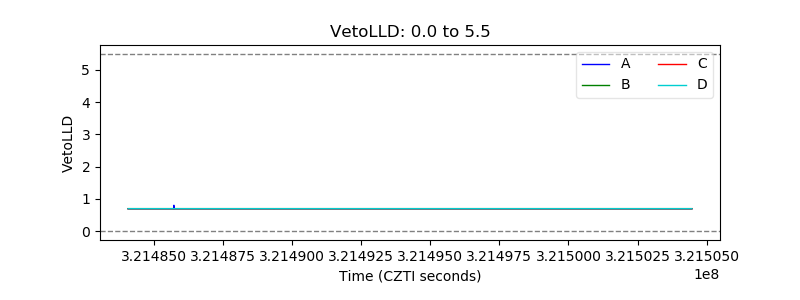 |
| Alpha Counter | 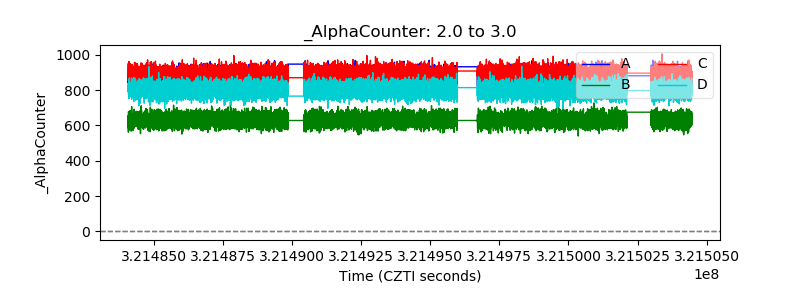 |
| _CPM_Rate | 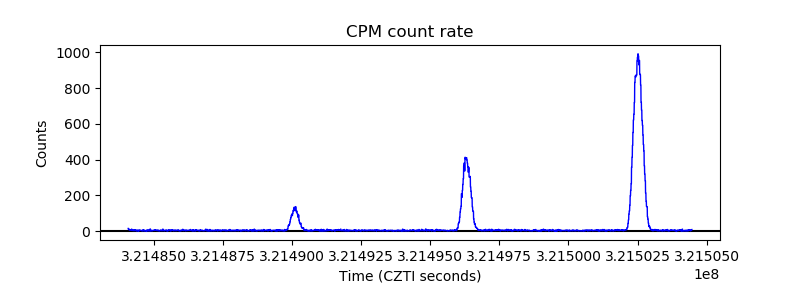 |
| CZT Counter | 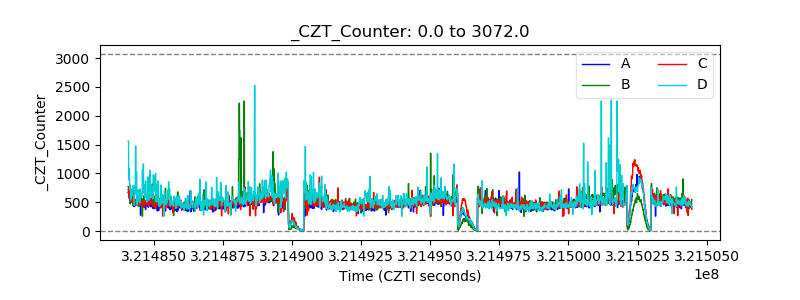 |
| +2.5 Volts monitor | 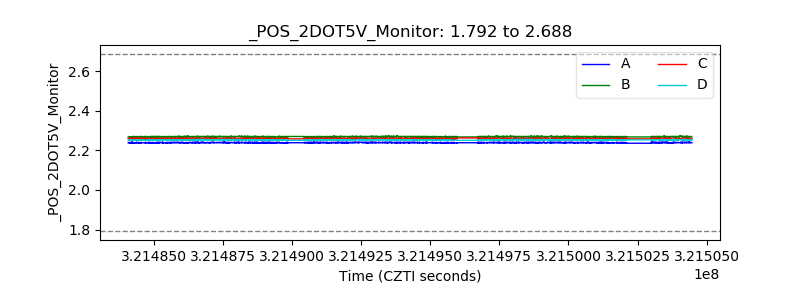 |
| +5 Volts monitor |  |
| _ROLL_ROT | 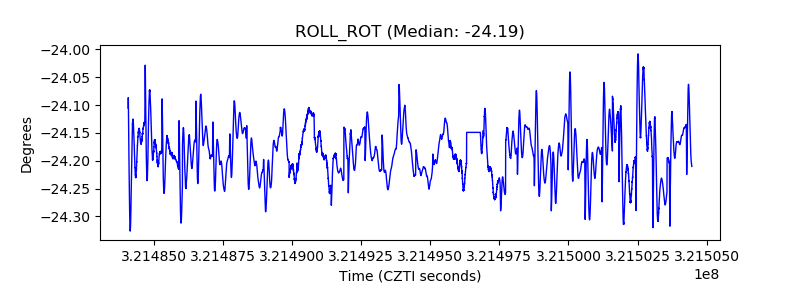 |
| _Roll_DEC | 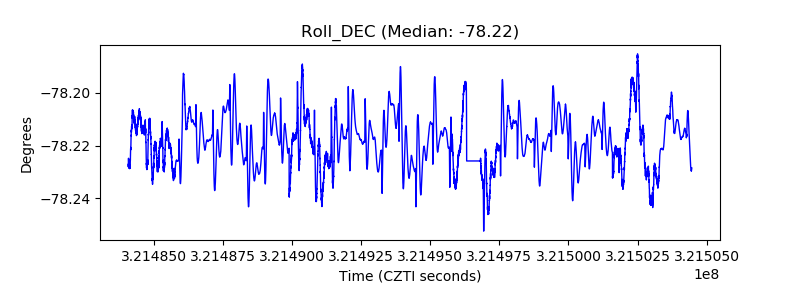 |
| _Roll_RA | 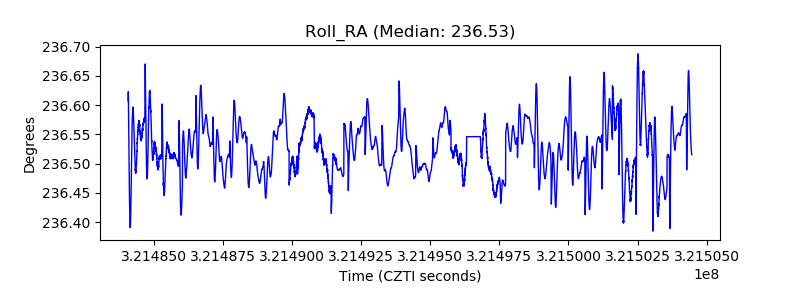 |
| Veto Counter | 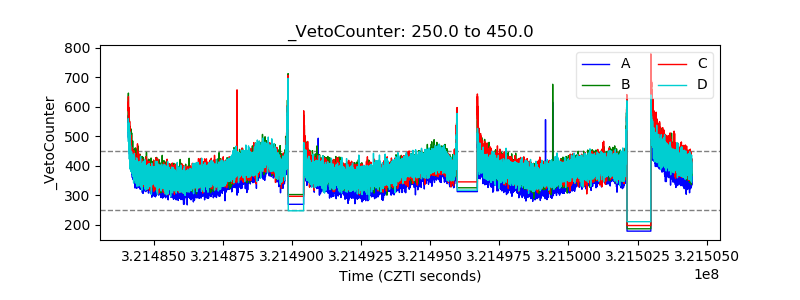 |