| Param | Original file | Final file |
|---|---|---|
| Filename | modeM0/AS1A07_165T01_9000003558_24054cztM0_level2.evt | modeM0/AS1A07_165T01_9000003558_24054cztM0_level2_quad_clean.evt |
| Size (bytes) | 426,706,560 | 126,754,560 |
| Size | 406.9 MB | 120.9 MB |
| Events in quadrant A | 2,956,477 | 860,398 |
| Events in quadrant B | 3,044,599 | 879,734 |
| Events in quadrant C | 3,109,960 | 846,977 |
| Events in quadrant D | 3,399,455 | 828,640 |
| Mode M9 | |||
|---|---|---|---|
| Quadrant | BADHDUFLAG | Total packets | Discarded packets |
| A | 0 | 11 | 0 |
| B | 0 | 11 | 0 |
| C | 0 | 11 | 0 |
| D | 0 | 11 | 0 |
| Mode M0 | |||
|---|---|---|---|
| Quadrant | BADHDUFLAG | Total packets | Discarded packets |
| A | 0 | 12584 | 1 |
| B | 0 | 12788 | 1 |
| C | 0 | 12970 | 1 |
| D | 0 | 13906 | 1 |
| Mode SS | |||
|---|---|---|---|
| Quadrant | BADHDUFLAG | Total packets | Discarded packets |
| A | 0 | 124 | 0 |
| B | 0 | 124 | 0 |
| C | 0 | 124 | 0 |
| D | 0 | 124 | 0 |
| Quadrant | Total seconds | Saturated seconds | Saturation percentage |
|---|---|---|---|
| A | 6063 | 20 | 0.329870% |
| B | 6064 | 22 | 0.362797% |
| C | 6064 | 70 | 1.154354% |
| D | 6064 | 28 | 0.461741% |
Noise dominated data is calculated using 1-second bins in cleaned event files. If a bin has >2000 counts, and if more than 50% of those come from <1% of pixels, then it is considered to be noise-dominated and hence unusable.
| Quadrant | # 1 sec bins | Bins with >0 counts | Bins with >2000 counts | High rate bins dominated by noise | Noise dominated (total time) | Noise dominated (detector-on time) | Marked lightcurve |
|---|---|---|---|---|---|---|---|
| A | 7188 | 6064 | 0 | 0 | 0.00% | 0.00% | 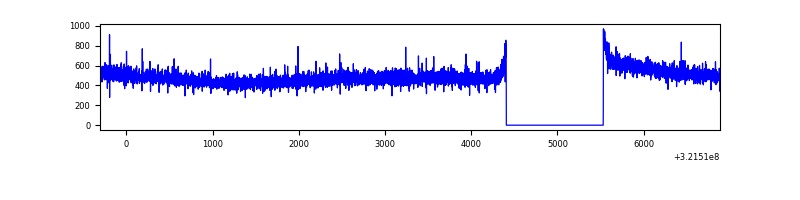 |
| B | 7189 | 6065 | 0 | 0 | 0.00% | 0.00% | 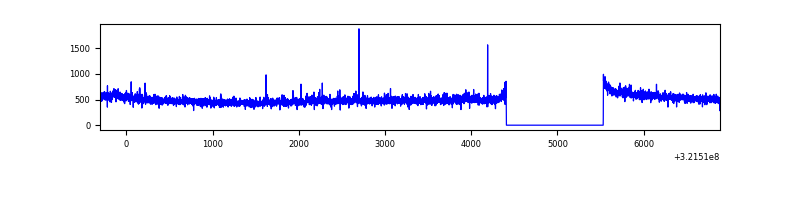 |
| C | 7189 | 6065 | 0 | 0 | 0.00% | 0.00% | 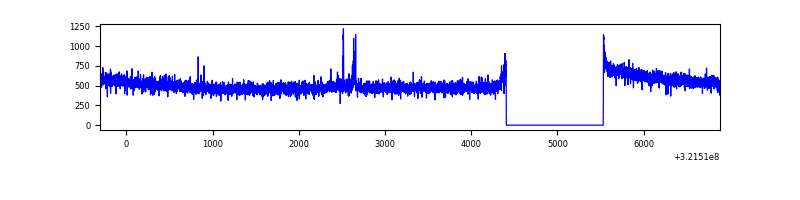 |
| D | 7189 | 6065 | 10 | 10 | 0.14% | 0.16% | 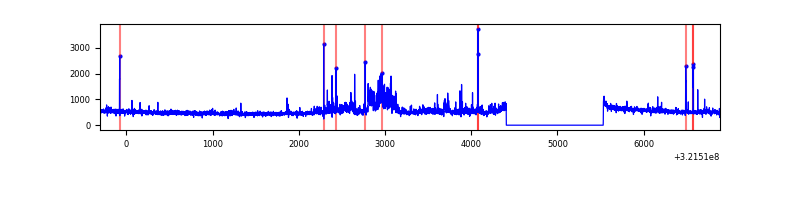 |
Top three noisy pixels from each quadrant. If the there are fewer than three noisy pixels in the level2.evt file, extra rows are filled as -1
| Pixel properties | Quadrant properties | ||||||
|---|---|---|---|---|---|---|---|
| Quadrant | DetID | PixID | Counts | Sigma | Mean | Median | Sigma |
| A | 13 | 254 | 10451 | 64.49 | 764 | 749 | 150.4 |
| A | 2 | 250 | 6729 | 39.75 | 764 | 749 | 150.4 |
| A | 0 | 226 | 6636 | 39.13 | 764 | 749 | 150.4 |
| B | 0 | 189 | 21372 | 144.81 | 764 | 745 | 142.4 |
| B | 12 | 111 | 16485 | 110.5 | 764 | 745 | 142.4 |
| B | 11 | 111 | 14543 | 96.87 | 764 | 745 | 142.4 |
| C | 14 | 238 | 118574 | 679.14 | 746 | 752 | 173.5 |
| C | 7 | 247 | 77328 | 441.39 | 746 | 752 | 173.5 |
| C | 13 | 61 | 5141 | 25.3 | 746 | 752 | 173.5 |
| D | 8 | 195 | 426206 | 2327.14 | 756 | 735 | 182.8 |
| D | 1 | 52 | 75605 | 409.51 | 756 | 735 | 182.8 |
| D | 2 | 234 | 26042 | 138.42 | 756 | 735 | 182.8 |
Histogram calculated using DETX and DETY for each event in the final _common_clean file
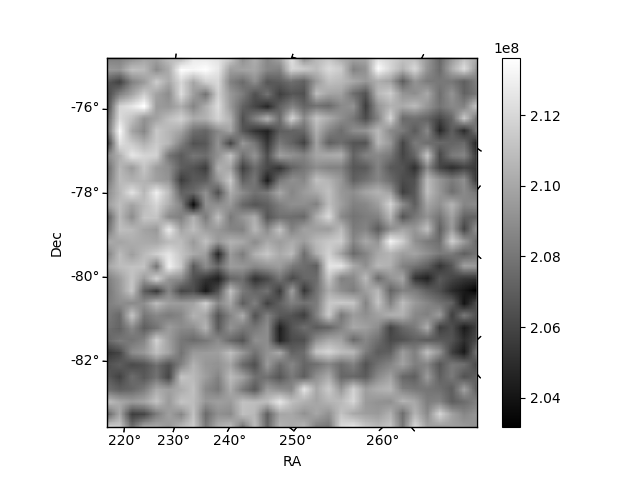
| Quadrant A |  |
 |
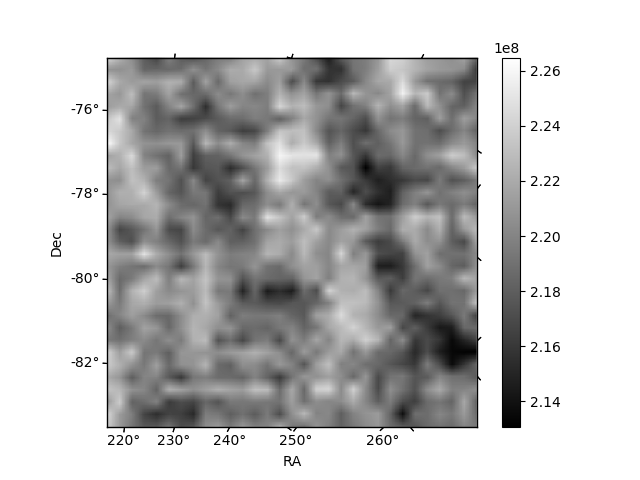
Quadrant B |
|---|---|---|---|
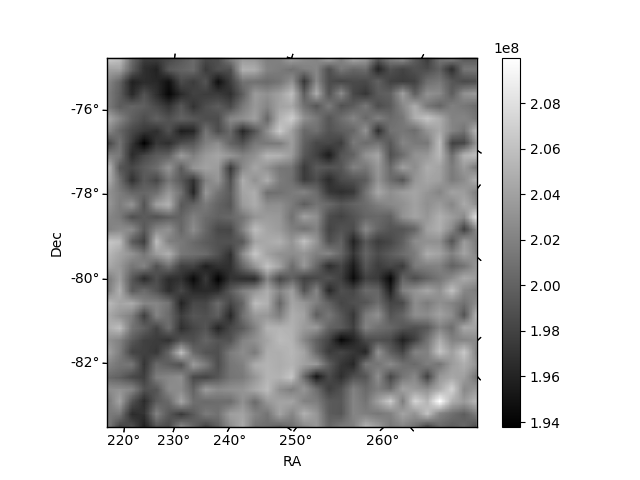
| Quadrant D | 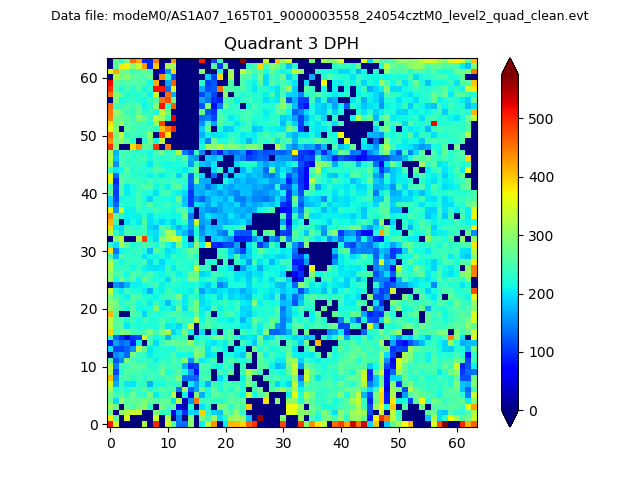 |
 |
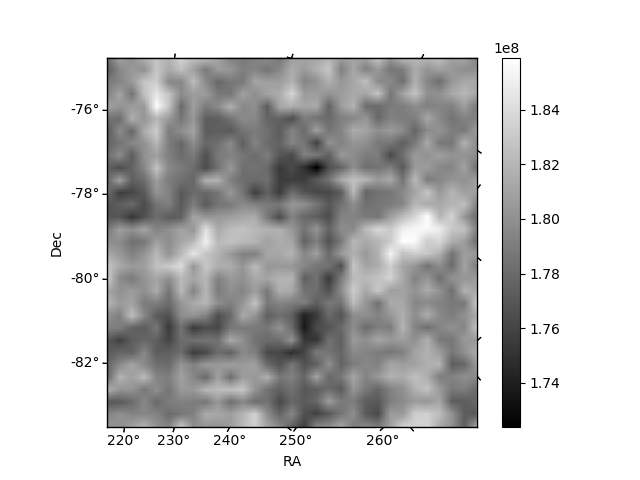
Quadrant C |
| Plot type | Count rate plots | Images |
|---|---|---|
| Comparison with Poisson distribution Blue bars denote a histogram of data divided into 1 sec bins. Red curve is a Poisson curve with rate = median count rate of data. |
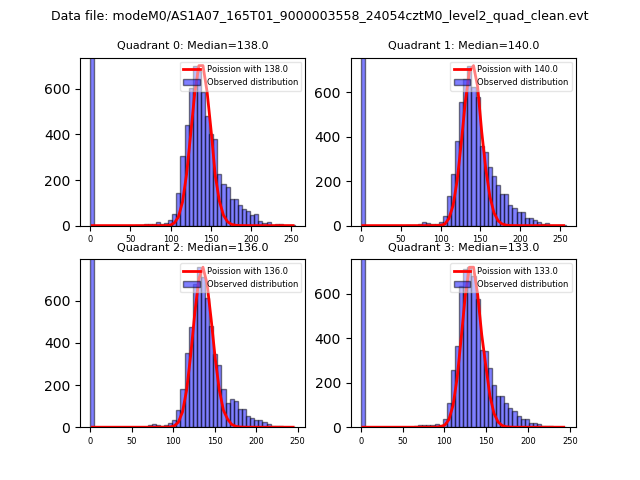 |
 |
| Quadrant-wise count rates Data is divided into 100 sec bins |
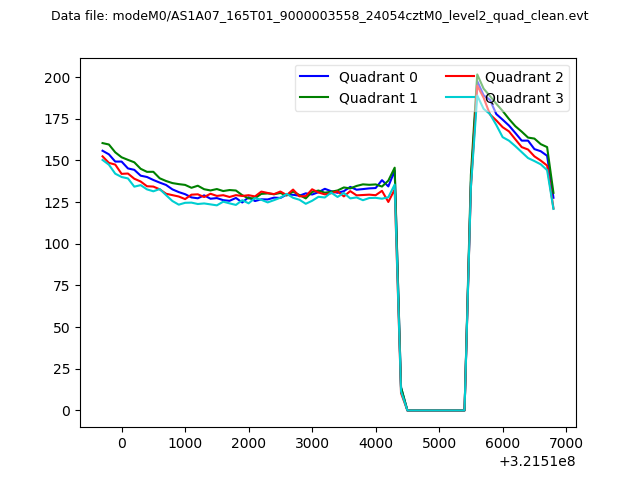 |
|
| Module-wise count rates for Quadrant A Data is divided into 100 sec bins |
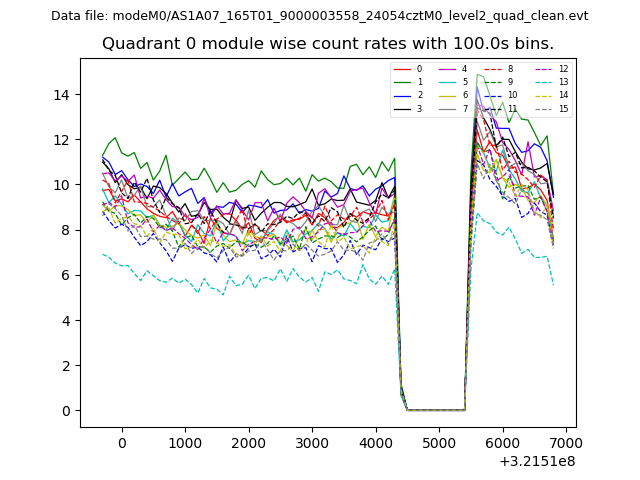 |
 |
| Module-wise count rates for Quadrant B Data is divided into 100 sec bins |
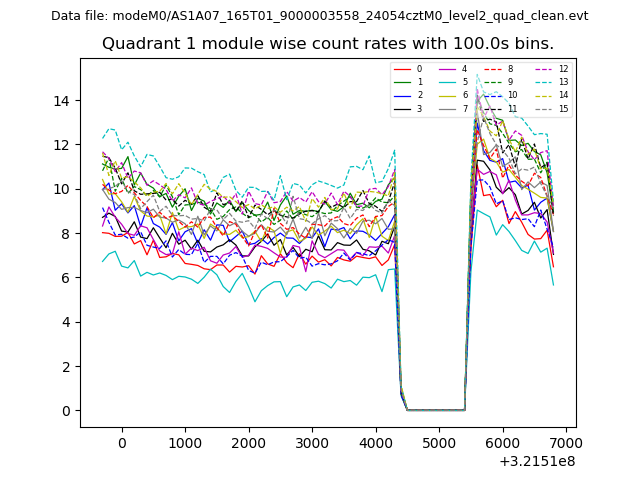 |
 |
| Module-wise count rates for Quadrant C Data is divided into 100 sec bins |
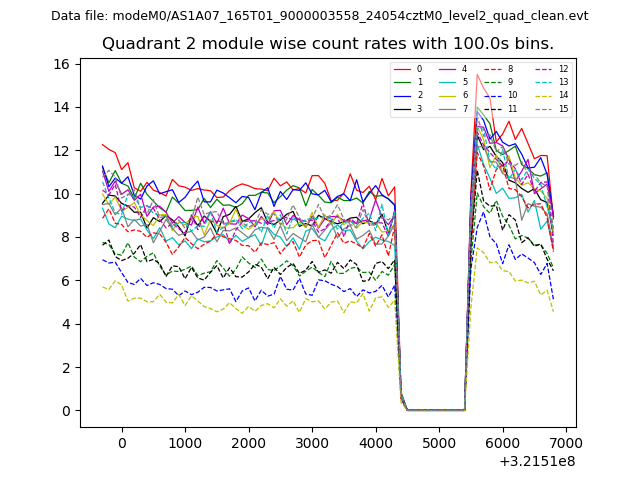 |
 |
| Module-wise count rates for Quadrant D Data is divided into 100 sec bins |
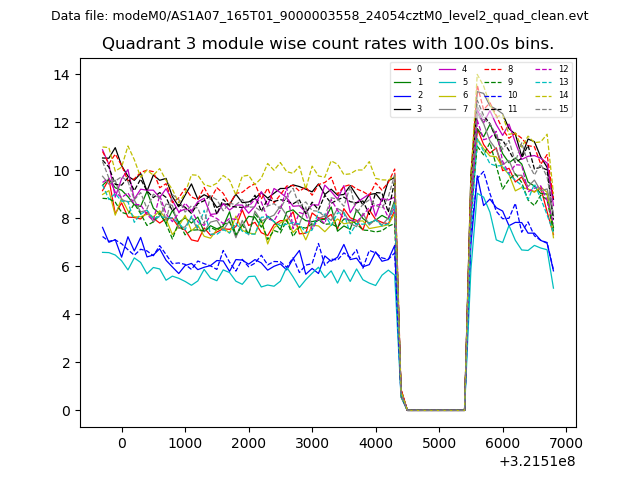 |
 |
| Parameter | Plot |
|---|---|
| CZT HV Monitor | 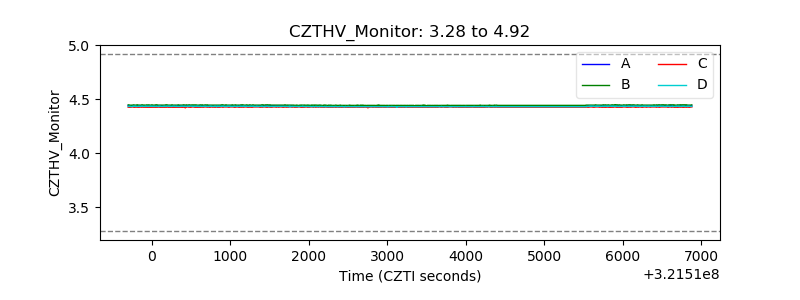 |
| D_VDD | 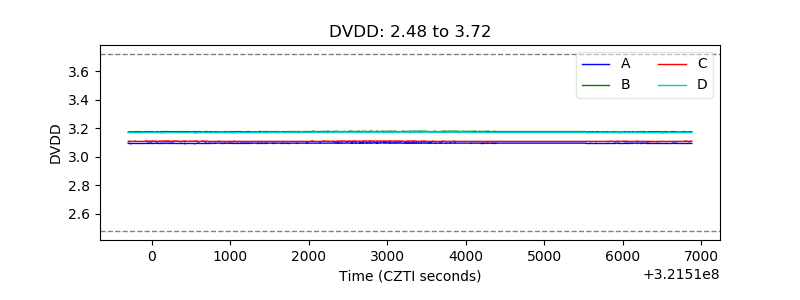 |
| Temperature 1 | 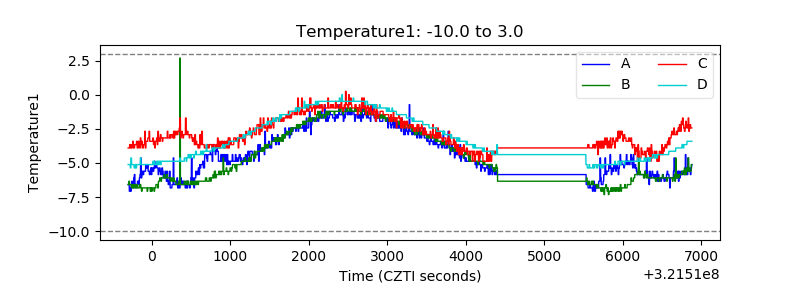 |
| Veto HV Monitor | 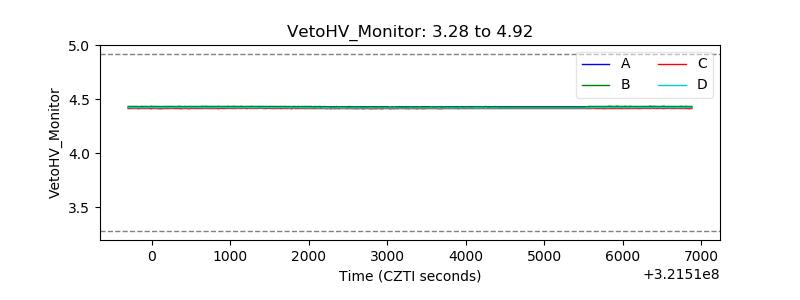 |
| Veto LLD | 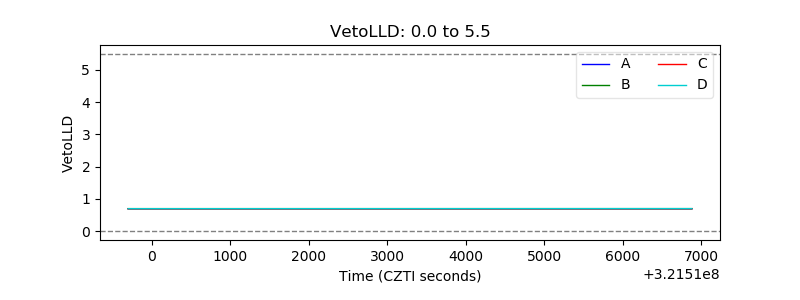 |
| Alpha Counter | 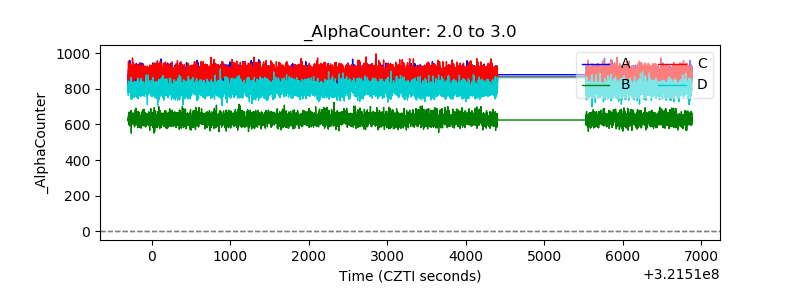 |
| _CPM_Rate | 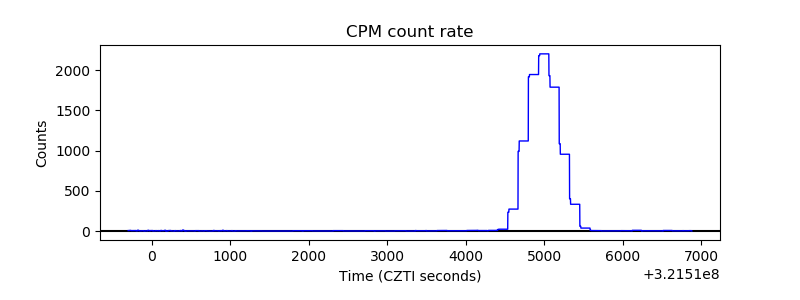 |
| CZT Counter | 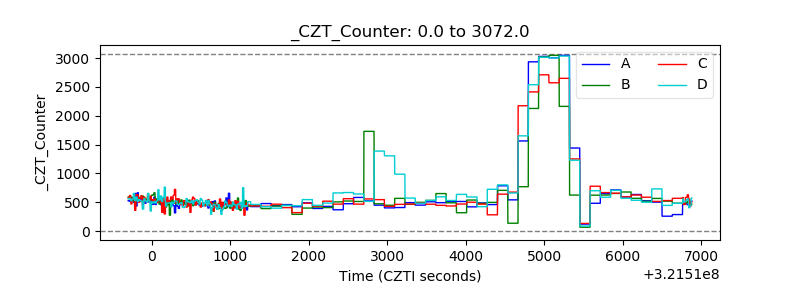 |
| +2.5 Volts monitor |  |
| +5 Volts monitor |  |
| _ROLL_ROT | 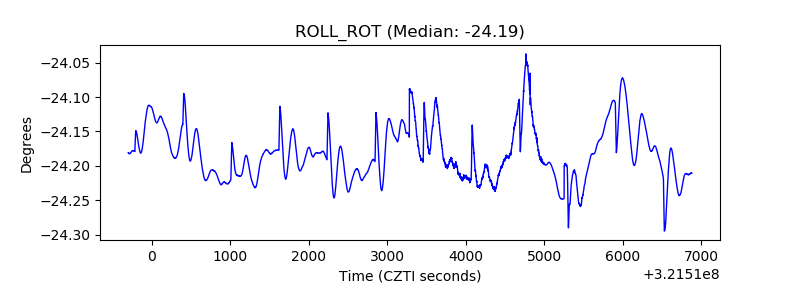 |
| _Roll_DEC | 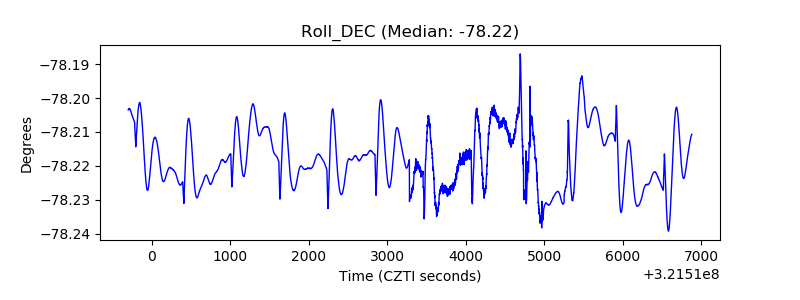 |
| _Roll_RA | 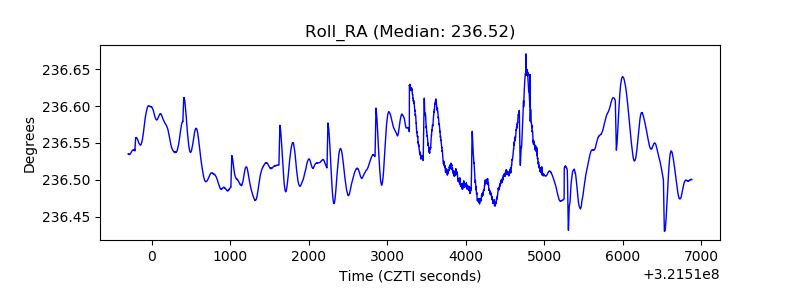 |
| Veto Counter | 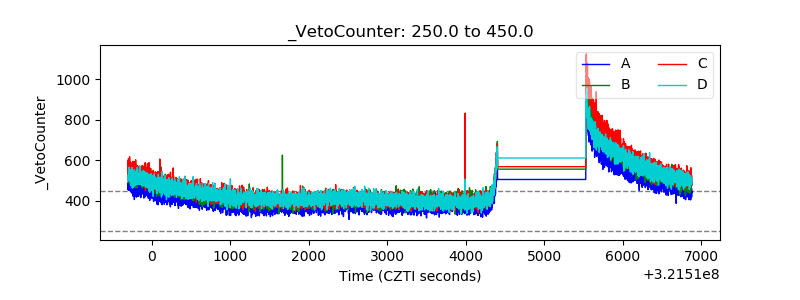 |