| Param | Original file | Final file |
|---|---|---|
| Filename | modeM0/AS1A07_165T01_9000003558_24058cztM0_level2.evt | modeM0/AS1A07_165T01_9000003558_24058cztM0_level2_quad_clean.evt |
| Size (bytes) | 445,426,560 | 134,879,040 |
| Size | 424.8 MB | 128.6 MB |
| Events in quadrant A | 3,134,508 | 928,966 |
| Events in quadrant B | 3,248,948 | 939,030 |
| Events in quadrant C | 3,414,667 | 896,992 |
| Events in quadrant D | 3,272,236 | 889,550 |
| Mode M9 | |||
|---|---|---|---|
| Quadrant | BADHDUFLAG | Total packets | Discarded packets |
| A | 0 | 12 | 0 |
| B | 0 | 12 | 0 |
| C | 0 | 12 | 0 |
| D | 0 | 12 | 0 |
| Mode M0 | |||
|---|---|---|---|
| Quadrant | BADHDUFLAG | Total packets | Discarded packets |
| A | 0 | 12915 | 1 |
| B | 0 | 13244 | 1 |
| C | 0 | 13757 | 1 |
| D | 0 | 13460 | 1 |
| Mode SS | |||
|---|---|---|---|
| Quadrant | BADHDUFLAG | Total packets | Discarded packets |
| A | 0 | 126 | 0 |
| B | 0 | 126 | 0 |
| C | 0 | 126 | 0 |
| D | 0 | 126 | 0 |
| Quadrant | Total seconds | Saturated seconds | Saturation percentage |
|---|---|---|---|
| A | 6169 | 72 | 1.167126% |
| B | 6170 | 98 | 1.588331% |
| C | 6170 | 125 | 2.025932% |
| D | 6170 | 81 | 1.312804% |
Noise dominated data is calculated using 1-second bins in cleaned event files. If a bin has >2000 counts, and if more than 50% of those come from <1% of pixels, then it is considered to be noise-dominated and hence unusable.
| Quadrant | # 1 sec bins | Bins with >0 counts | Bins with >2000 counts | High rate bins dominated by noise | Noise dominated (total time) | Noise dominated (detector-on time) | Marked lightcurve |
|---|---|---|---|---|---|---|---|
| A | 7394 | 6169 | 0 | 0 | 0.00% | 0.00% | 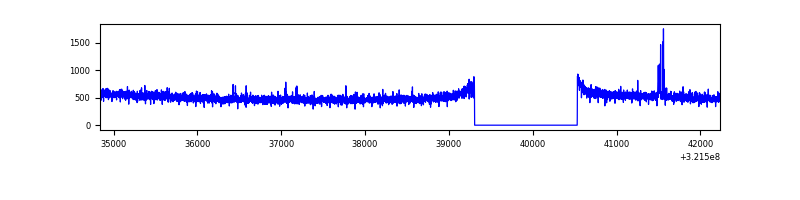 |
| B | 7395 | 6171 | 6 | 6 | 0.08% | 0.10% | 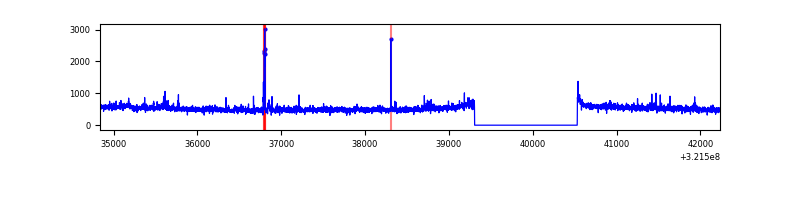 |
| C | 7395 | 6170 | 2 | 2 | 0.03% | 0.03% | 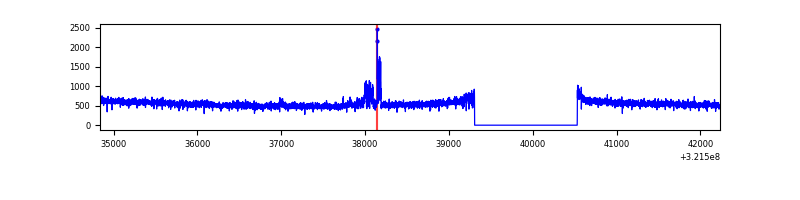 |
| D | 7395 | 6171 | 17 | 17 | 0.23% | 0.28% | 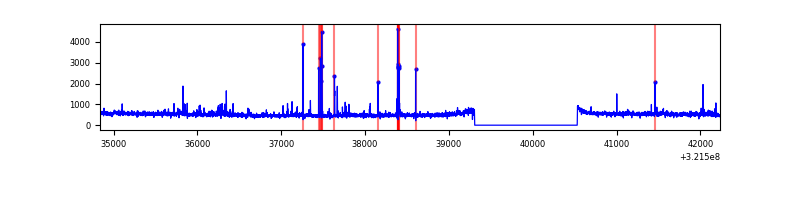 |
Top three noisy pixels from each quadrant. If the there are fewer than three noisy pixels in the level2.evt file, extra rows are filled as -1
| Pixel properties | Quadrant properties | ||||||
|---|---|---|---|---|---|---|---|
| Quadrant | DetID | PixID | Counts | Sigma | Mean | Median | Sigma |
| A | 3 | 1 | 28556 | 175.24 | 804 | 789 | 158.4 |
| A | 13 | 254 | 9568 | 55.41 | 804 | 789 | 158.4 |
| A | 2 | 250 | 8848 | 50.86 | 804 | 789 | 158.4 |
| B | 0 | 189 | 78514 | 536.6 | 795 | 778 | 144.9 |
| B | 0 | 245 | 33024 | 222.59 | 795 | 778 | 144.9 |
| B | 12 | 111 | 16362 | 107.57 | 795 | 778 | 144.9 |
| C | 7 | 247 | 230854 | 1335.44 | 762 | 769 | 172.3 |
| C | 14 | 238 | 124651 | 719.02 | 762 | 769 | 172.3 |
| C | 0 | 239 | 85067 | 489.27 | 762 | 769 | 172.3 |
| D | 1 | 52 | 133070 | 707.04 | 783 | 763 | 187.1 |
| D | 8 | 195 | 68143 | 360.07 | 783 | 763 | 187.1 |
| D | 11 | 176 | 47440 | 249.44 | 783 | 763 | 187.1 |
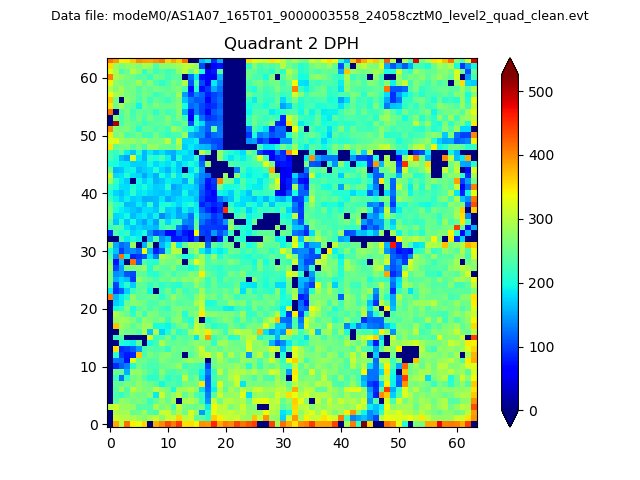
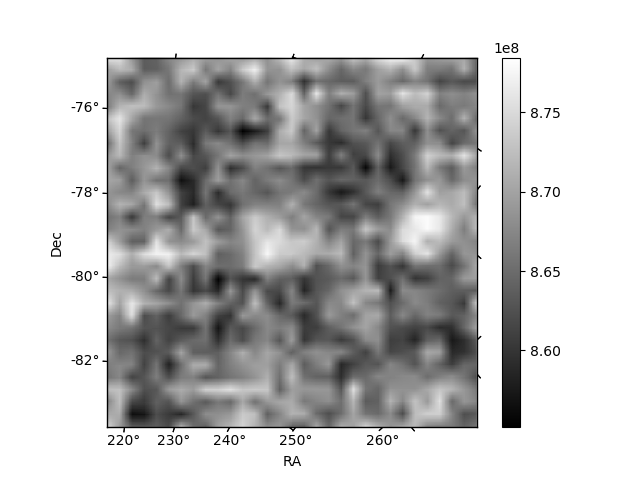
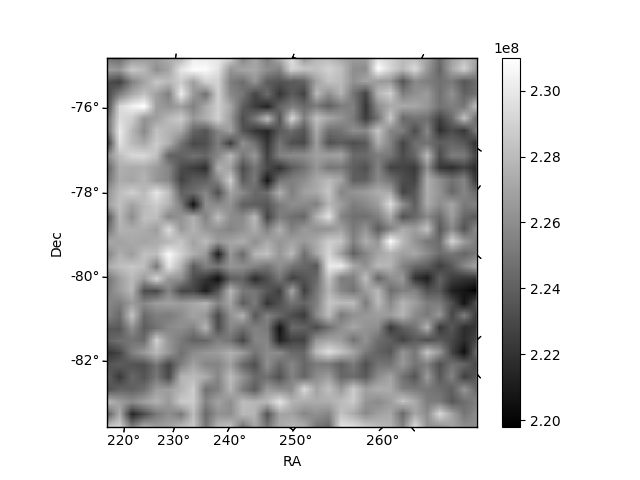
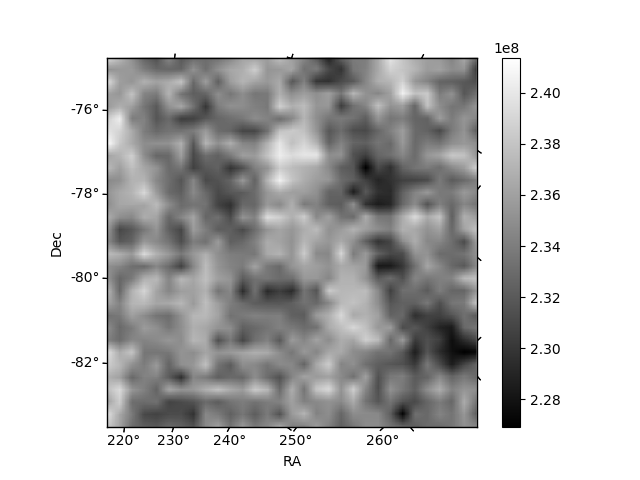
Histogram calculated using DETX and DETY for each event in the final _common_clean file
| Quadrant A | 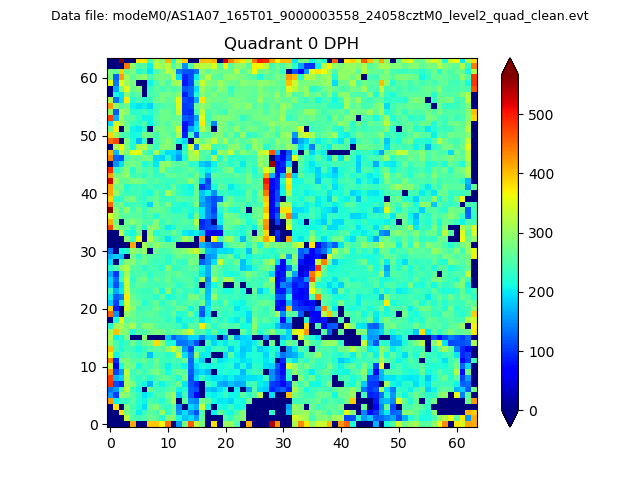 |
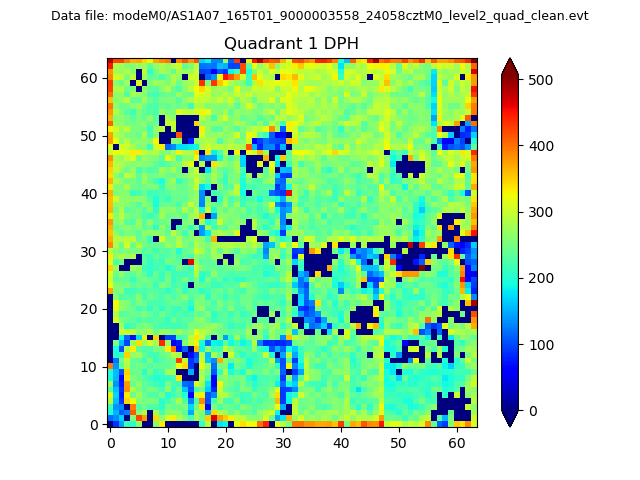 |
Quadrant B |
|---|---|---|---|
| Quadrant D | 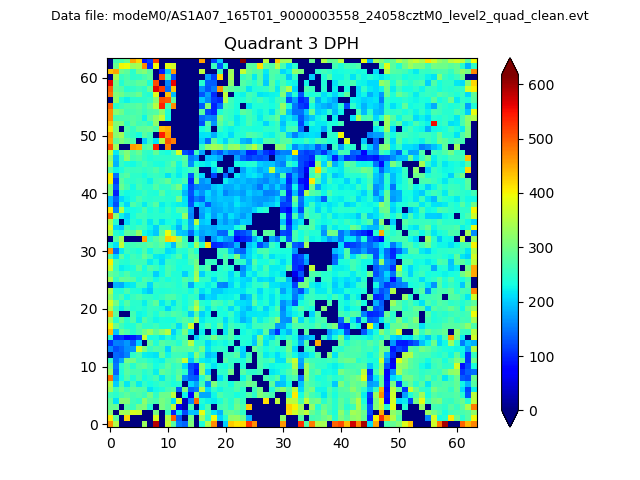 |
 |
Quadrant C |
| Plot type | Count rate plots | Images |
|---|---|---|
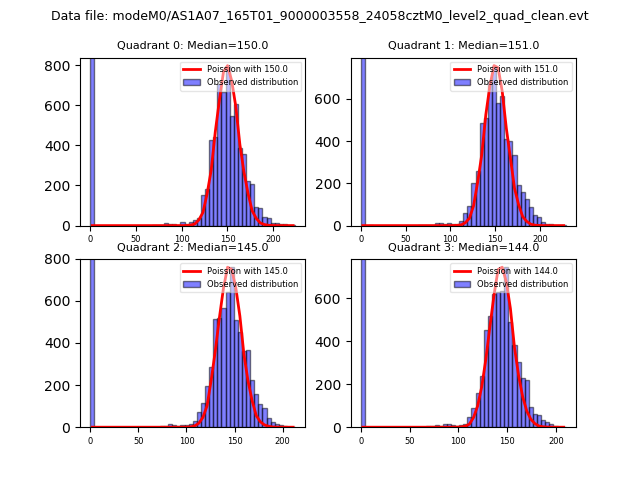
| Comparison with Poisson distribution Blue bars denote a histogram of data divided into 1 sec bins. Red curve is a Poisson curve with rate = median count rate of data. |
 |
 |
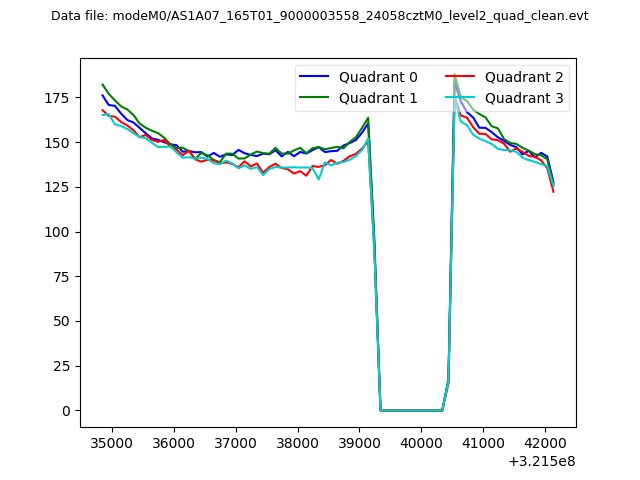
| Quadrant-wise count rates Data is divided into 100 sec bins |
 |
|
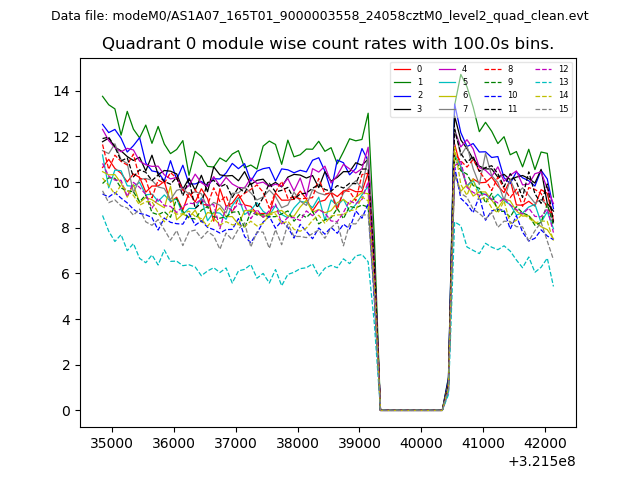
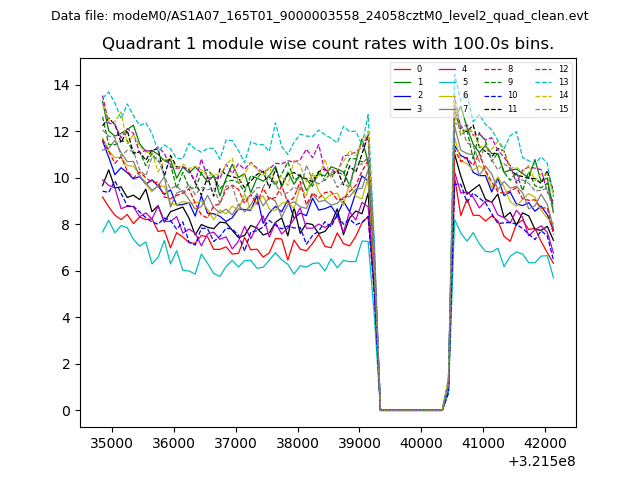
| Module-wise count rates for Quadrant A Data is divided into 100 sec bins |
 |
 |
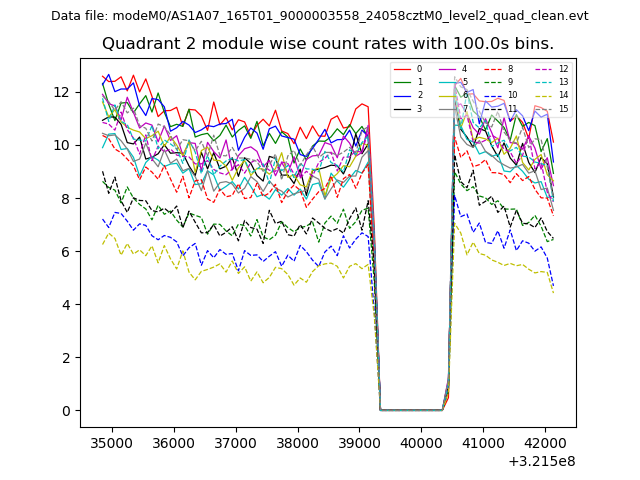
| Module-wise count rates for Quadrant B Data is divided into 100 sec bins |
 |
 |
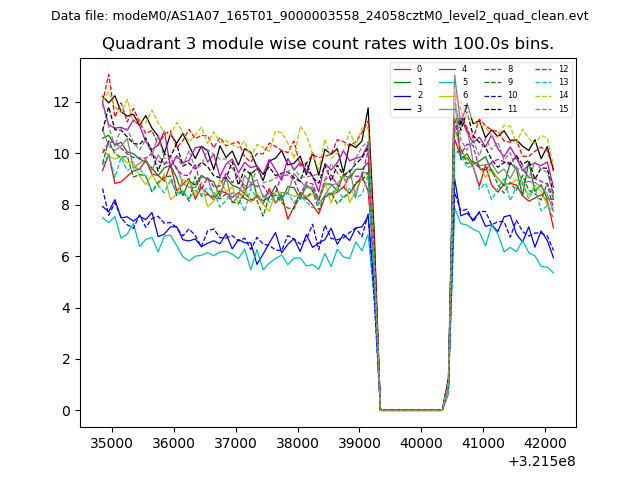
| Module-wise count rates for Quadrant C Data is divided into 100 sec bins |
 |
 |
| Module-wise count rates for Quadrant D Data is divided into 100 sec bins |
 |
 |
| Parameter | Plot |
|---|---|
| CZT HV Monitor | 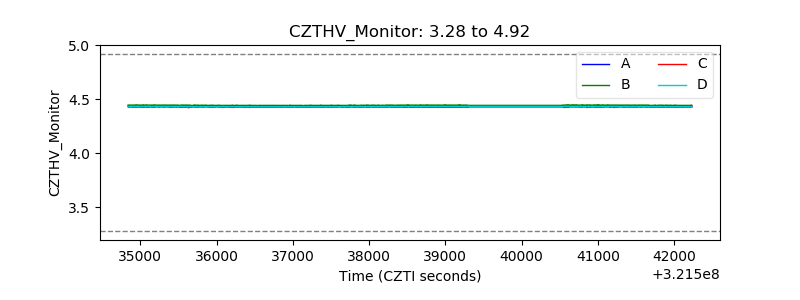 |
| D_VDD | 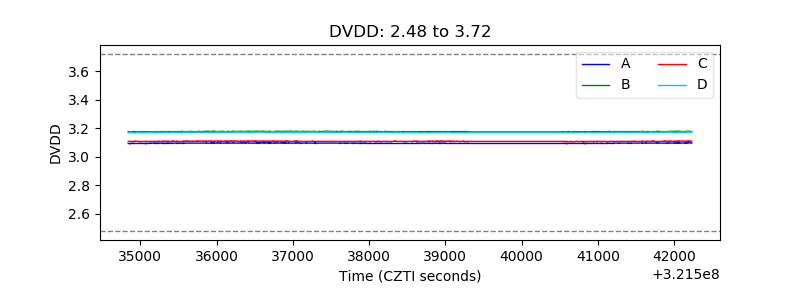 |
| Temperature 1 | 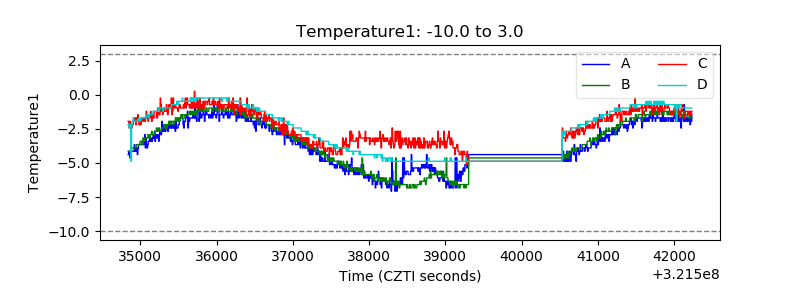 |
| Veto HV Monitor | 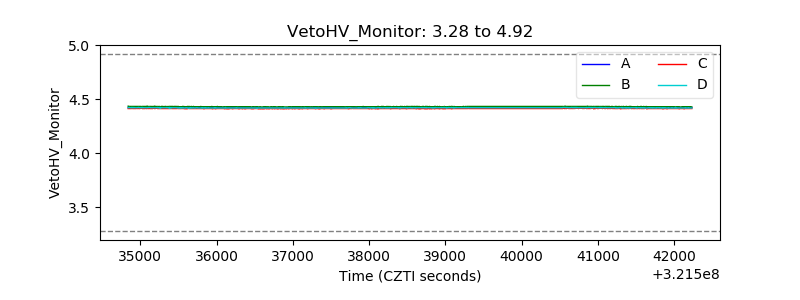 |
| Veto LLD | 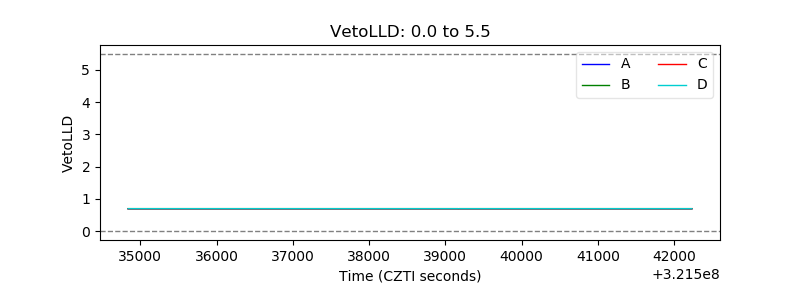 |
| Alpha Counter | 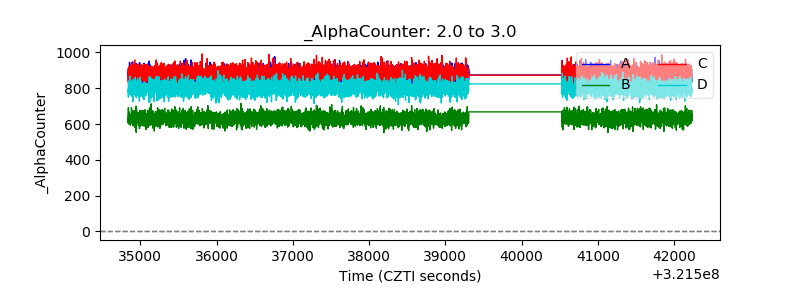 |
| _CPM_Rate | 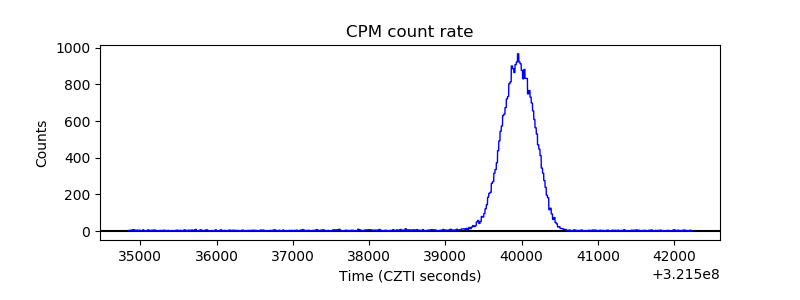 |
| CZT Counter | 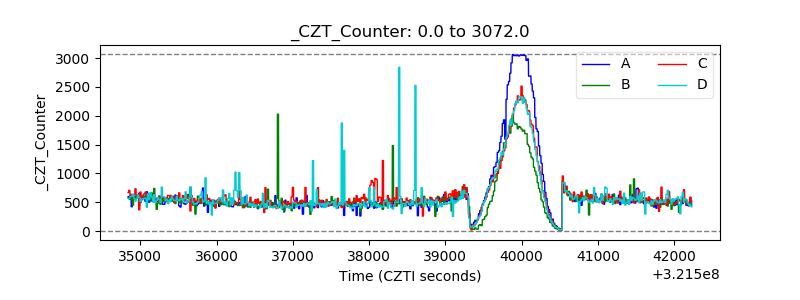 |
| +2.5 Volts monitor |  |
| +5 Volts monitor |  |
| _ROLL_ROT | 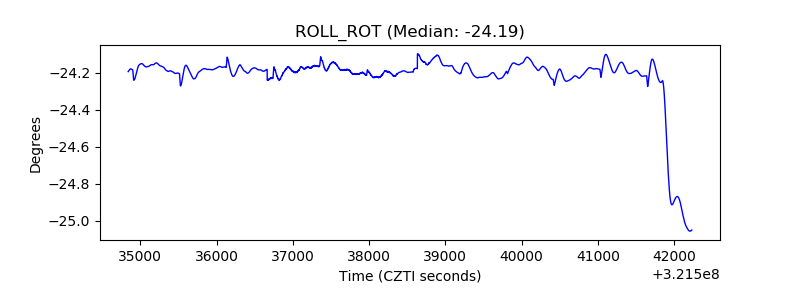 |
| _Roll_DEC | 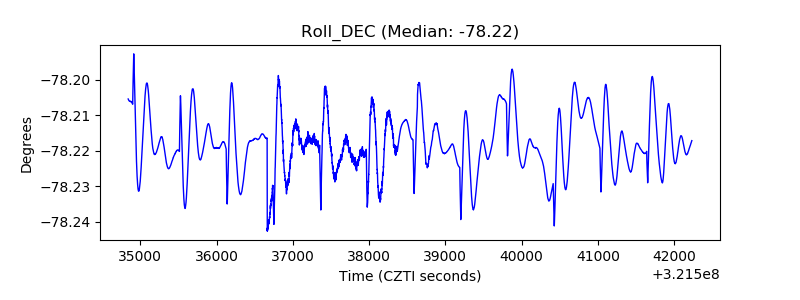 |
| _Roll_RA | 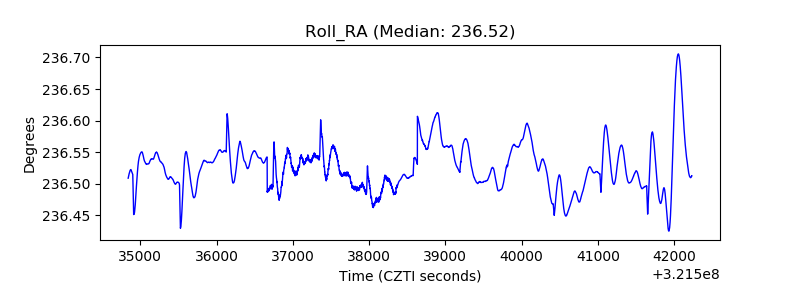 |
| Veto Counter | 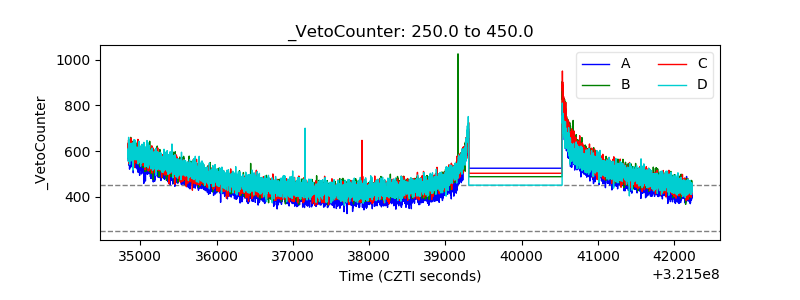 |