| Param | Original file | Final file |
|---|---|---|
| Filename | modeM0/AS1A07_165T01_9000003558_24060cztM0_level2.evt | modeM0/AS1A07_165T01_9000003558_24060cztM0_level2_quad_clean.evt |
| Size (bytes) | 488,448,000 | 133,490,880 |
| Size | 465.8 MB | 127.3 MB |
| Events in quadrant A | 3,193,358 | 906,371 |
| Events in quadrant B | 3,506,353 | 914,912 |
| Events in quadrant C | 4,242,756 | 875,689 |
| Events in quadrant D | 3,387,594 | 871,420 |
| Mode M9 | |||
|---|---|---|---|
| Quadrant | BADHDUFLAG | Total packets | Discarded packets |
| A | 0 | 7 | 0 |
| B | 0 | 7 | 0 |
| C | 0 | 7 | 0 |
| D | 0 | 7 | 0 |
| Mode M0 | |||
|---|---|---|---|
| Quadrant | BADHDUFLAG | Total packets | Discarded packets |
| A | 0 | 13928 | 1 |
| B | 0 | 14707 | 1 |
| C | 0 | 17646 | 1 |
| D | 0 | 14597 | 1 |
| Mode SS | |||
|---|---|---|---|
| Quadrant | BADHDUFLAG | Total packets | Discarded packets |
| A | 0 | 138 | 0 |
| B | 0 | 138 | 0 |
| C | 0 | 138 | 0 |
| D | 0 | 138 | 0 |
| Quadrant | Total seconds | Saturated seconds | Saturation percentage |
|---|---|---|---|
| A | 6813 | 84 | 1.232937% |
| B | 6813 | 150 | 2.201673% |
| C | 6814 | 129 | 1.893161% |
| D | 6814 | 77 | 1.130026% |
Noise dominated data is calculated using 1-second bins in cleaned event files. If a bin has >2000 counts, and if more than 50% of those come from <1% of pixels, then it is considered to be noise-dominated and hence unusable.
| Quadrant | # 1 sec bins | Bins with >0 counts | Bins with >2000 counts | High rate bins dominated by noise | Noise dominated (total time) | Noise dominated (detector-on time) | Marked lightcurve |
|---|---|---|---|---|---|---|---|
| A | 7458 | 6814 | 0 | 0 | 0.00% | 0.00% | 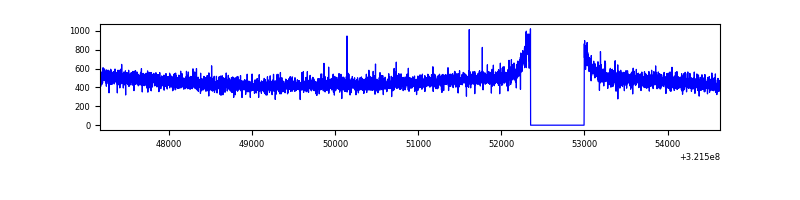 |
| B | 7458 | 6813 | 5 | 5 | 0.07% | 0.07% | 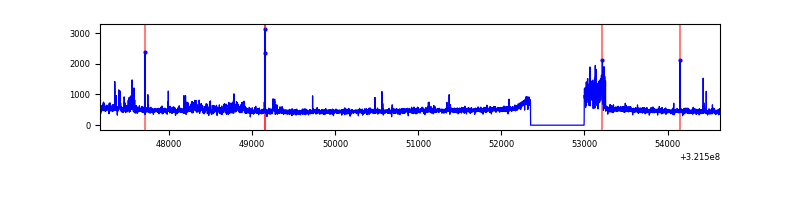 |
| C | 7459 | 6815 | 0 | 0 | 0.00% | 0.00% |  |
| D | 7459 | 6815 | 26 | 26 | 0.35% | 0.38% | 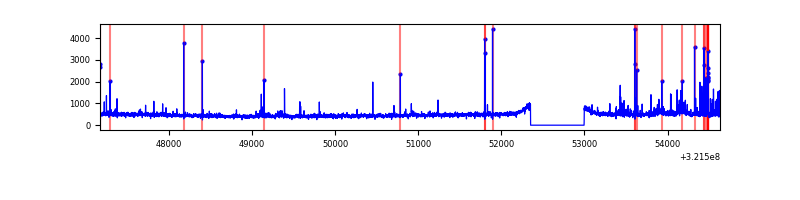 |
Top three noisy pixels from each quadrant. If the there are fewer than three noisy pixels in the level2.evt file, extra rows are filled as -1
| Pixel properties | Quadrant properties | ||||||
|---|---|---|---|---|---|---|---|
| Quadrant | DetID | PixID | Counts | Sigma | Mean | Median | Sigma |
| A | 2 | 250 | 11691 | 66.03 | 824 | 805 | 164.9 |
| A | 13 | 254 | 9557 | 53.08 | 824 | 805 | 164.9 |
| A | 6 | 16 | 7245 | 39.06 | 824 | 805 | 164.9 |
| B | 0 | 189 | 173009 | 1124.05 | 817 | 798 | 153.2 |
| B | 0 | 245 | 95622 | 618.93 | 817 | 798 | 153.2 |
| B | 12 | 111 | 17990 | 112.21 | 817 | 798 | 153.2 |
| C | 7 | 247 | 1046489 | 5784.27 | 784 | 788 | 180.8 |
| C | 14 | 238 | 125851 | 691.78 | 784 | 788 | 180.8 |
| C | 10 | 91 | 9145 | 46.23 | 784 | 788 | 180.8 |
| D | 1 | 52 | 142124 | 729.92 | 803 | 779 | 193.6 |
| D | 8 | 195 | 92913 | 475.79 | 803 | 779 | 193.6 |
| D | 2 | 234 | 35296 | 178.25 | 803 | 779 | 193.6 |
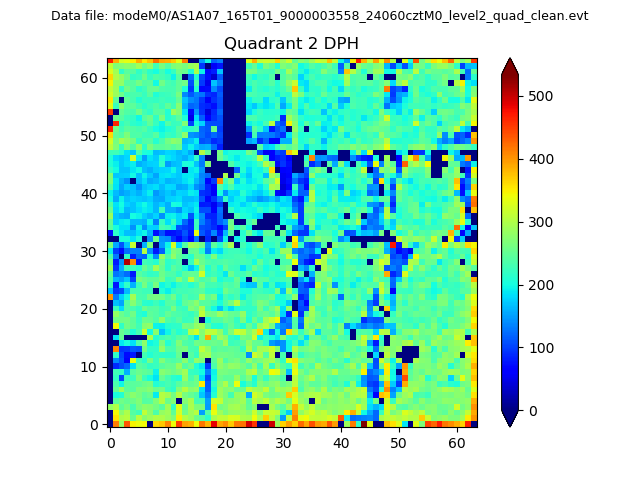
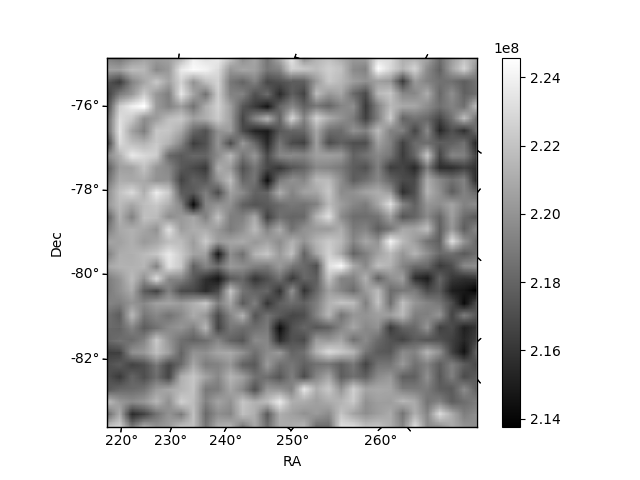
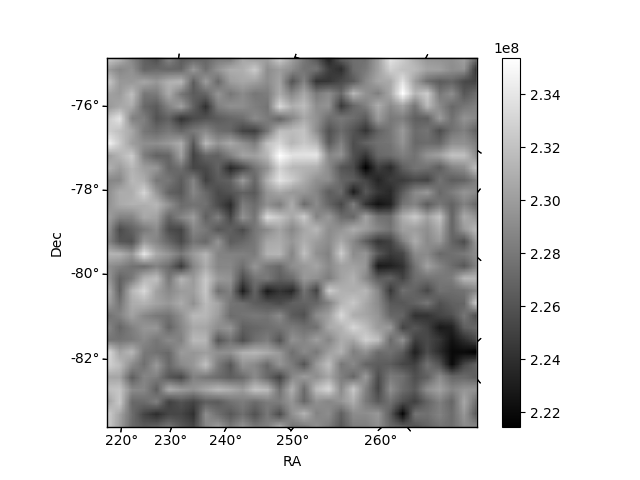
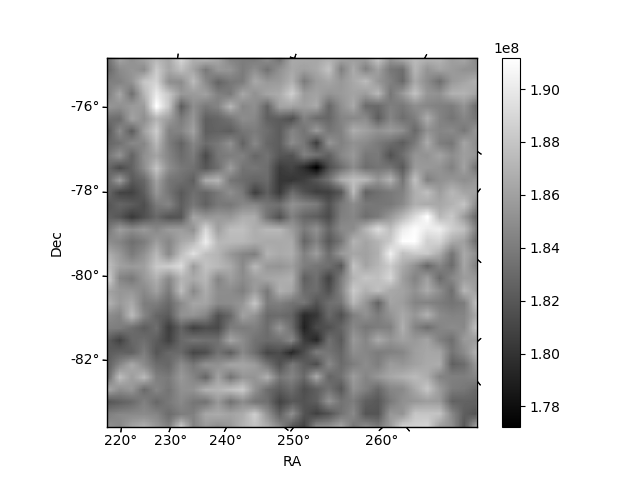
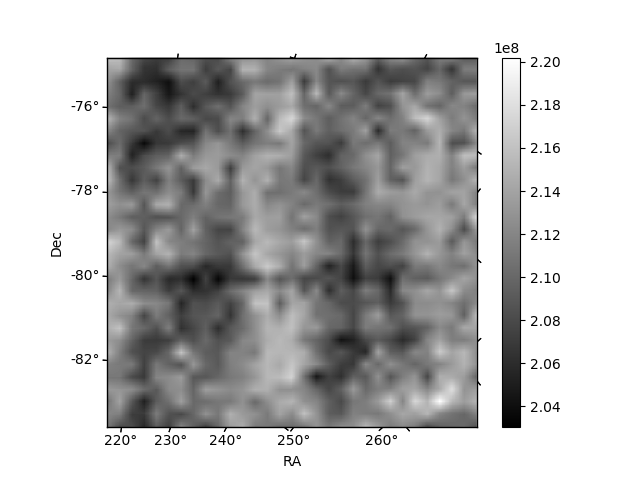
Histogram calculated using DETX and DETY for each event in the final _common_clean file
| Quadrant A | 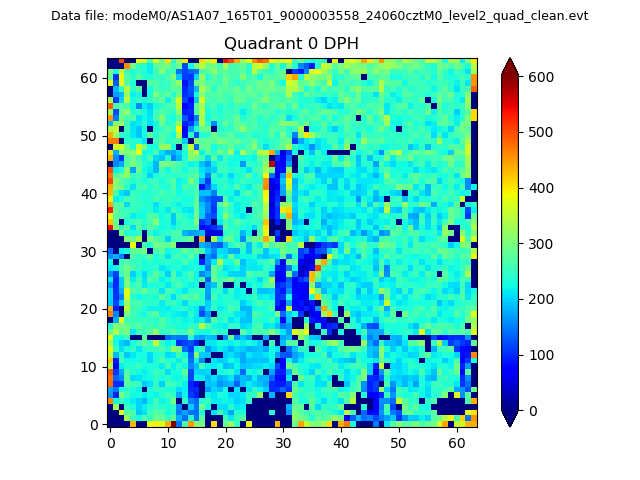 |
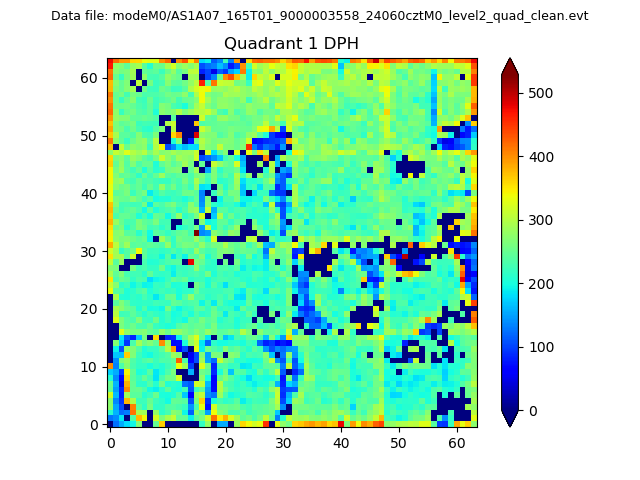 |
Quadrant B |
|---|---|---|---|
| Quadrant D | 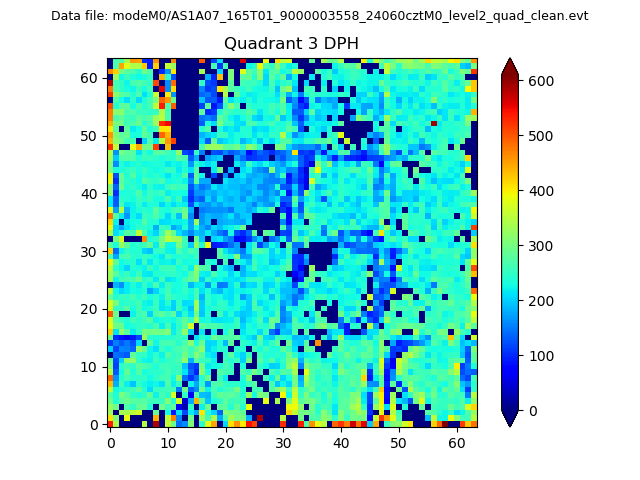 |
 |
Quadrant C |
| Plot type | Count rate plots | Images |
|---|---|---|
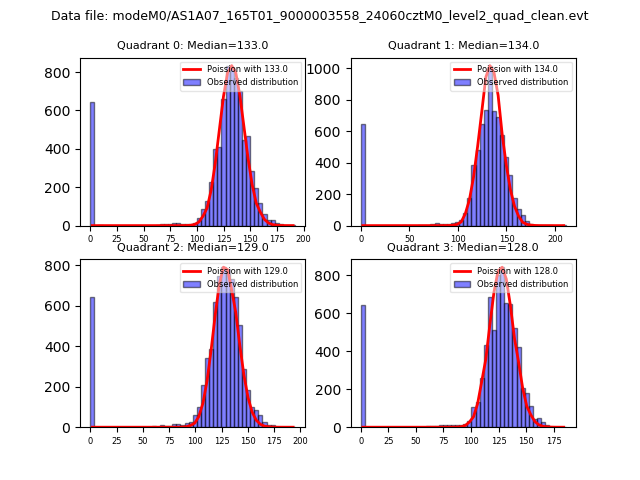
| Comparison with Poisson distribution Blue bars denote a histogram of data divided into 1 sec bins. Red curve is a Poisson curve with rate = median count rate of data. |
 |
 |
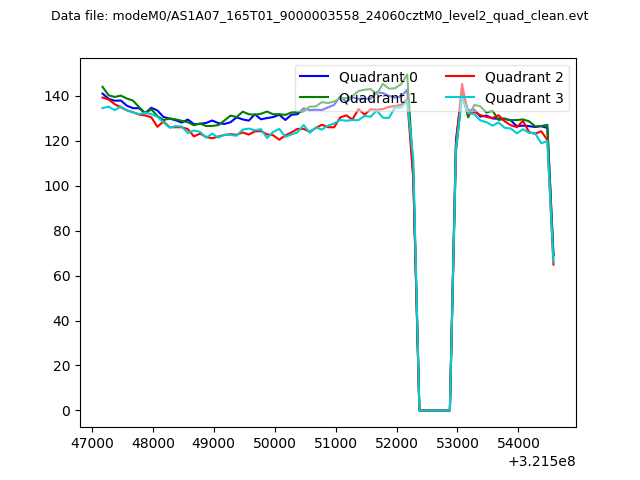
| Quadrant-wise count rates Data is divided into 100 sec bins |
 |
|
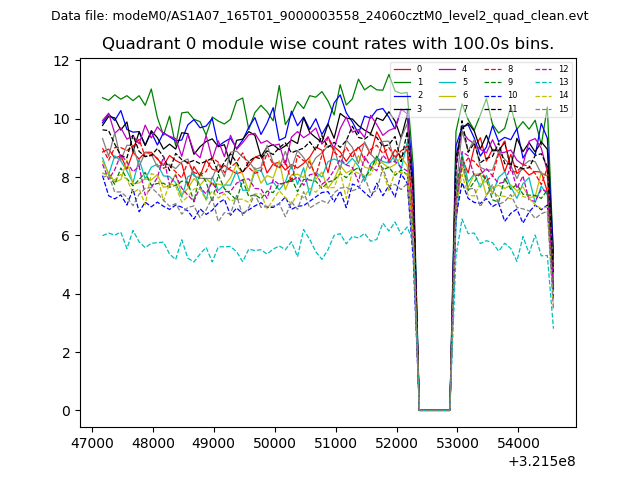
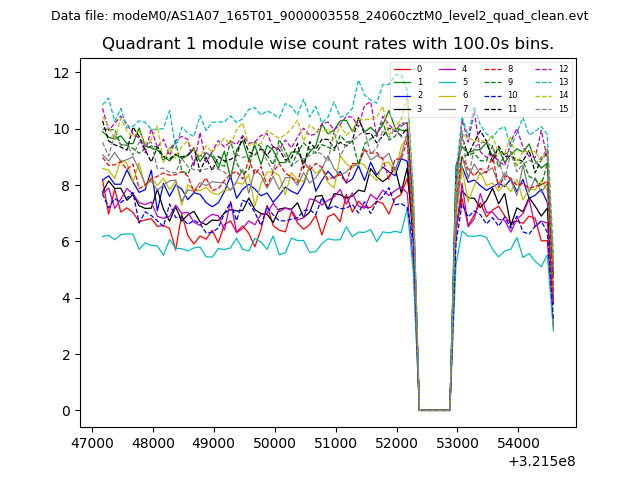
| Module-wise count rates for Quadrant A Data is divided into 100 sec bins |
 |
 |
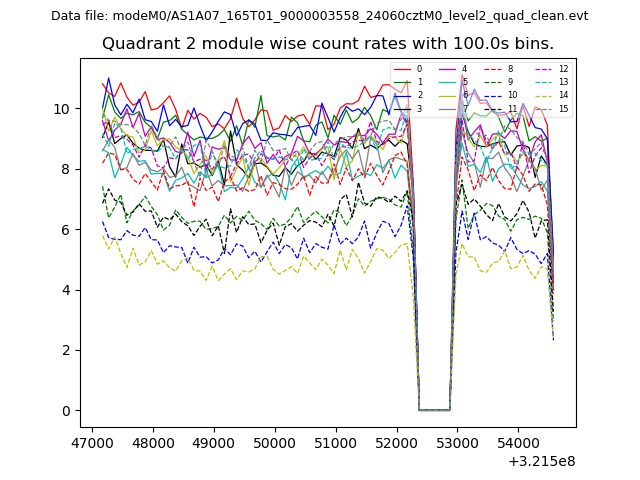
| Module-wise count rates for Quadrant B Data is divided into 100 sec bins |
 |
 |
| Module-wise count rates for Quadrant C Data is divided into 100 sec bins |
 |
 |
| Module-wise count rates for Quadrant D Data is divided into 100 sec bins |
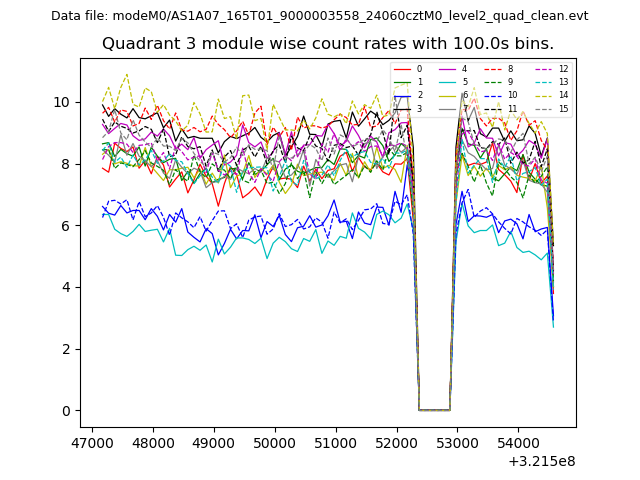 |
 |
| Parameter | Plot |
|---|---|
| CZT HV Monitor | 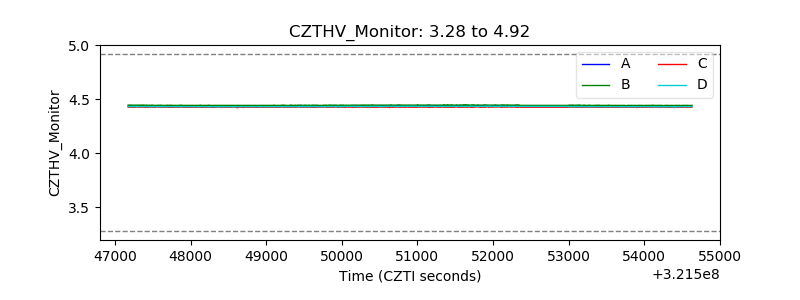 |
| D_VDD | 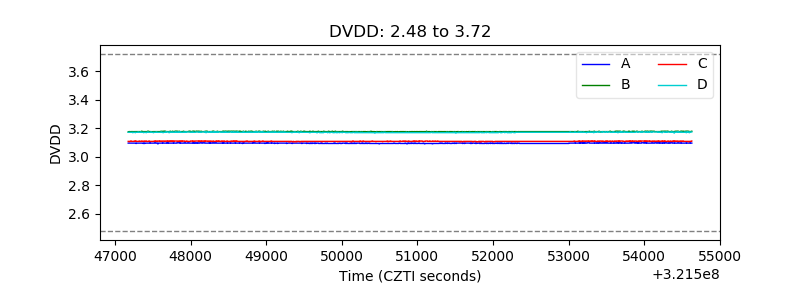 |
| Temperature 1 | 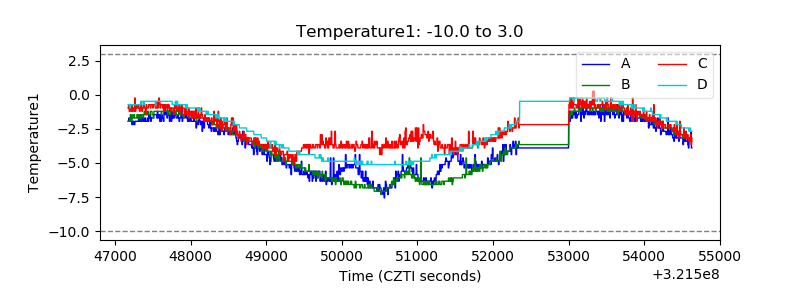 |
| Veto HV Monitor | 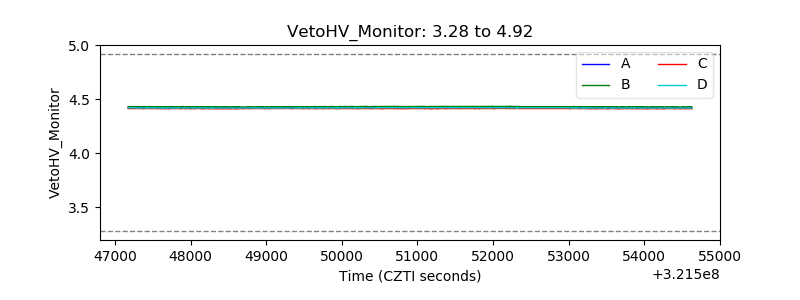 |
| Veto LLD | 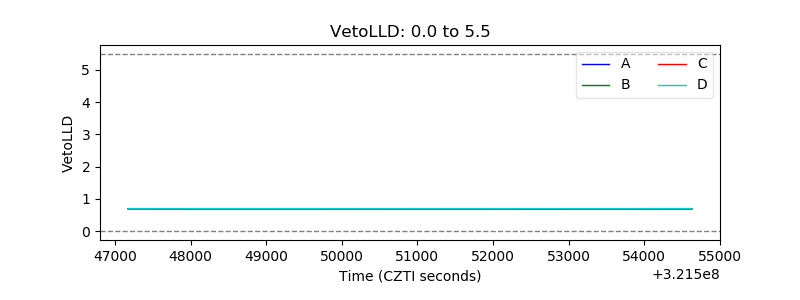 |
| Alpha Counter | 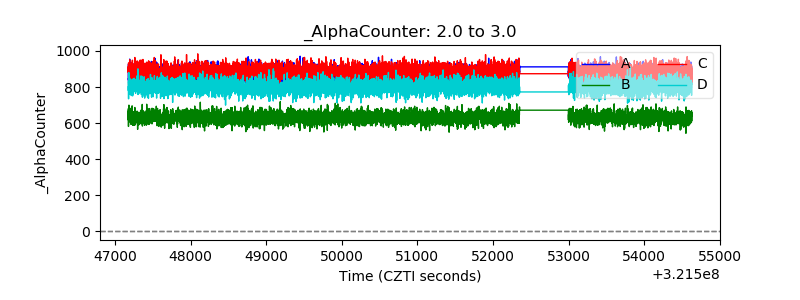 |
| _CPM_Rate | 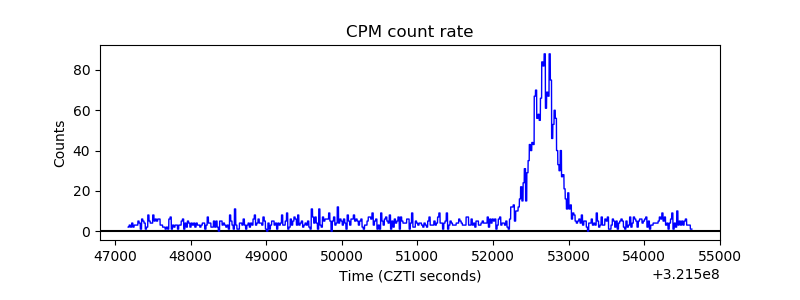 |
| CZT Counter | 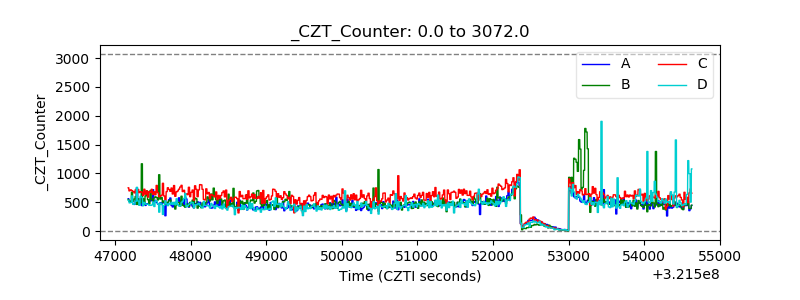 |
| +2.5 Volts monitor |  |
| +5 Volts monitor |  |
| _ROLL_ROT |  |
| _Roll_DEC | 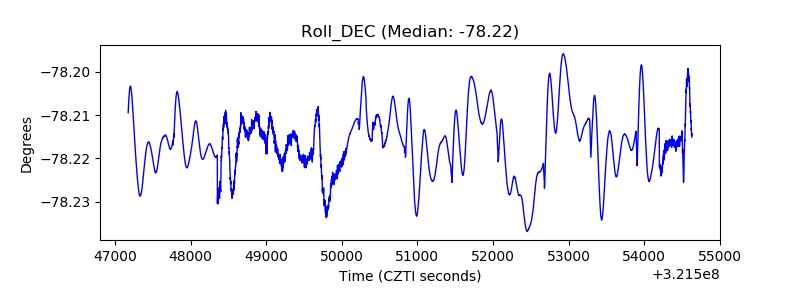 |
| _Roll_RA | 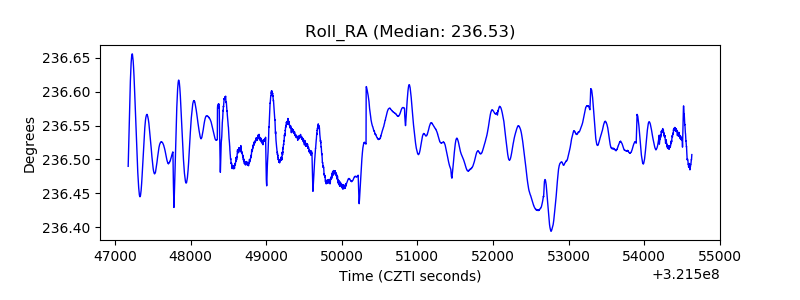 |
| Veto Counter | 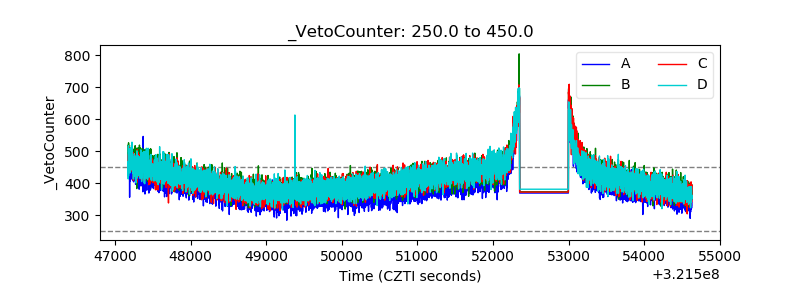 |