| Param | Original file | Final file |
|---|---|---|
| Filename | modeM0/AS1A07_165T01_9000003558_24061cztM0_level2.evt | modeM0/AS1A07_165T01_9000003558_24061cztM0_level2_quad_clean.evt |
| Size (bytes) | 500,739,840 | 136,779,840 |
| Size | 477.5 MB | 130.4 MB |
| Events in quadrant A | 3,332,017 | 926,171 |
| Events in quadrant B | 3,466,490 | 935,347 |
| Events in quadrant C | 4,136,254 | 897,305 |
| Events in quadrant D | 3,745,670 | 887,270 |
| Mode M9 | |||
|---|---|---|---|
| Quadrant | BADHDUFLAG | Total packets | Discarded packets |
| A | 0 | 3 | 0 |
| B | 0 | 3 | 0 |
| C | 0 | 3 | 0 |
| D | 0 | 3 | 0 |
| Mode M0 | |||
|---|---|---|---|
| Quadrant | BADHDUFLAG | Total packets | Discarded packets |
| A | 0 | 14625 | 1 |
| B | 0 | 14972 | 2 |
| C | 0 | 17013 | 1 |
| D | 0 | 15783 | 1 |
| Mode SS | |||
|---|---|---|---|
| Quadrant | BADHDUFLAG | Total packets | Discarded packets |
| A | 0 | 146 | 0 |
| B | 0 | 144 | 0 |
| C | 0 | 144 | 0 |
| D | 0 | 144 | 0 |
| Quadrant | Total seconds | Saturated seconds | Saturation percentage |
|---|---|---|---|
| A | 7135 | 70 | 0.981079% |
| B | 7135 | 113 | 1.583742% |
| C | 7135 | 108 | 1.513665% |
| D | 7135 | 64 | 0.896987% |
Noise dominated data is calculated using 1-second bins in cleaned event files. If a bin has >2000 counts, and if more than 50% of those come from <1% of pixels, then it is considered to be noise-dominated and hence unusable.
| Quadrant | # 1 sec bins | Bins with >0 counts | Bins with >2000 counts | High rate bins dominated by noise | Noise dominated (total time) | Noise dominated (detector-on time) | Marked lightcurve |
|---|---|---|---|---|---|---|---|
| A | 7480 | 7136 | 0 | 0 | 0.00% | 0.00% | 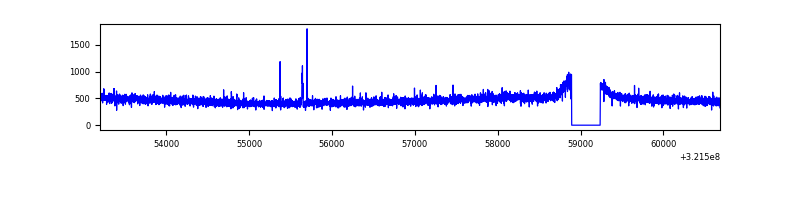 |
| B | 7480 | 7136 | 6 | 6 | 0.08% | 0.08% | 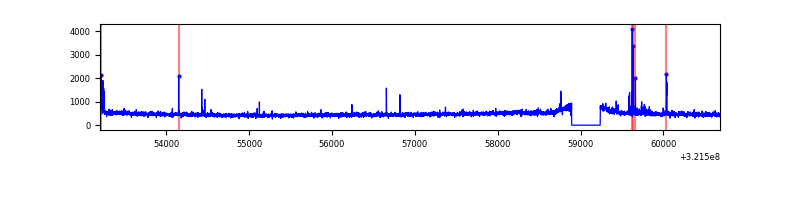 |
| C | 7480 | 7136 | 0 | 0 | 0.00% | 0.00% | 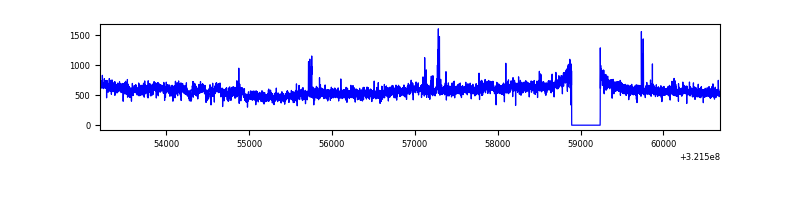 |
| D | 7480 | 7136 | 32 | 32 | 0.43% | 0.45% | 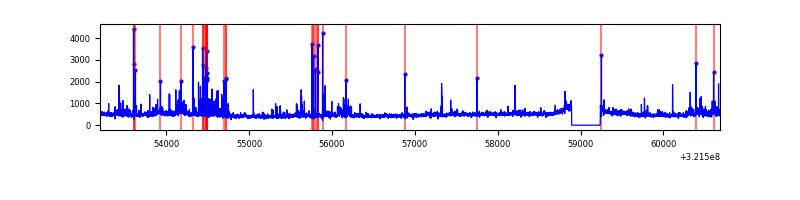 |
Top three noisy pixels from each quadrant. If the there are fewer than three noisy pixels in the level2.evt file, extra rows are filled as -1
| Pixel properties | Quadrant properties | ||||||
|---|---|---|---|---|---|---|---|
| Quadrant | DetID | PixID | Counts | Sigma | Mean | Median | Sigma |
| A | 6 | 16 | 15331 | 84.49 | 858 | 838 | 171.5 |
| A | 13 | 254 | 11412 | 61.65 | 858 | 838 | 171.5 |
| A | 0 | 226 | 7522 | 38.97 | 858 | 838 | 171.5 |
| B | 0 | 189 | 52944 | 325.31 | 850 | 830 | 160.2 |
| B | 12 | 111 | 18831 | 112.37 | 850 | 830 | 160.2 |
| B | 0 | 245 | 18119 | 107.92 | 850 | 830 | 160.2 |
| C | 7 | 247 | 769610 | 4082.24 | 815 | 819 | 188.3 |
| C | 14 | 238 | 130155 | 686.77 | 815 | 819 | 188.3 |
| C | 2 | 16 | 28789 | 148.52 | 815 | 819 | 188.3 |
| D | 1 | 52 | 214469 | 1057.95 | 833 | 807 | 202.0 |
| D | 8 | 195 | 187773 | 925.76 | 833 | 807 | 202.0 |
| D | 12 | 217 | 87200 | 427.78 | 833 | 807 | 202.0 |
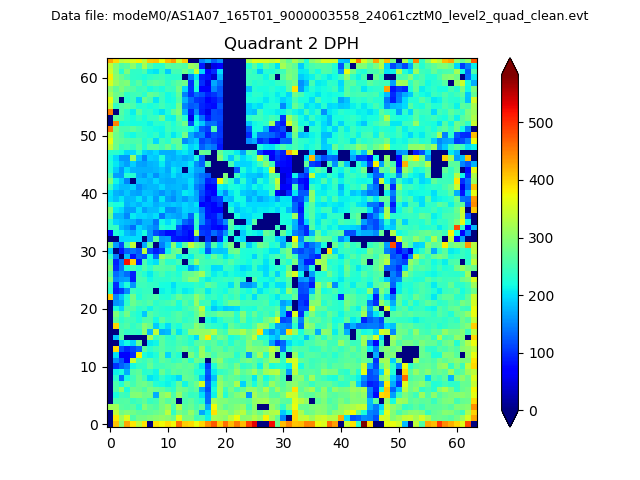
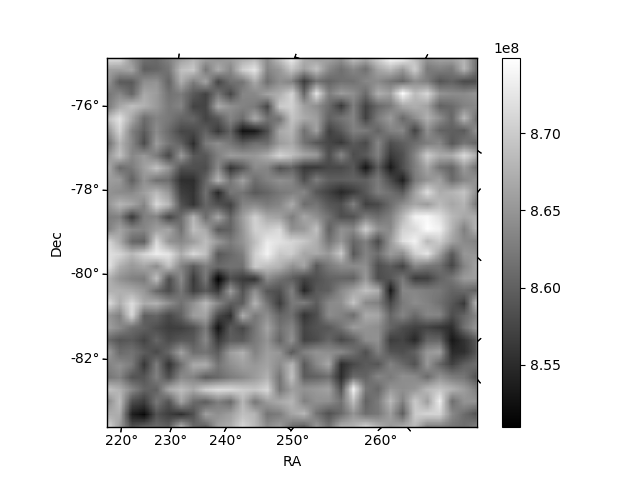
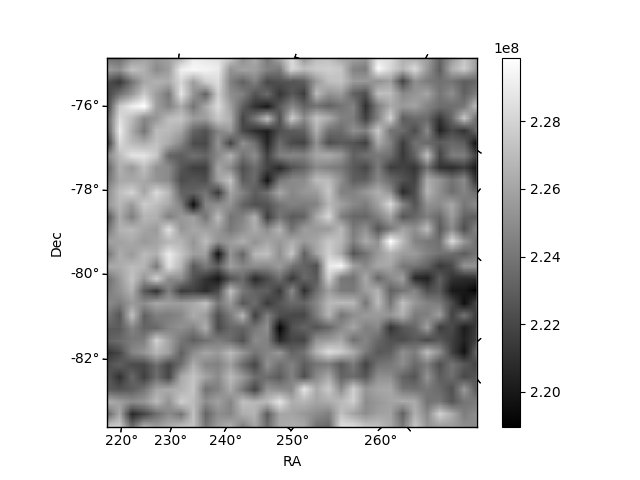
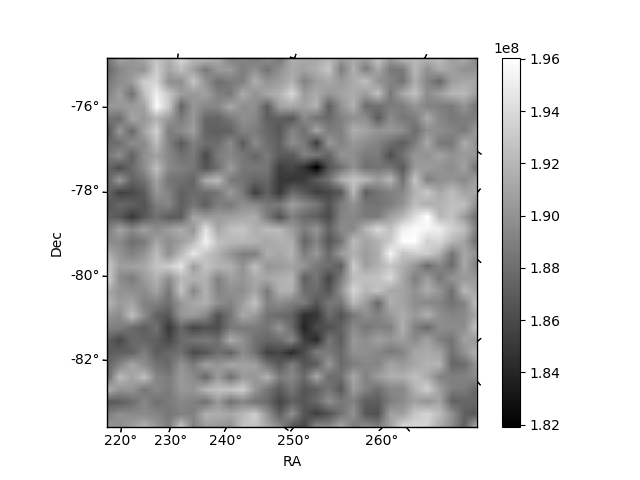
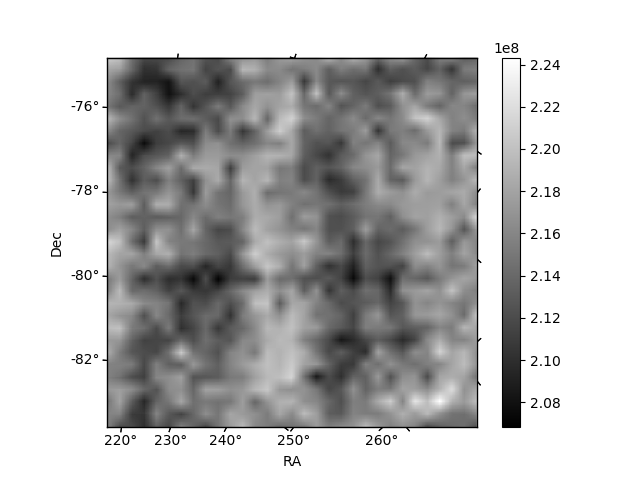
Histogram calculated using DETX and DETY for each event in the final _common_clean file
| Quadrant A | 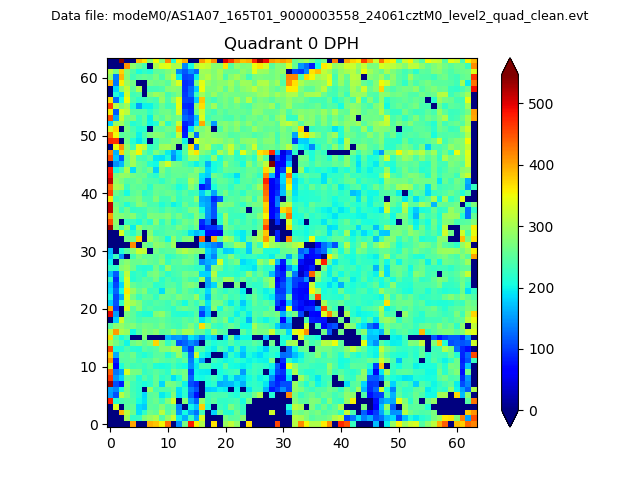 |
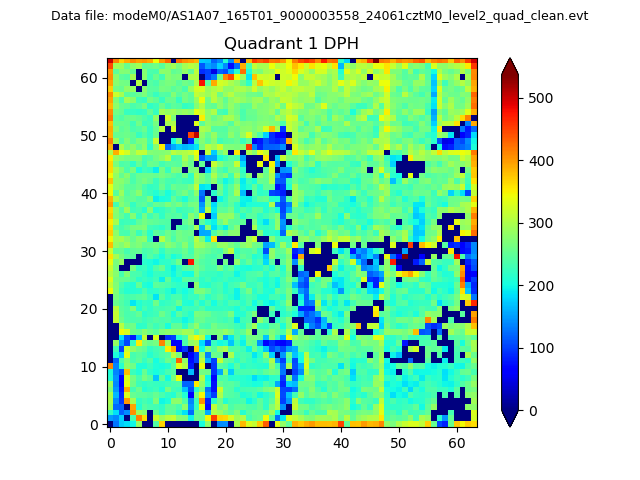 |
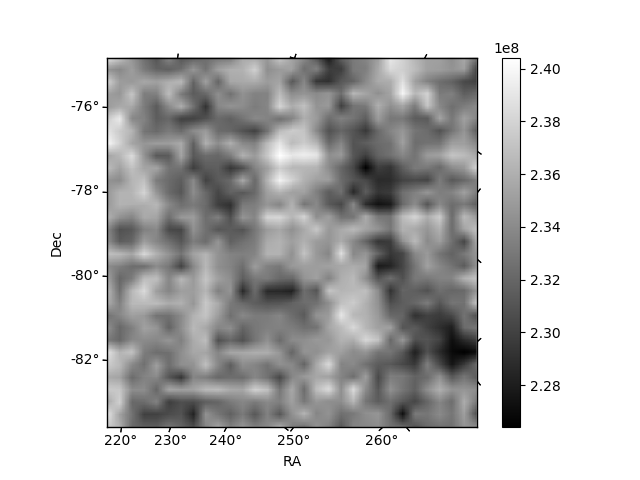
Quadrant B |
|---|---|---|---|
| Quadrant D | 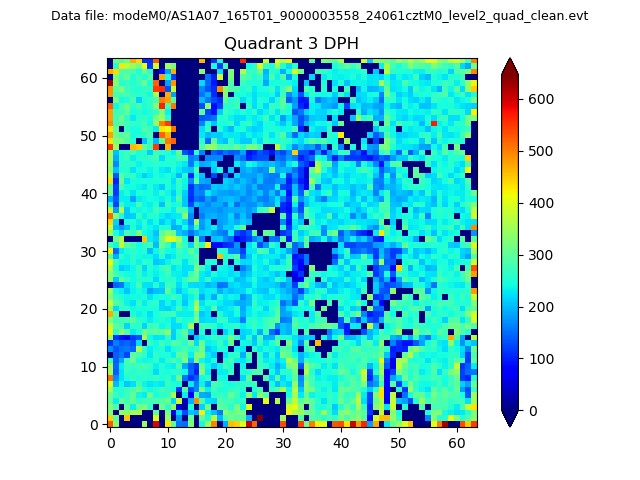 |
 |
Quadrant C |
| Plot type | Count rate plots | Images |
|---|---|---|
| Comparison with Poisson distribution Blue bars denote a histogram of data divided into 1 sec bins. Red curve is a Poisson curve with rate = median count rate of data. |
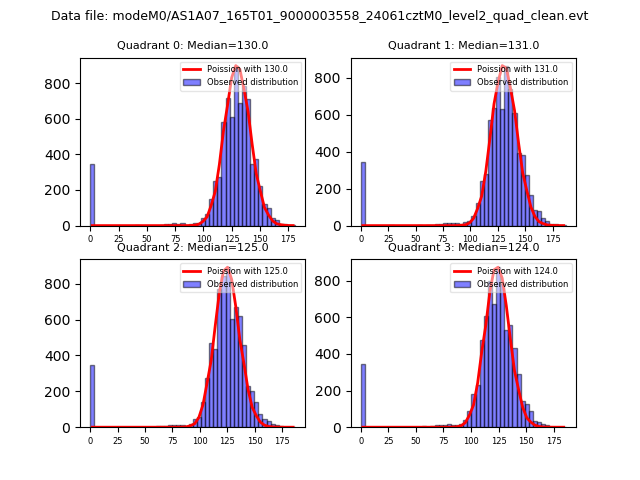 |
 |
| Quadrant-wise count rates Data is divided into 100 sec bins |
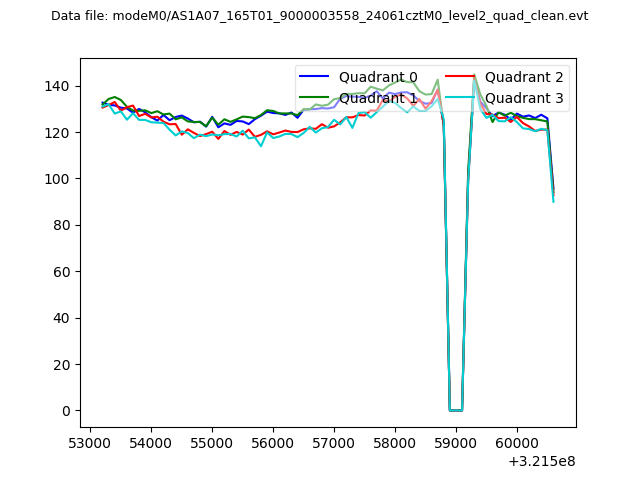 |
|
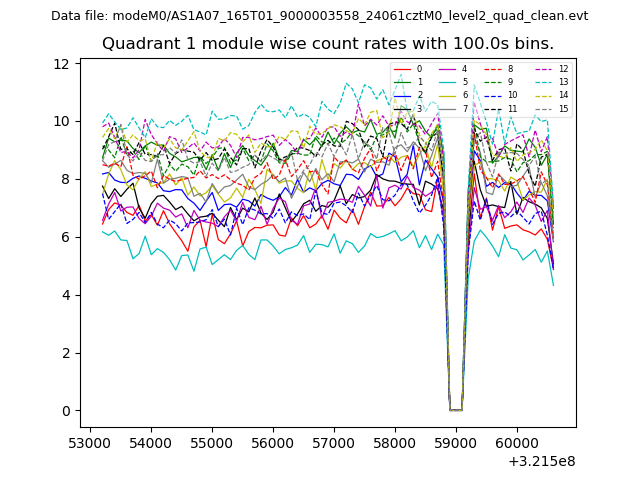
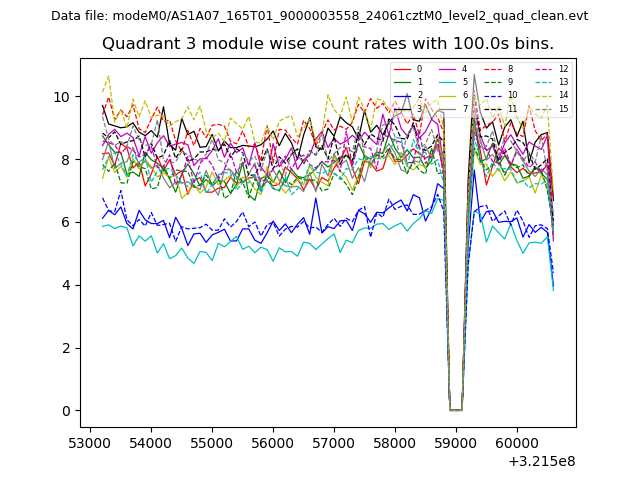
| Module-wise count rates for Quadrant A Data is divided into 100 sec bins |
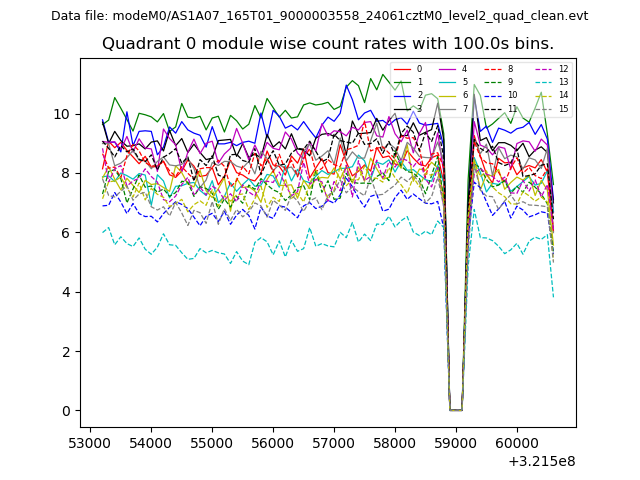 |
 |
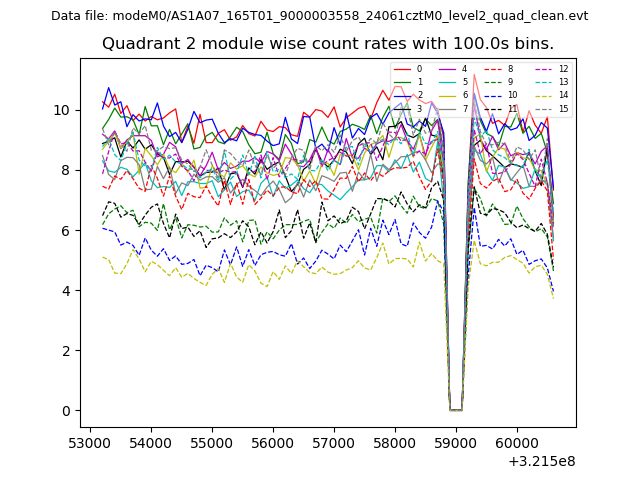
| Module-wise count rates for Quadrant B Data is divided into 100 sec bins |
 |
 |
| Module-wise count rates for Quadrant C Data is divided into 100 sec bins |
 |
 |
| Module-wise count rates for Quadrant D Data is divided into 100 sec bins |
 |
 |
| Parameter | Plot |
|---|---|
| CZT HV Monitor | 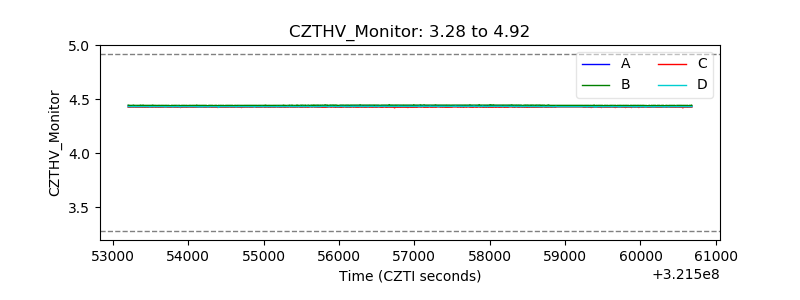 |
| D_VDD | 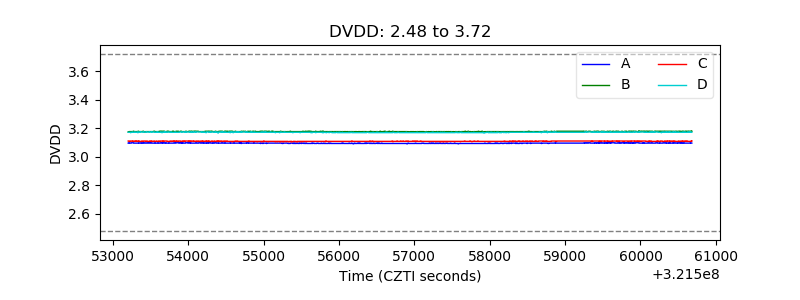 |
| Temperature 1 | 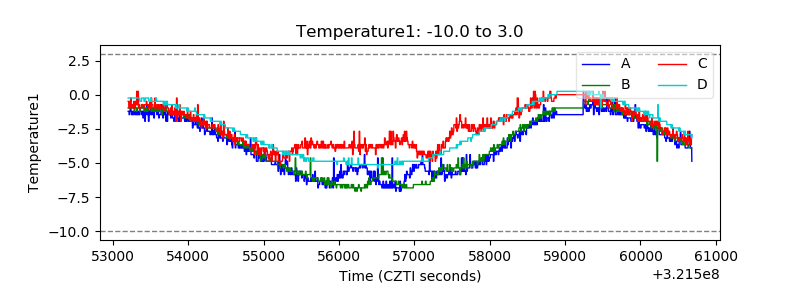 |
| Veto HV Monitor | 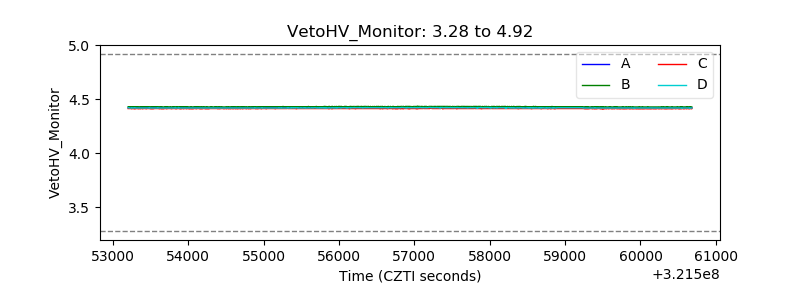 |
| Veto LLD | 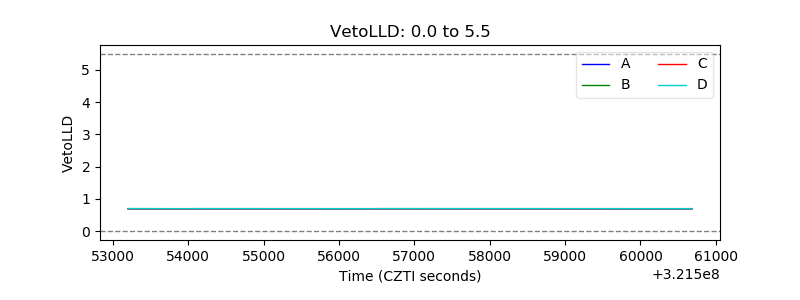 |
| Alpha Counter | 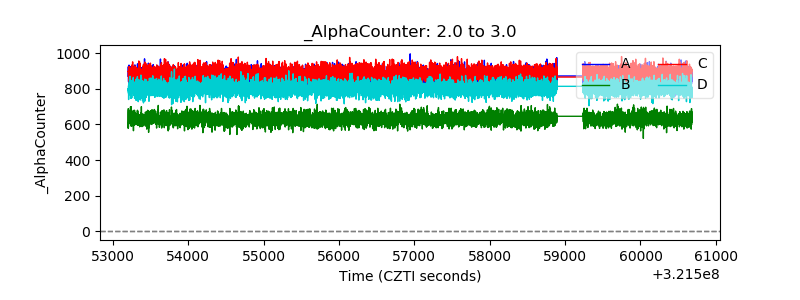 |
| _CPM_Rate | 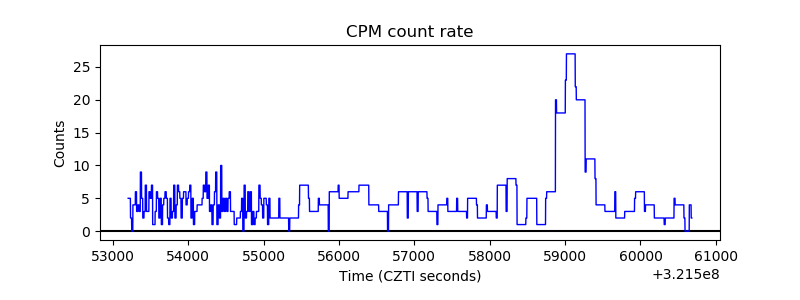 |
| CZT Counter | 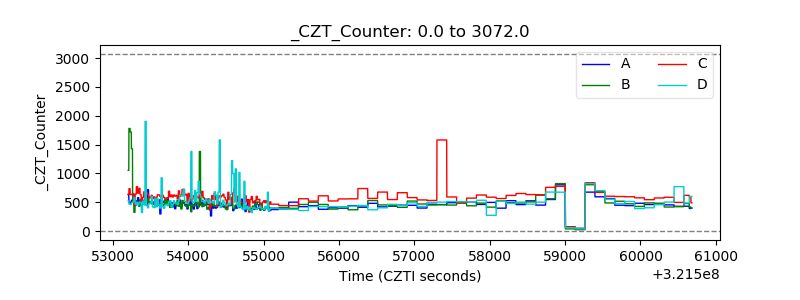 |
| +2.5 Volts monitor |  |
| +5 Volts monitor |  |
| _ROLL_ROT |  |
| _Roll_DEC | 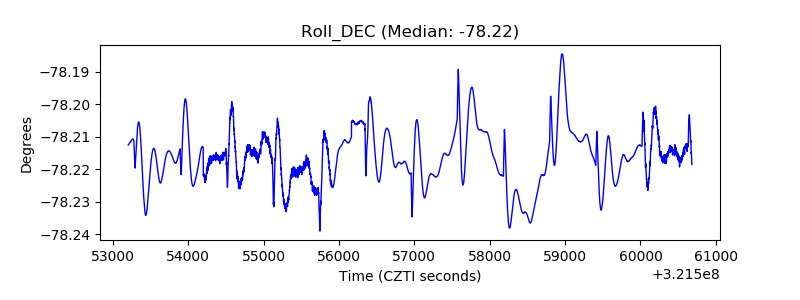 |
| _Roll_RA | 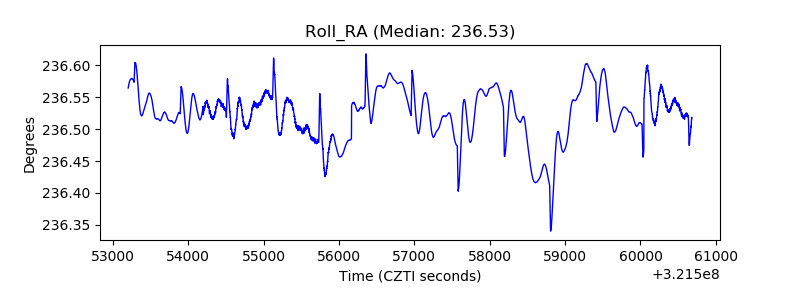 |
| Veto Counter | 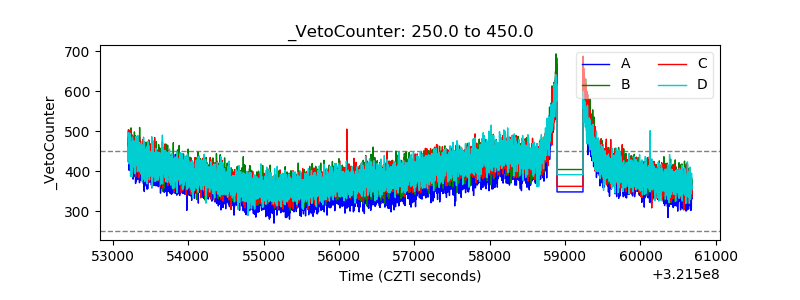 |