| Param | Original file | Final file |
|---|---|---|
| Filename | modeM0/AS1A07_165T01_9000003558_24062cztM0_level2.evt | modeM0/AS1A07_165T01_9000003558_24062cztM0_level2_quad_clean.evt |
| Size (bytes) | 523,586,880 | 143,565,120 |
| Size | 499.3 MB | 136.9 MB |
| Events in quadrant A | 3,504,980 | 970,288 |
| Events in quadrant B | 3,793,458 | 981,650 |
| Events in quadrant C | 4,215,657 | 936,816 |
| Events in quadrant D | 3,829,133 | 933,373 |
| Mode M9 | |||
|---|---|---|---|
| Quadrant | BADHDUFLAG | Total packets | Discarded packets |
| A | 0 | 3 | 0 |
| B | 0 | 4 | 0 |
| C | 0 | 4 | 0 |
| D | 0 | 4 | 0 |
| Mode M0 | |||
|---|---|---|---|
| Quadrant | BADHDUFLAG | Total packets | Discarded packets |
| A | 0 | 15487 | 2 |
| B | 0 | 16264 | 2 |
| C | 0 | 17265 | 2 |
| D | 0 | 16601 | 3 |
| Mode SS | |||
|---|---|---|---|
| Quadrant | BADHDUFLAG | Total packets | Discarded packets |
| A | 0 | 154 | 0 |
| B | 0 | 154 | 0 |
| C | 0 | 154 | 0 |
| D | 0 | 154 | 0 |
| Quadrant | Total seconds | Saturated seconds | Saturation percentage |
|---|---|---|---|
| A | 7565 | 50 | 0.660939% |
| B | 7565 | 114 | 1.506940% |
| C | 7565 | 90 | 1.189689% |
| D | 7564 | 39 | 0.515600% |
Noise dominated data is calculated using 1-second bins in cleaned event files. If a bin has >2000 counts, and if more than 50% of those come from <1% of pixels, then it is considered to be noise-dominated and hence unusable.
| Quadrant | # 1 sec bins | Bins with >0 counts | Bins with >2000 counts | High rate bins dominated by noise | Noise dominated (total time) | Noise dominated (detector-on time) | Marked lightcurve |
|---|---|---|---|---|---|---|---|
| A | 7915 | 7566 | 0 | 0 | 0.00% | 0.00% | 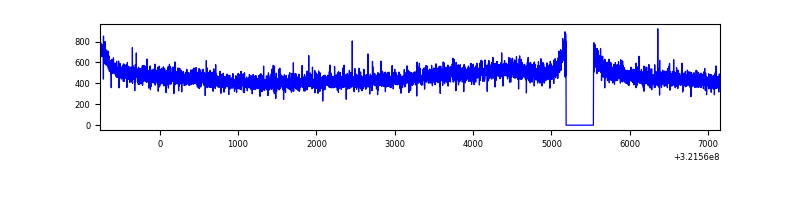 |
| B | 7915 | 7566 | 11 | 11 | 0.14% | 0.15% | 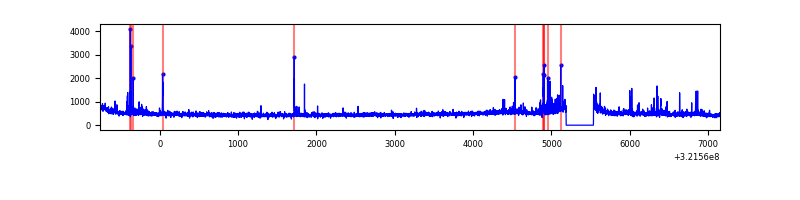 |
| C | 7915 | 7566 | 2 | 2 | 0.03% | 0.03% | 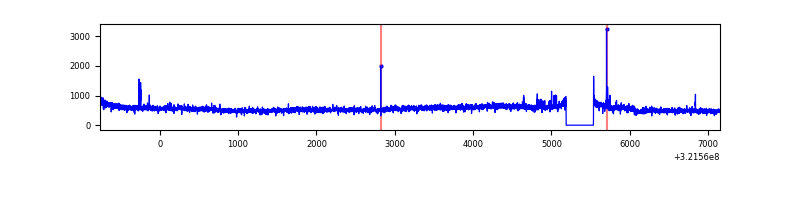 |
| D | 7914 | 7565 | 26 | 26 | 0.33% | 0.34% | 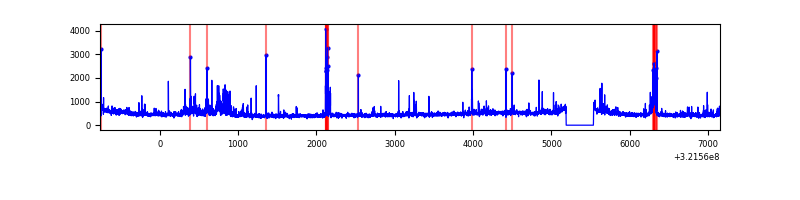 |
Top three noisy pixels from each quadrant. If the there are fewer than three noisy pixels in the level2.evt file, extra rows are filled as -1
| Pixel properties | Quadrant properties | ||||||
|---|---|---|---|---|---|---|---|
| Quadrant | DetID | PixID | Counts | Sigma | Mean | Median | Sigma |
| A | 13 | 254 | 12667 | 64.6 | 905 | 884 | 182.4 |
| A | 2 | 250 | 11027 | 55.61 | 905 | 884 | 182.4 |
| A | 0 | 226 | 7751 | 37.65 | 905 | 884 | 182.4 |
| B | 0 | 189 | 96400 | 563.17 | 897 | 875 | 169.6 |
| B | 0 | 245 | 33776 | 193.97 | 897 | 875 | 169.6 |
| B | 5 | 172 | 31989 | 183.43 | 897 | 875 | 169.6 |
| C | 7 | 247 | 696567 | 3483.84 | 857 | 861 | 199.7 |
| C | 14 | 238 | 137257 | 683.02 | 857 | 861 | 199.7 |
| C | 0 | 239 | 25727 | 124.52 | 857 | 861 | 199.7 |
| D | 8 | 195 | 228018 | 1071.36 | 873 | 845 | 212.0 |
| D | 7 | 238 | 67454 | 314.13 | 873 | 845 | 212.0 |
| D | 1 | 52 | 62530 | 290.91 | 873 | 845 | 212.0 |
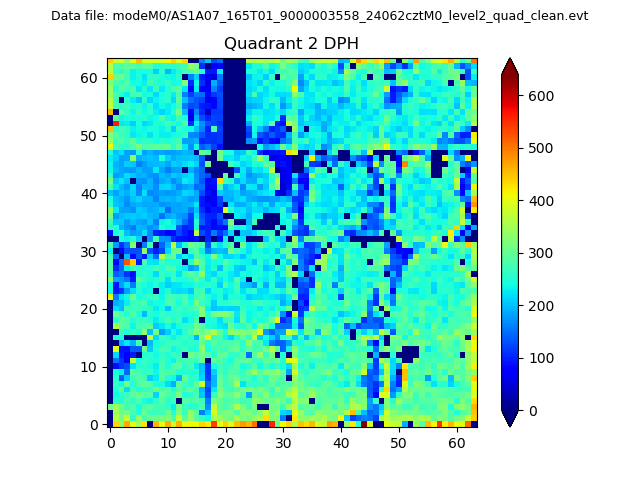
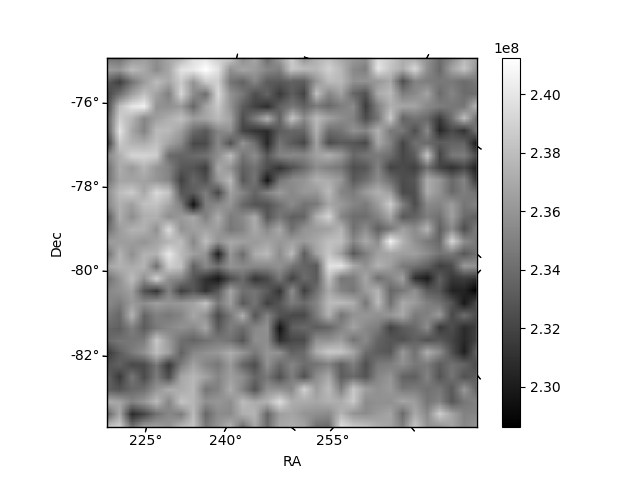
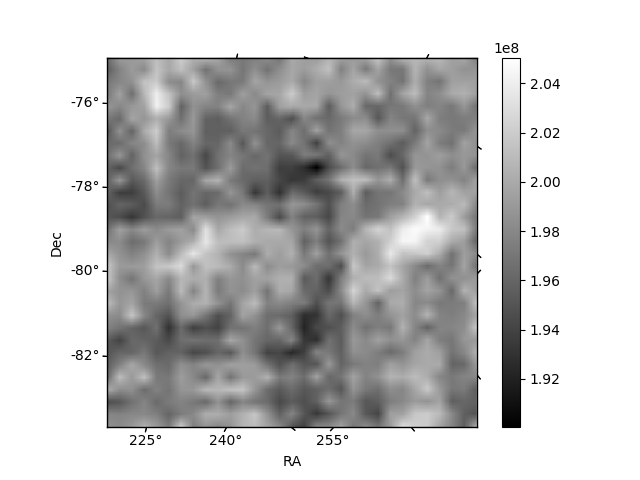
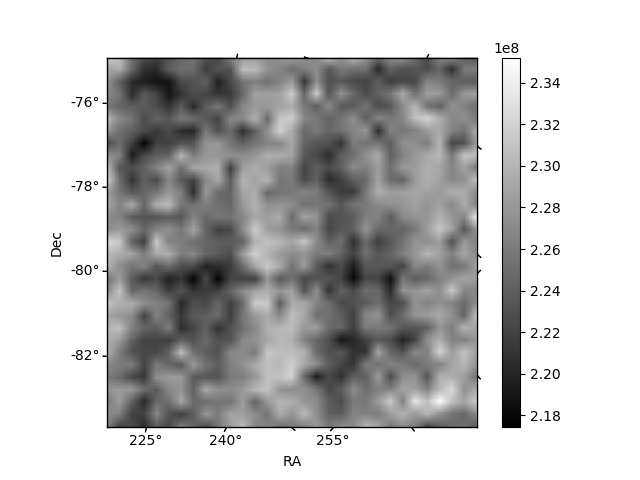
Histogram calculated using DETX and DETY for each event in the final _common_clean file
| Quadrant A | 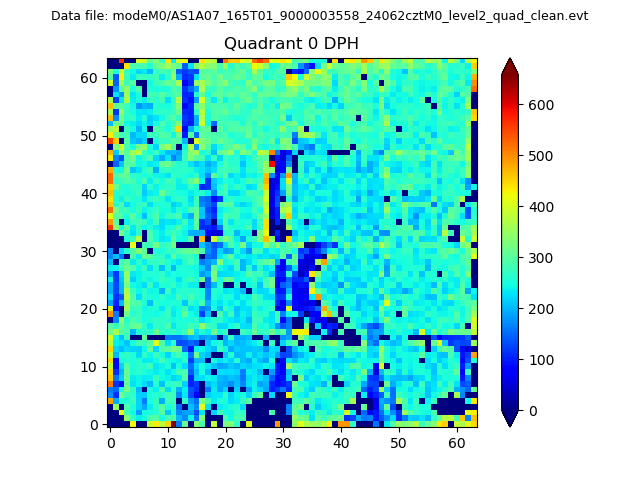 |
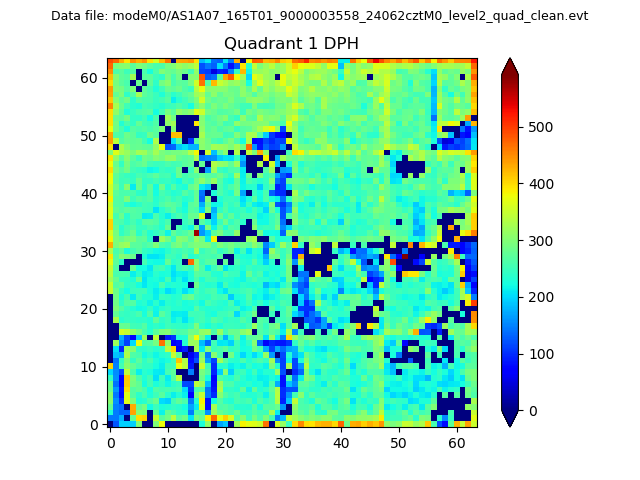 |
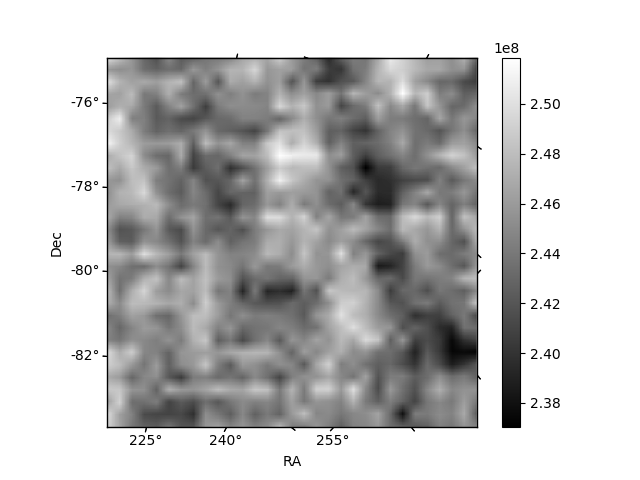
Quadrant B |
|---|---|---|---|
| Quadrant D | 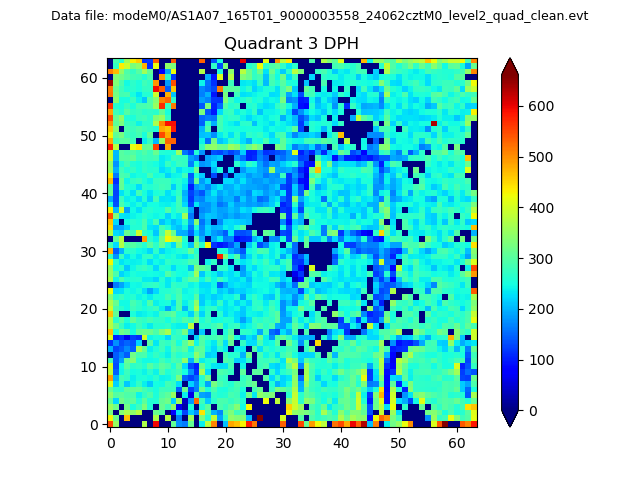 |
 |
Quadrant C |
| Plot type | Count rate plots | Images |
|---|---|---|
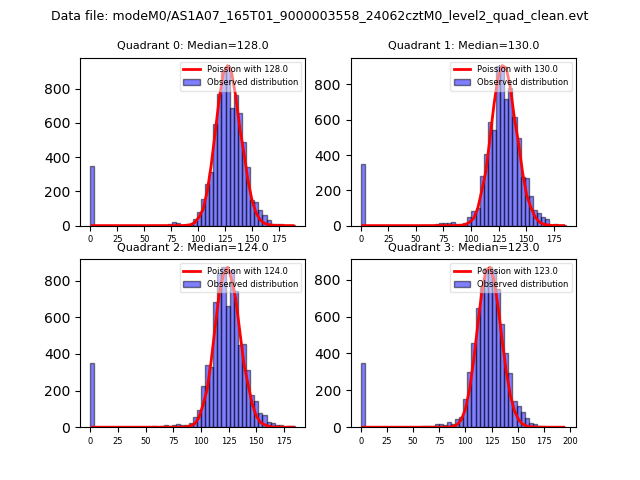
| Comparison with Poisson distribution Blue bars denote a histogram of data divided into 1 sec bins. Red curve is a Poisson curve with rate = median count rate of data. |
 |
 |
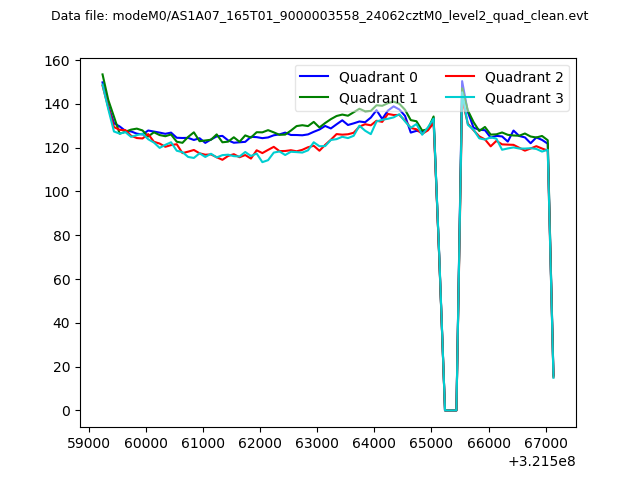
| Quadrant-wise count rates Data is divided into 100 sec bins |
 |
|
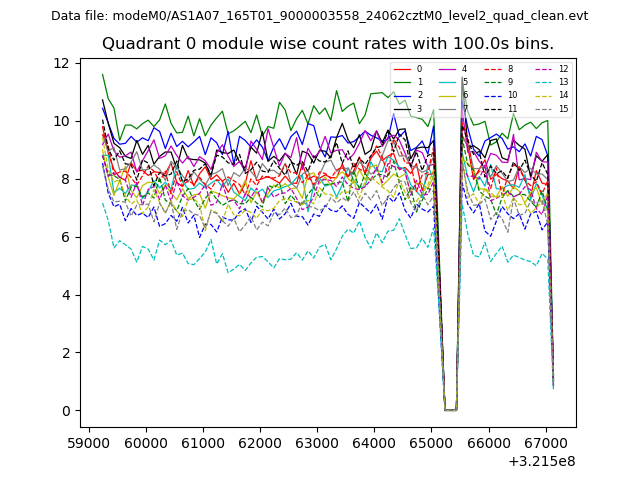
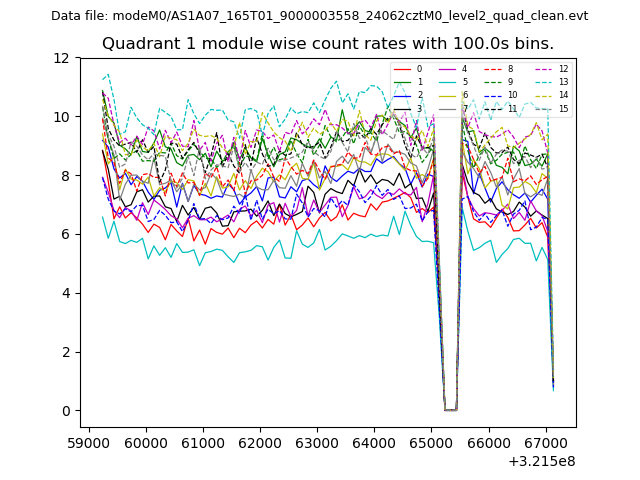
| Module-wise count rates for Quadrant A Data is divided into 100 sec bins |
 |
 |
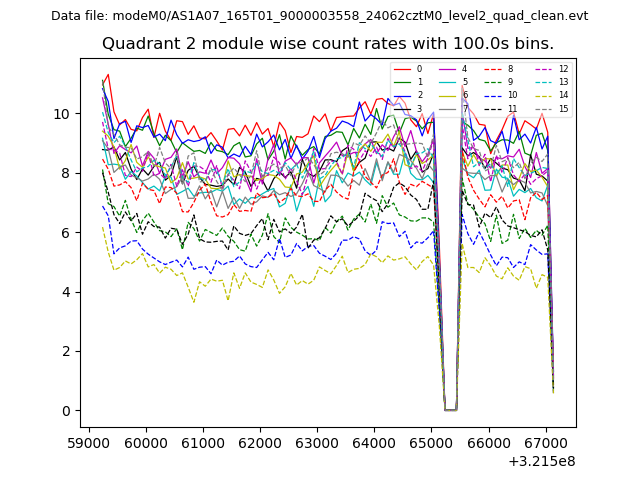
| Module-wise count rates for Quadrant B Data is divided into 100 sec bins |
 |
 |
| Module-wise count rates for Quadrant C Data is divided into 100 sec bins |
 |
 |
| Module-wise count rates for Quadrant D Data is divided into 100 sec bins |
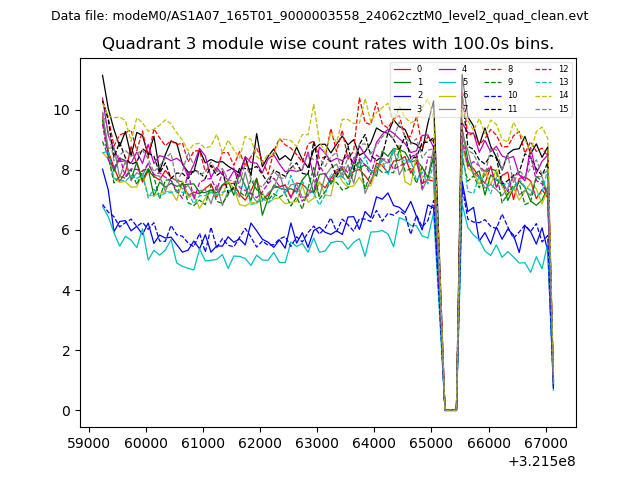 |
 |
| Parameter | Plot |
|---|---|
| CZT HV Monitor | 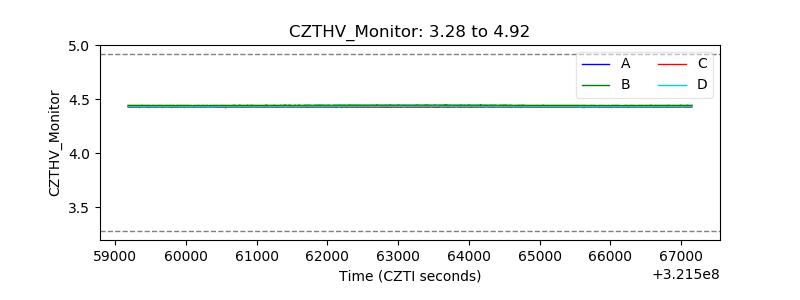 |
| D_VDD | 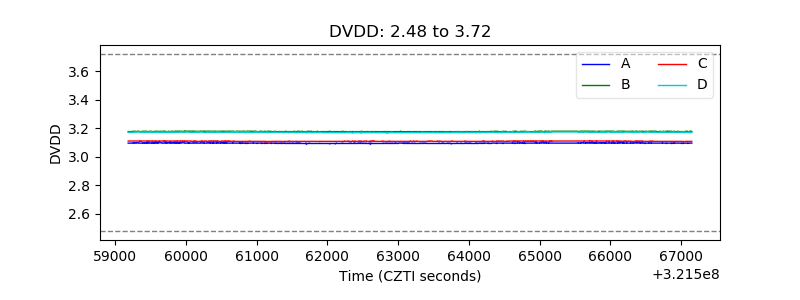 |
| Temperature 1 |  |
| Veto HV Monitor | 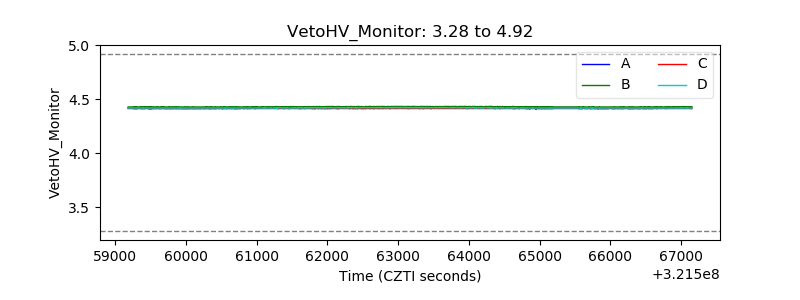 |
| Veto LLD | 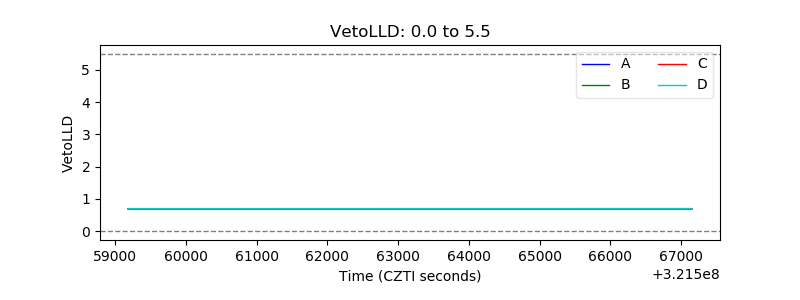 |
| Alpha Counter | 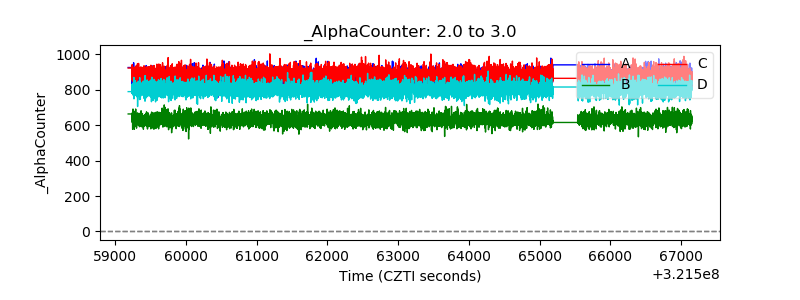 |
| _CPM_Rate | 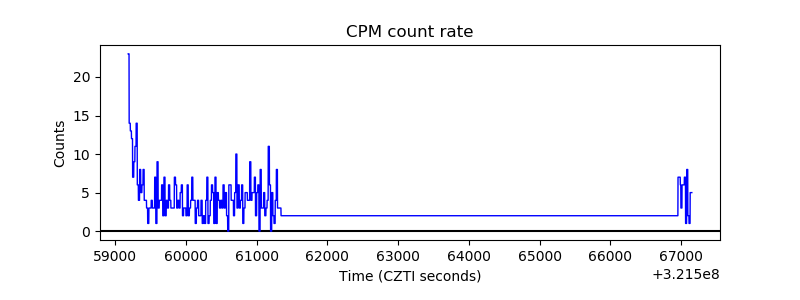 |
| CZT Counter | 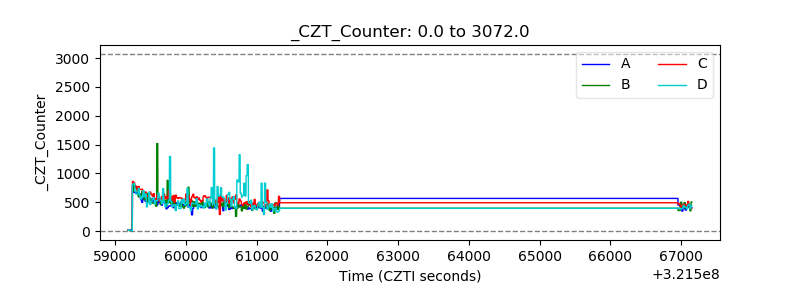 |
| +2.5 Volts monitor |  |
| +5 Volts monitor | 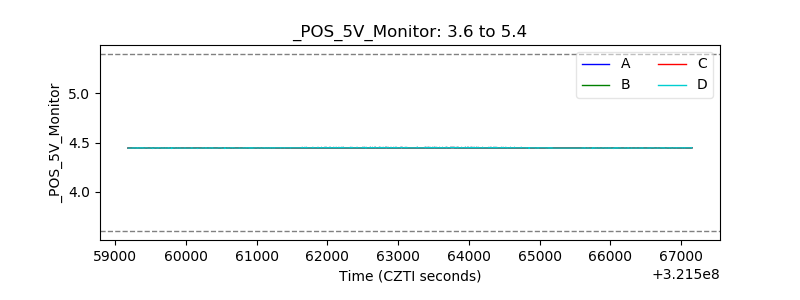 |
| _ROLL_ROT |  |
| _Roll_DEC |  |
| _Roll_RA | 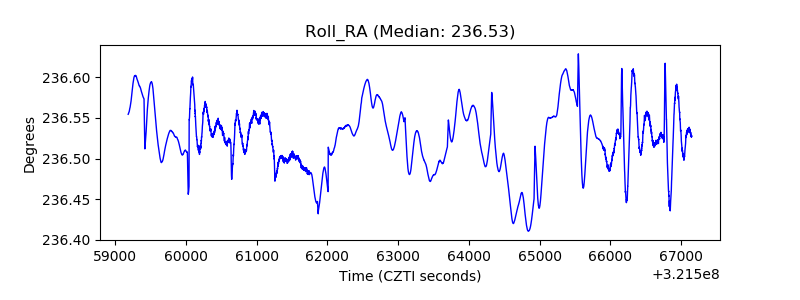 |
| Veto Counter | 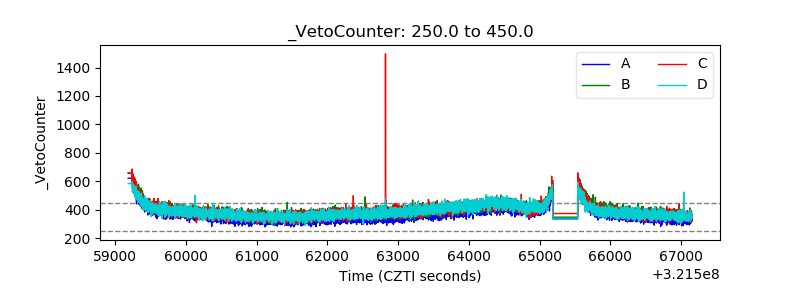 |