| Param | Original file | Final file |
|---|---|---|
| Filename | modeM0/AS1A07_165T01_9000003558_24065cztM0_level2.evt | modeM0/AS1A07_165T01_9000003558_24065cztM0_level2_quad_clean.evt |
| Size (bytes) | 1,219,147,200 | 321,935,040 |
| Size | 1.1 GB | 307.0 MB |
| Events in quadrant A | 7,914,251 | 2,175,698 |
| Events in quadrant B | 8,540,383 | 2,218,094 |
| Events in quadrant C | 8,955,377 | 2,113,252 |
| Events in quadrant D | 10,348,121 | 2,057,936 |
| Mode M9 | |||
|---|---|---|---|
| Quadrant | BADHDUFLAG | Total packets | Discarded packets |
| A | 0 | 14 | 0 |
| B | 0 | 14 | 0 |
| C | 0 | 14 | 0 |
| D | 0 | 14 | 0 |
| Mode M0 | |||
|---|---|---|---|
| Quadrant | BADHDUFLAG | Total packets | Discarded packets |
| A | 0 | 35090 | 5 |
| B | 0 | 36312 | 3 |
| C | 0 | 36744 | 3 |
| D | 0 | 42408 | 3 |
| Mode SS | |||
|---|---|---|---|
| Quadrant | BADHDUFLAG | Total packets | Discarded packets |
| A | 0 | 350 | 0 |
| B | 0 | 350 | 0 |
| C | 0 | 350 | 0 |
| D | 0 | 350 | 0 |
| Quadrant | Total seconds | Saturated seconds | Saturation percentage |
|---|---|---|---|
| A | 17217 | 105 | 0.609862% |
| B | 17217 | 155 | 0.900273% |
| C | 17217 | 205 | 1.190684% |
| D | 17217 | 548 | 3.182901% |
Noise dominated data is calculated using 1-second bins in cleaned event files. If a bin has >2000 counts, and if more than 50% of those come from <1% of pixels, then it is considered to be noise-dominated and hence unusable.
| Quadrant | # 1 sec bins | Bins with >0 counts | Bins with >2000 counts | High rate bins dominated by noise | Noise dominated (total time) | Noise dominated (detector-on time) | Marked lightcurve |
|---|---|---|---|---|---|---|---|
| A | 18667 | 17220 | 0 | 0 | 0.00% | 0.00% | 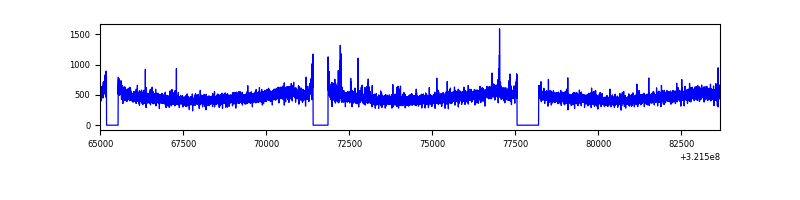 |
| B | 18667 | 17220 | 5 | 5 | 0.03% | 0.03% | 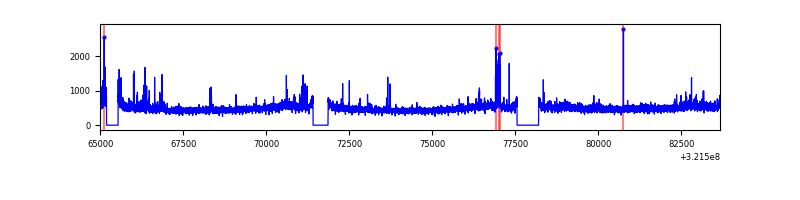 |
| C | 18667 | 17220 | 7 | 7 | 0.04% | 0.04% | 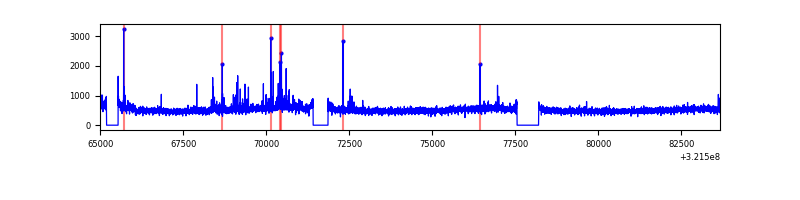 |
| D | 18667 | 17220 | 451 | 451 | 2.42% | 2.62% | 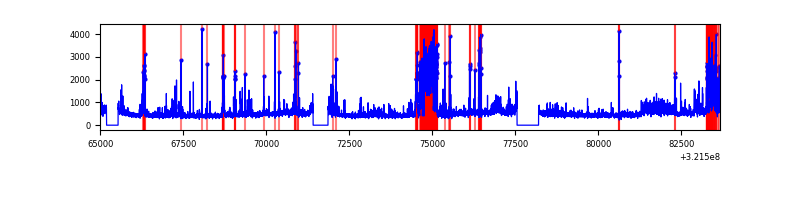 |
Top three noisy pixels from each quadrant. If the there are fewer than three noisy pixels in the level2.evt file, extra rows are filled as -1
| Pixel properties | Quadrant properties | ||||||
|---|---|---|---|---|---|---|---|
| Quadrant | DetID | PixID | Counts | Sigma | Mean | Median | Sigma |
| A | 3 | 1 | 32138 | 73.65 | 2037 | 1992 | 409.3 |
| A | 13 | 254 | 25566 | 57.59 | 2037 | 1992 | 409.3 |
| A | 2 | 79 | 24293 | 54.48 | 2037 | 1992 | 409.3 |
| B | 0 | 197 | 275166 | 716.28 | 2034 | 1981 | 381.4 |
| B | 0 | 189 | 67535 | 171.88 | 2034 | 1981 | 381.4 |
| B | 15 | 33 | 57239 | 144.88 | 2034 | 1981 | 381.4 |
| C | 7 | 247 | 863900 | 1901.66 | 1953 | 1964 | 453.3 |
| C | 14 | 238 | 310297 | 680.26 | 1953 | 1964 | 453.3 |
| C | 0 | 239 | 158132 | 344.55 | 1953 | 1964 | 453.3 |
| D | 7 | 238 | 1108809 | 2344.04 | 1967 | 1907 | 472.2 |
| D | 8 | 195 | 777852 | 1643.18 | 1967 | 1907 | 472.2 |
| D | 1 | 52 | 620421 | 1309.8 | 1967 | 1907 | 472.2 |
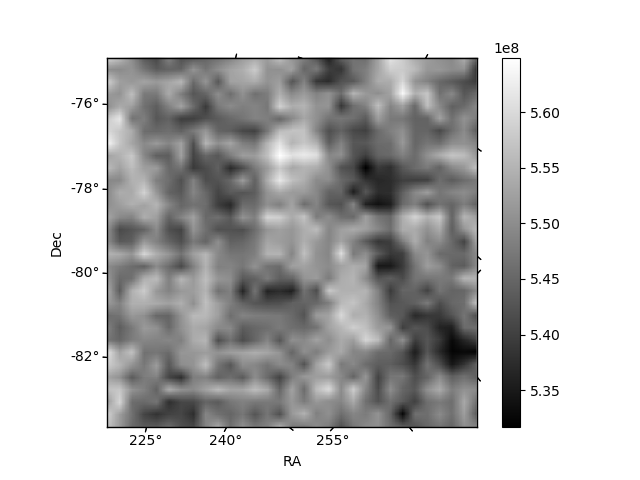
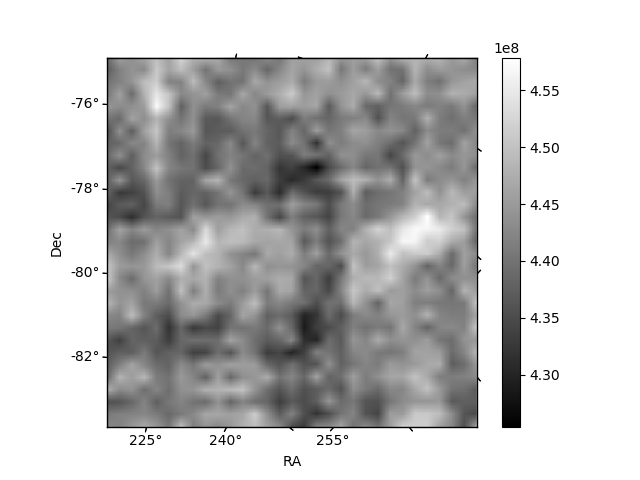
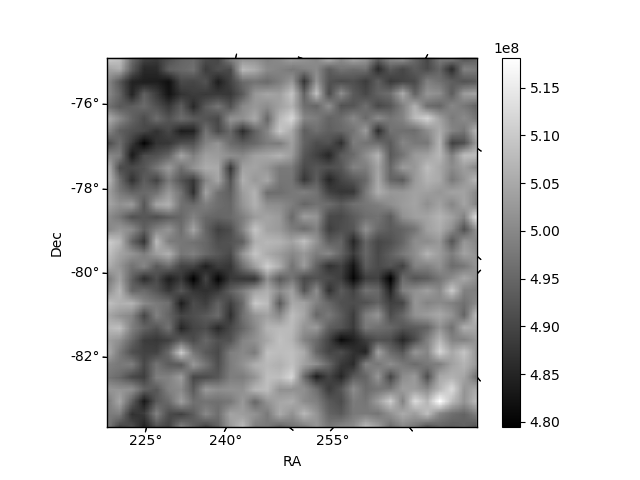
Histogram calculated using DETX and DETY for each event in the final _common_clean file
| Quadrant A | 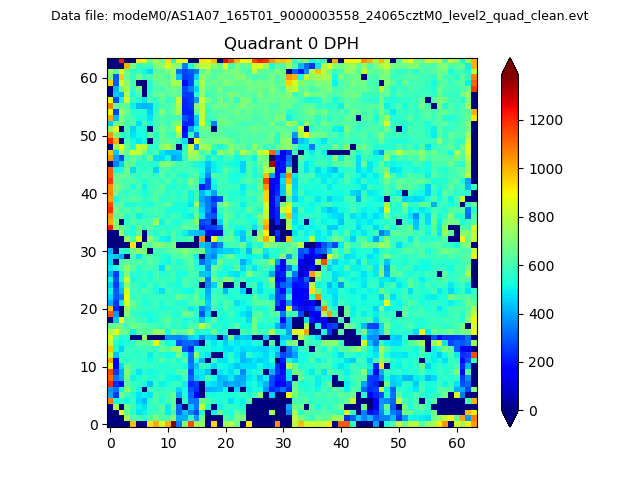 |
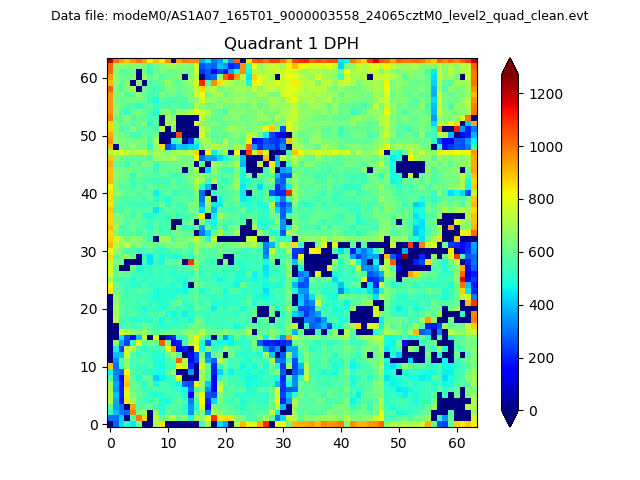 |
Quadrant B |
|---|---|---|---|
| Quadrant D | 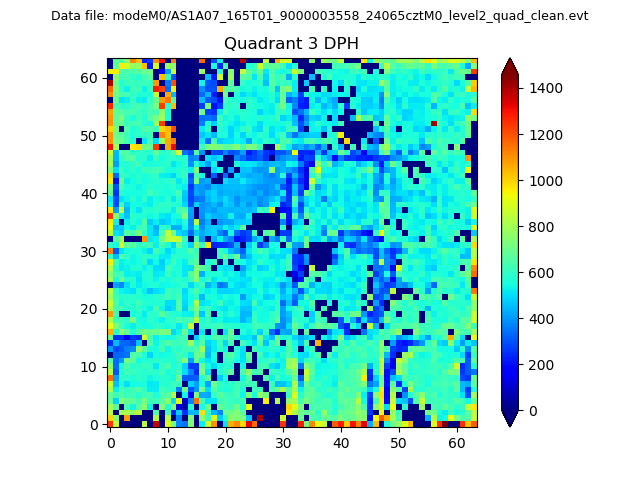 |
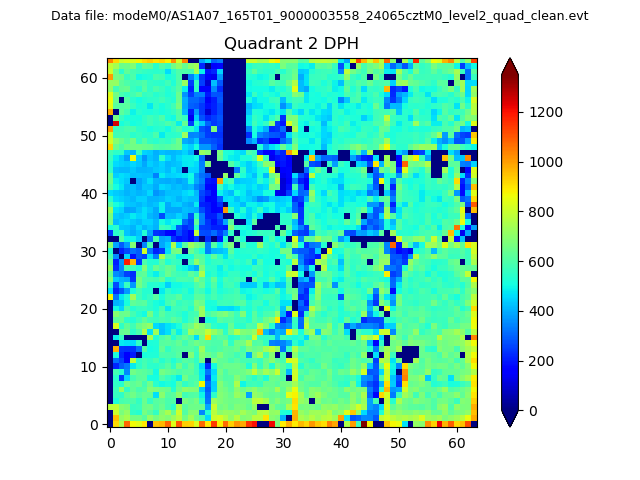 |
Quadrant C |
| Plot type | Count rate plots | Images |
|---|---|---|
| Comparison with Poisson distribution Blue bars denote a histogram of data divided into 1 sec bins. Red curve is a Poisson curve with rate = median count rate of data. |
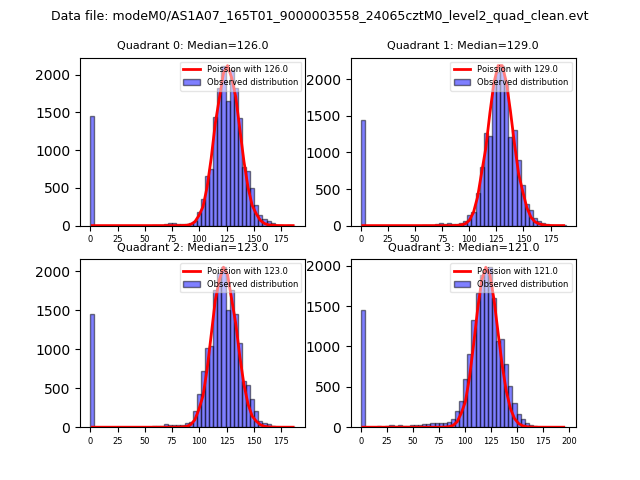 |
 |
| Quadrant-wise count rates Data is divided into 100 sec bins |
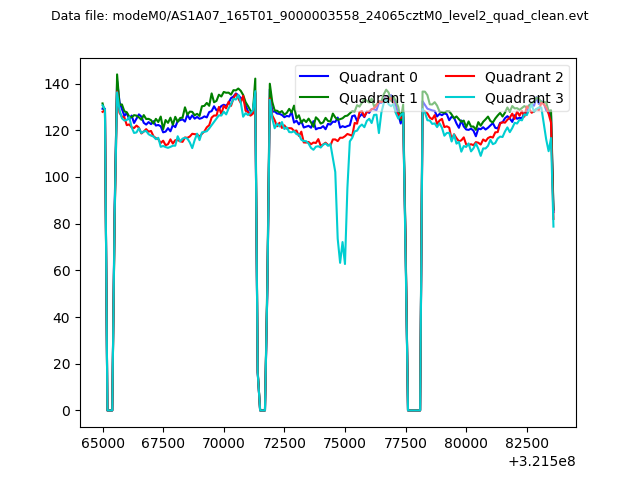 |
|
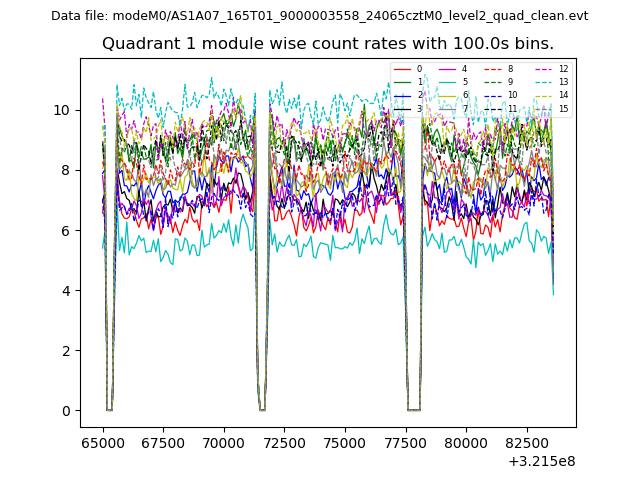
| Module-wise count rates for Quadrant A Data is divided into 100 sec bins |
 |
 |
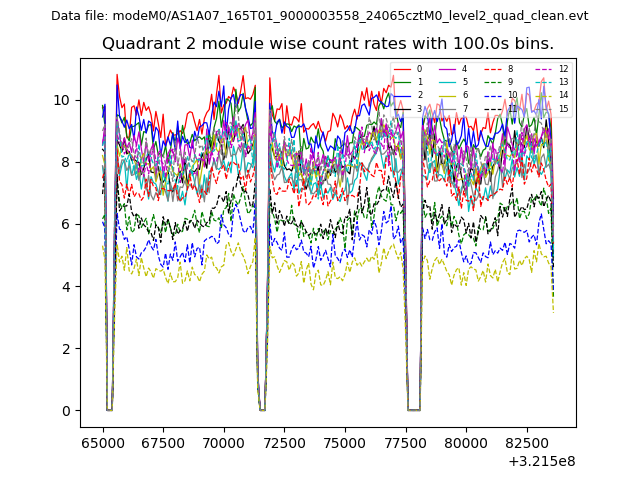
| Module-wise count rates for Quadrant B Data is divided into 100 sec bins |
 |
 |
| Module-wise count rates for Quadrant C Data is divided into 100 sec bins |
 |
 |
| Module-wise count rates for Quadrant D Data is divided into 100 sec bins |
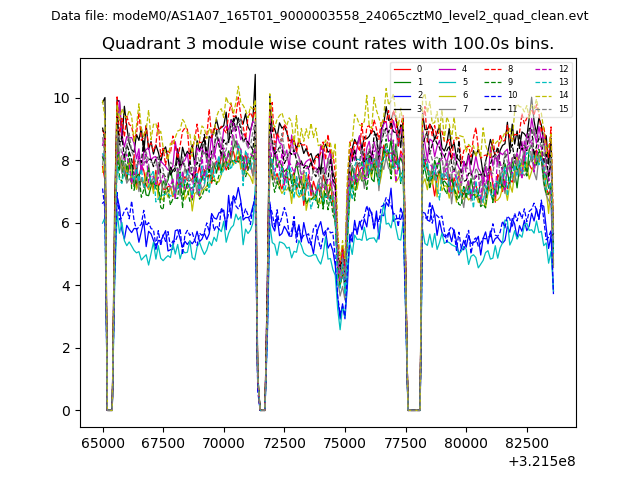 |
 |
| Parameter | Plot |
|---|---|
| CZT HV Monitor | 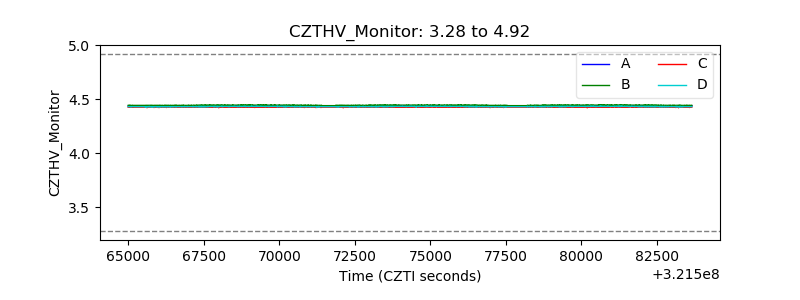 |
| D_VDD | 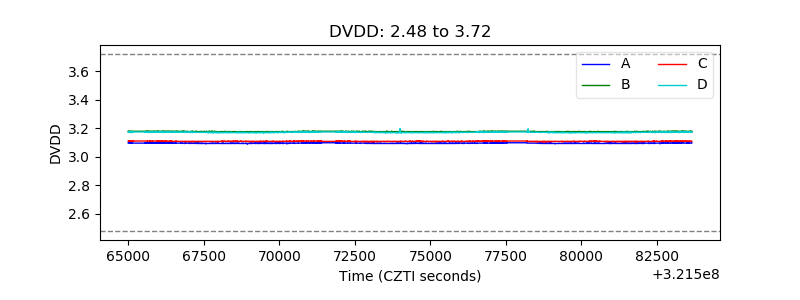 |
| Temperature 1 | 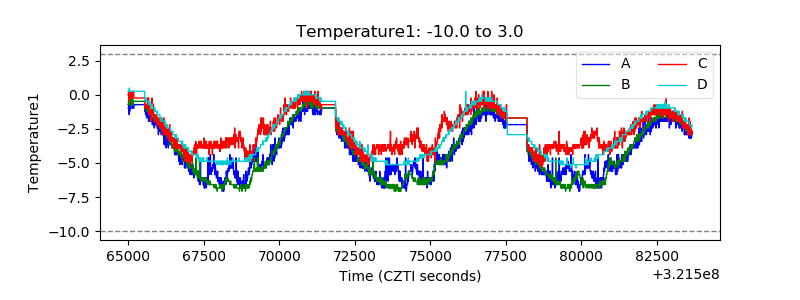 |
| Veto HV Monitor | 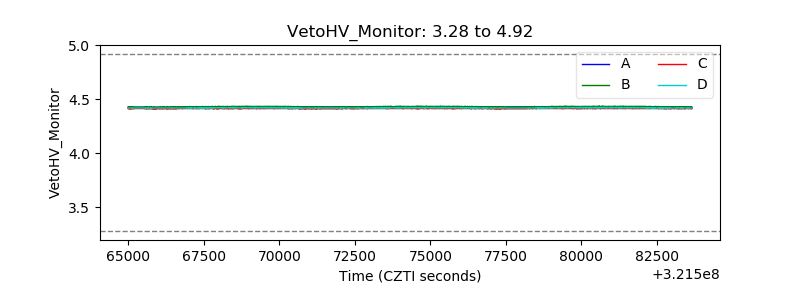 |
| Veto LLD | 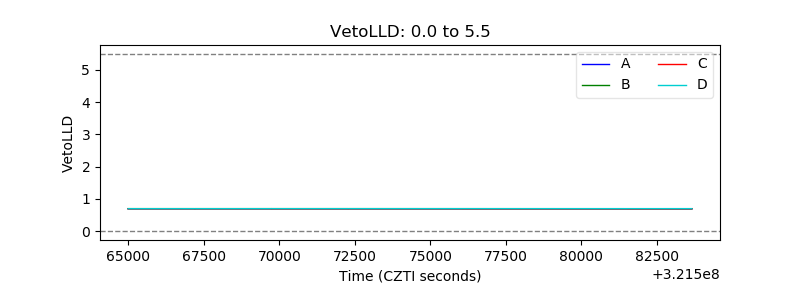 |
| Alpha Counter | 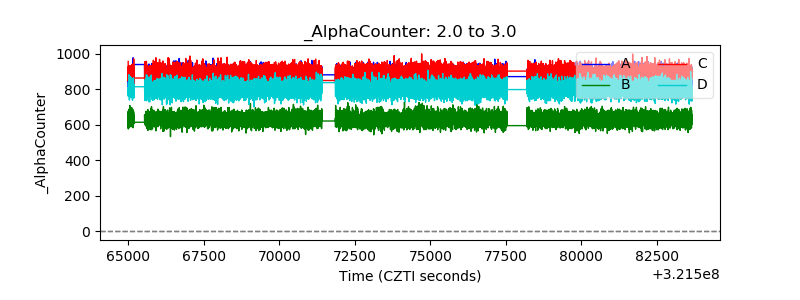 |
| _CPM_Rate | 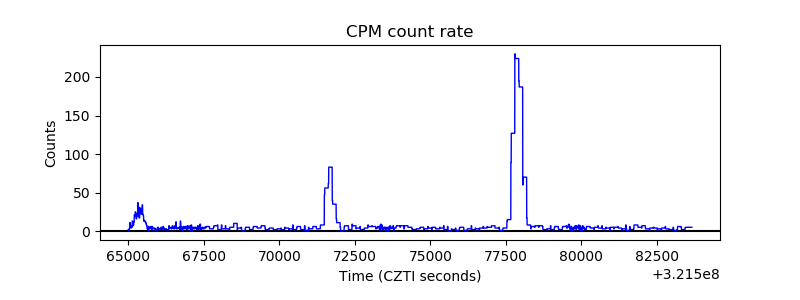 |
| CZT Counter | 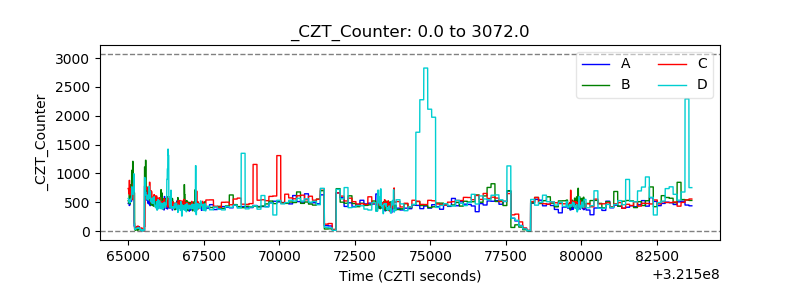 |
| +2.5 Volts monitor |  |
| +5 Volts monitor |  |
| _ROLL_ROT |  |
| _Roll_DEC | 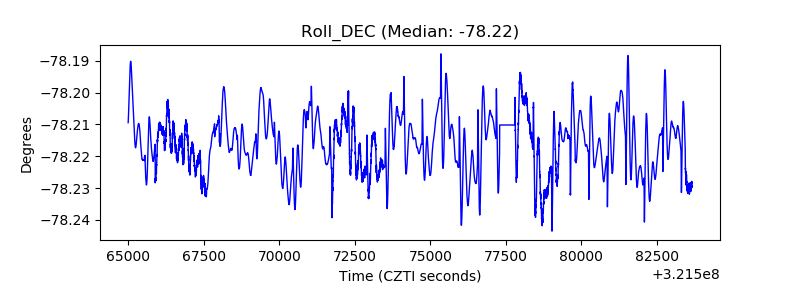 |
| _Roll_RA | 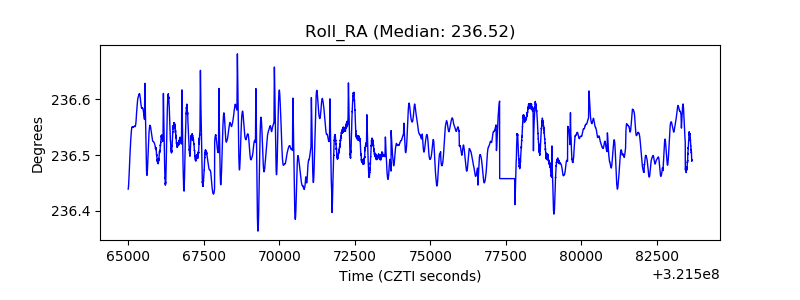 |
| Veto Counter | 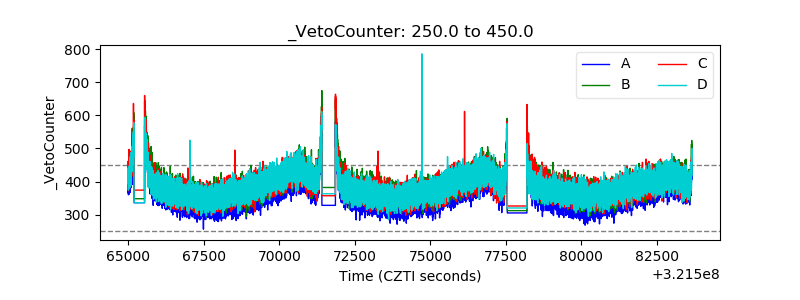 |