| Param | Original file | Final file |
|---|---|---|
| Filename | modeM0/AS1A07_165T01_9000003558_24066cztM0_level2.evt | modeM0/AS1A07_165T01_9000003558_24066cztM0_level2_quad_clean.evt |
| Size (bytes) | 621,005,760 | 148,173,120 |
| Size | 592.2 MB | 141.3 MB |
| Events in quadrant A | 3,640,938 | 1,010,459 |
| Events in quadrant B | 3,867,966 | 1,032,421 |
| Events in quadrant C | 4,714,748 | 981,637 |
| Events in quadrant D | 6,061,401 | 927,328 |
| Mode M9 | |||
|---|---|---|---|
| Quadrant | BADHDUFLAG | Total packets | Discarded packets |
| A | 0 | 17 | 0 |
| B | 0 | 17 | 0 |
| C | 0 | 17 | 0 |
| D | 0 | 17 | 0 |
| Mode M0 | |||
|---|---|---|---|
| Quadrant | BADHDUFLAG | Total packets | Discarded packets |
| A | 0 | 15687 | 2 |
| B | 0 | 16215 | 2 |
| C | 0 | 18666 | 2 |
| D | 0 | 23101 | 2 |
| Mode SS | |||
|---|---|---|---|
| Quadrant | BADHDUFLAG | Total packets | Discarded packets |
| A | 0 | 158 | 0 |
| B | 0 | 158 | 0 |
| C | 0 | 158 | 0 |
| D | 0 | 158 | 0 |
| Quadrant | Total seconds | Saturated seconds | Saturation percentage |
|---|---|---|---|
| A | 7708 | 37 | 0.480021% |
| B | 7709 | 47 | 0.609677% |
| C | 7709 | 143 | 1.854975% |
| D | 7709 | 605 | 7.847970% |
Noise dominated data is calculated using 1-second bins in cleaned event files. If a bin has >2000 counts, and if more than 50% of those come from <1% of pixels, then it is considered to be noise-dominated and hence unusable.
| Quadrant | # 1 sec bins | Bins with >0 counts | Bins with >2000 counts | High rate bins dominated by noise | Noise dominated (total time) | Noise dominated (detector-on time) | Marked lightcurve |
|---|---|---|---|---|---|---|---|
| A | 9448 | 7710 | 0 | 0 | 0.00% | 0.00% | 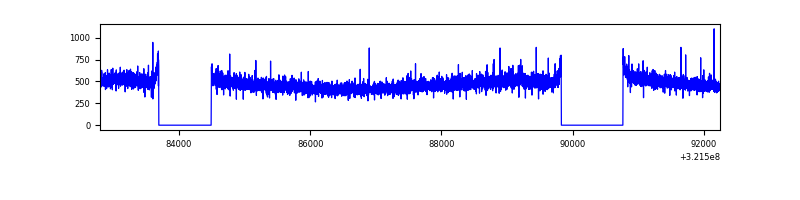 |
| B | 9449 | 7711 | 1 | 1 | 0.01% | 0.01% | 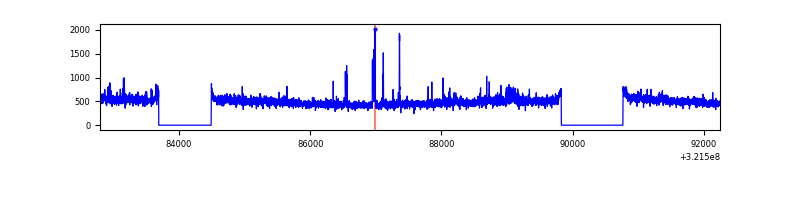 |
| C | 9449 | 7711 | 32 | 32 | 0.34% | 0.41% | 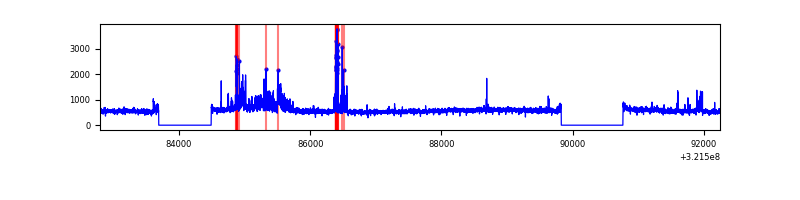 |
| D | 9449 | 7710 | 446 | 446 | 4.72% | 5.78% | 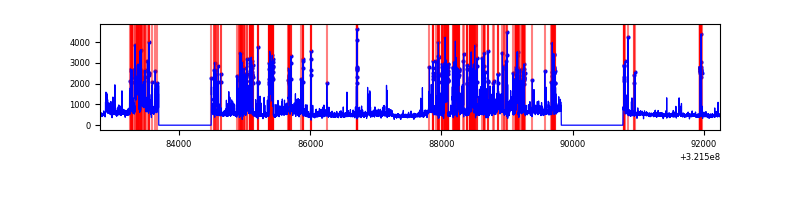 |
Top three noisy pixels from each quadrant. If the there are fewer than three noisy pixels in the level2.evt file, extra rows are filled as -1
| Pixel properties | Quadrant properties | ||||||
|---|---|---|---|---|---|---|---|
| Quadrant | DetID | PixID | Counts | Sigma | Mean | Median | Sigma |
| A | 6 | 16 | 11852 | 57.62 | 940 | 921 | 189.7 |
| A | 13 | 254 | 11353 | 54.99 | 940 | 921 | 189.7 |
| A | 3 | 137 | 8182 | 38.28 | 940 | 921 | 189.7 |
| B | 0 | 197 | 81018 | 451.71 | 941 | 918 | 177.3 |
| B | 7 | 202 | 44817 | 247.56 | 941 | 918 | 177.3 |
| B | 15 | 33 | 25691 | 139.7 | 941 | 918 | 177.3 |
| C | 7 | 247 | 589495 | 2778.5 | 906 | 912 | 211.8 |
| C | 0 | 239 | 446349 | 2102.76 | 906 | 912 | 211.8 |
| C | 14 | 238 | 144377 | 677.25 | 906 | 912 | 211.8 |
| D | 2 | 82 | 1817043 | 8426.4 | 888 | 863 | 215.5 |
| D | 8 | 195 | 613651 | 2843.11 | 888 | 863 | 215.5 |
| D | 1 | 52 | 112155 | 516.35 | 888 | 863 | 215.5 |
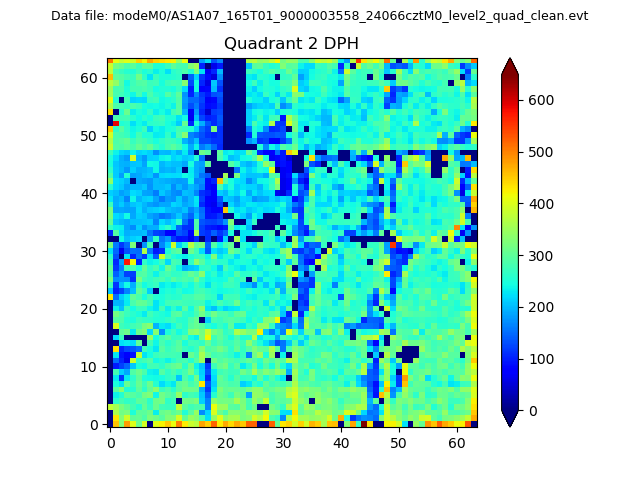
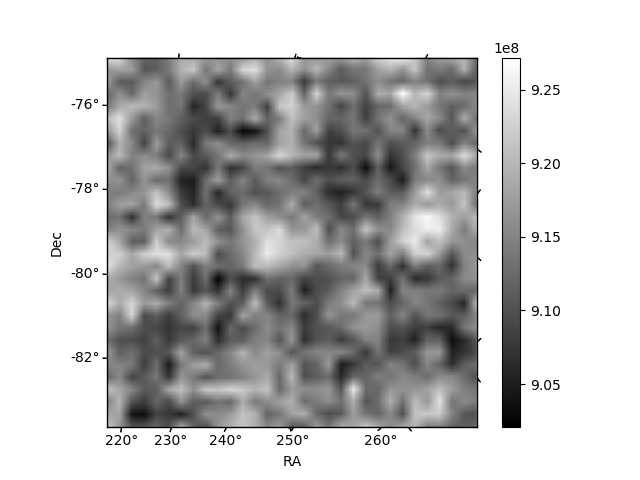
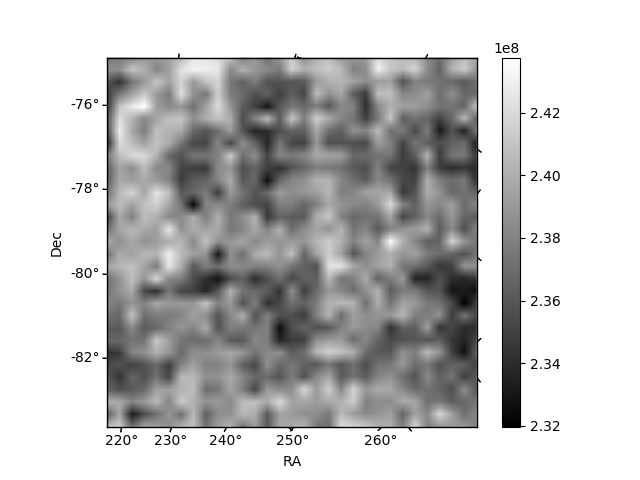
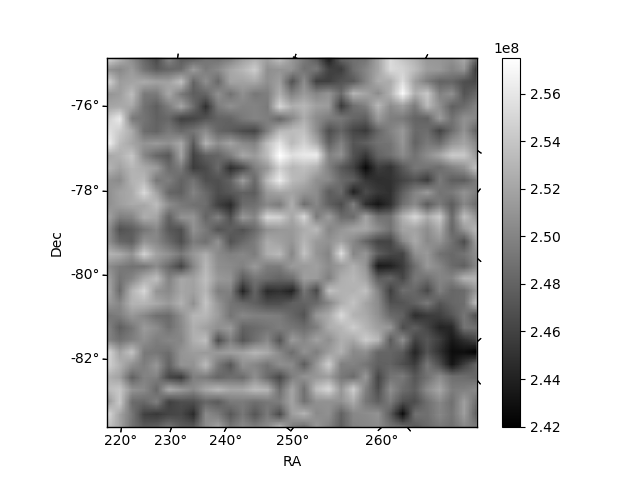
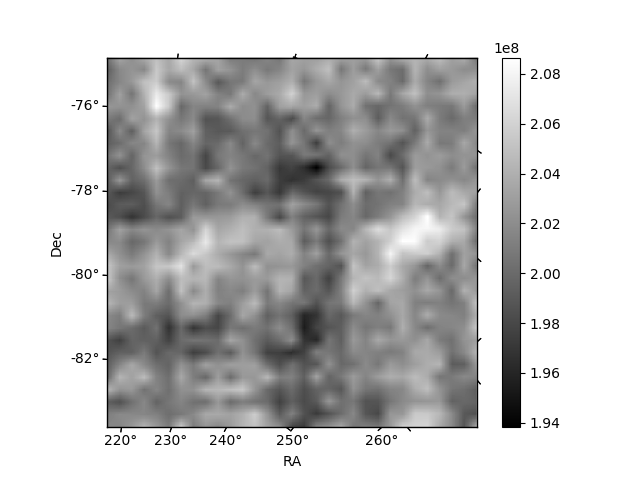
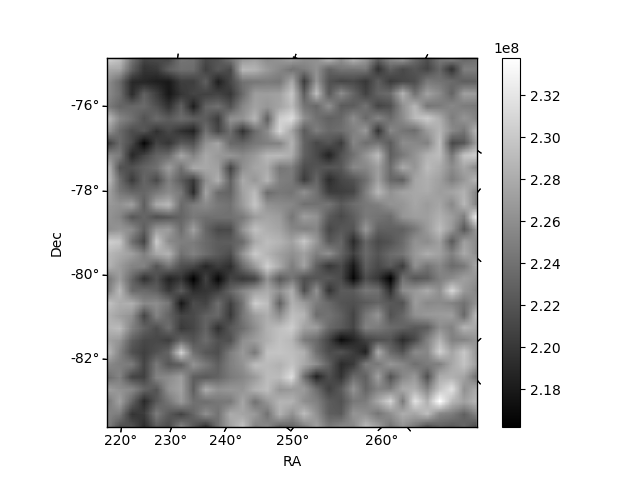
Histogram calculated using DETX and DETY for each event in the final _common_clean file
| Quadrant A | 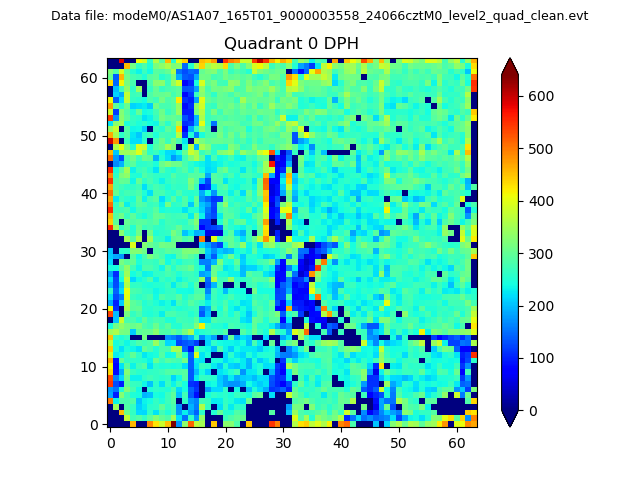 |
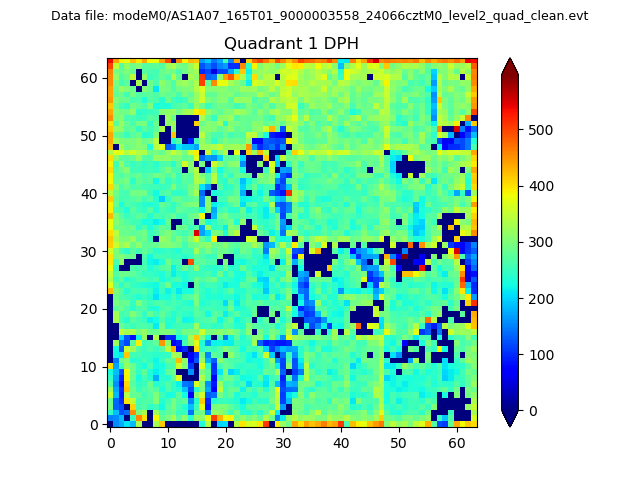 |
Quadrant B |
|---|---|---|---|
| Quadrant D | 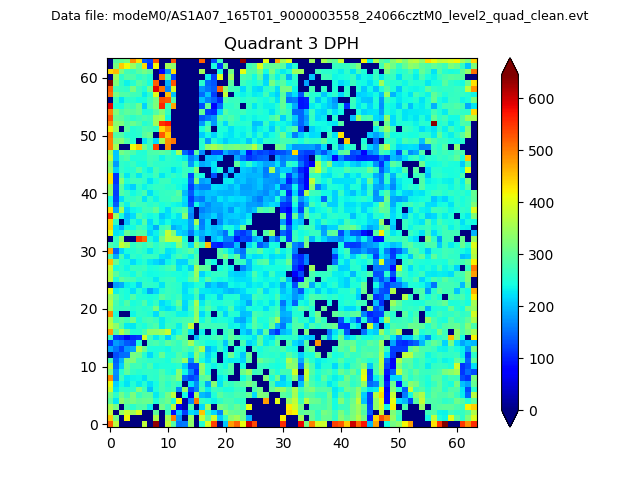 |
 |
Quadrant C |
| Plot type | Count rate plots | Images |
|---|---|---|
| Comparison with Poisson distribution Blue bars denote a histogram of data divided into 1 sec bins. Red curve is a Poisson curve with rate = median count rate of data. |
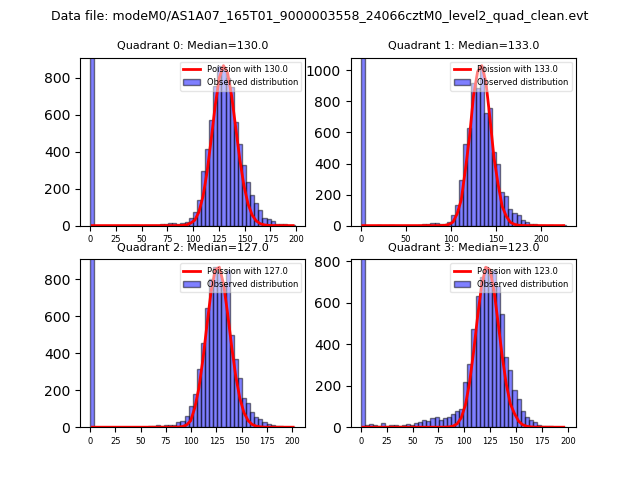 |
 |
| Quadrant-wise count rates Data is divided into 100 sec bins |
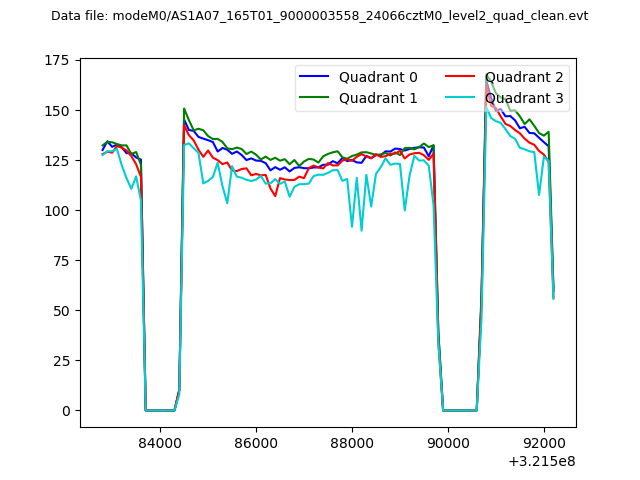 |
|
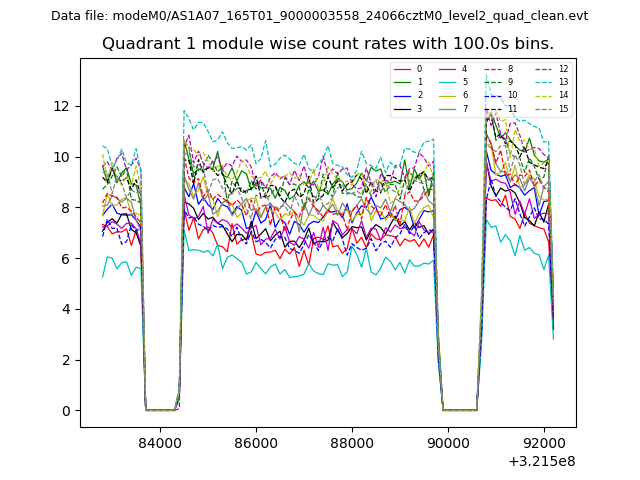
| Module-wise count rates for Quadrant A Data is divided into 100 sec bins |
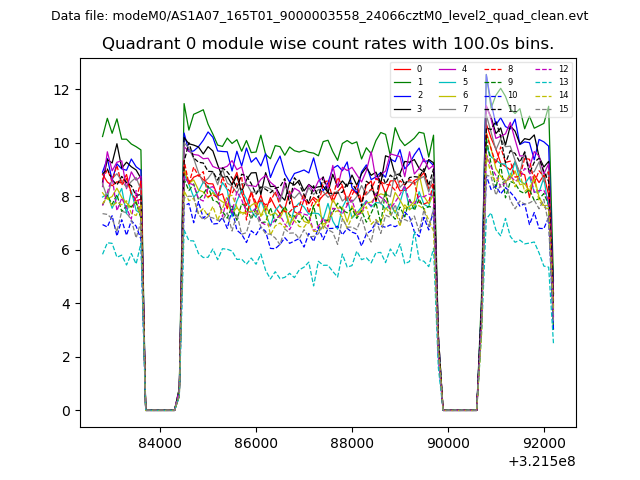 |
 |
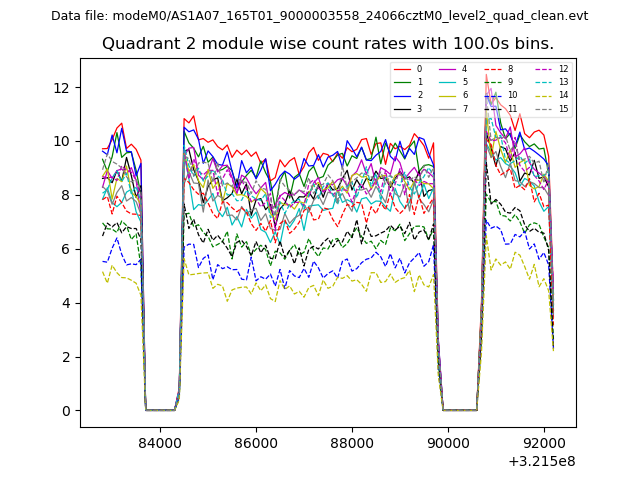
| Module-wise count rates for Quadrant B Data is divided into 100 sec bins |
 |
 |
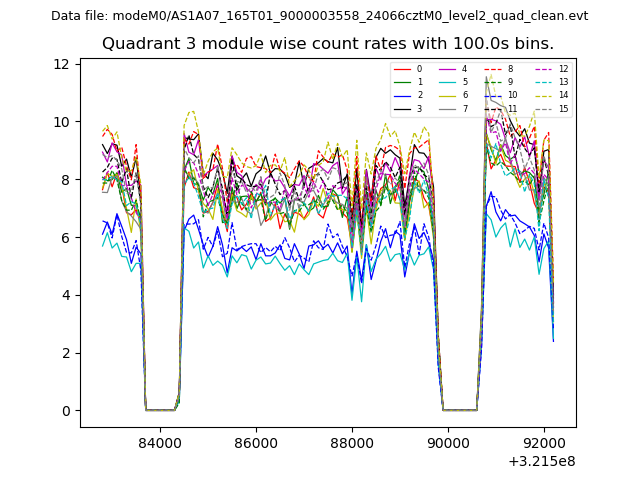
| Module-wise count rates for Quadrant C Data is divided into 100 sec bins |
 |
 |
| Module-wise count rates for Quadrant D Data is divided into 100 sec bins |
 |
 |
| Parameter | Plot |
|---|---|
| CZT HV Monitor | 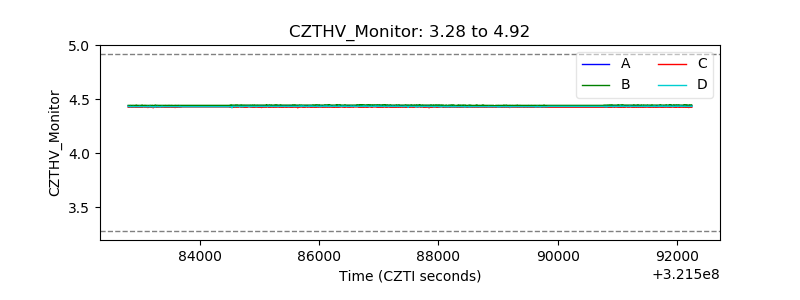 |
| D_VDD | 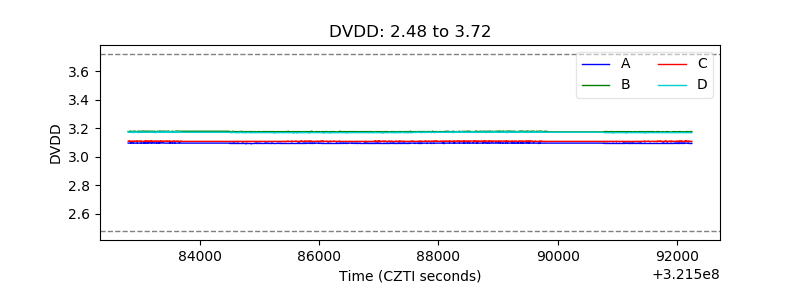 |
| Temperature 1 | 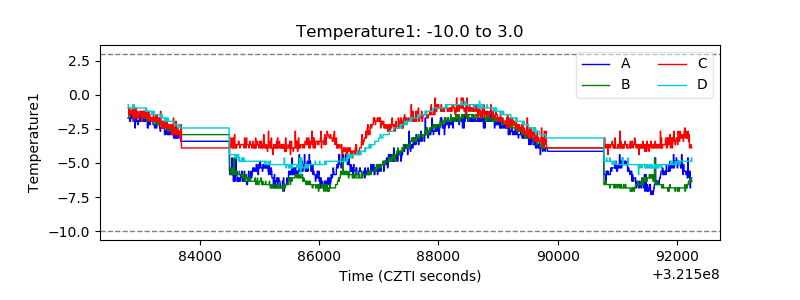 |
| Veto HV Monitor | 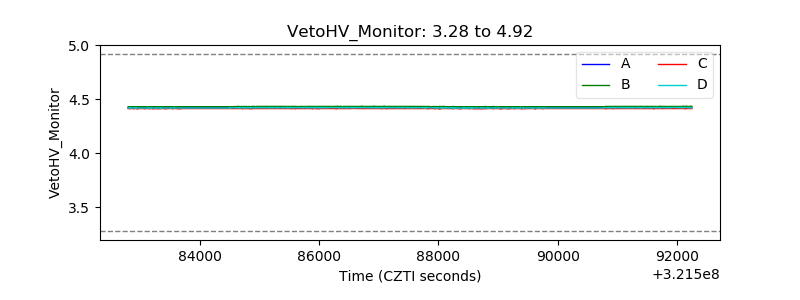 |
| Veto LLD | 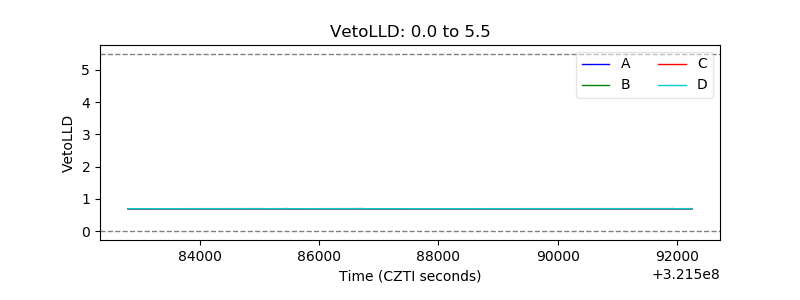 |
| Alpha Counter | 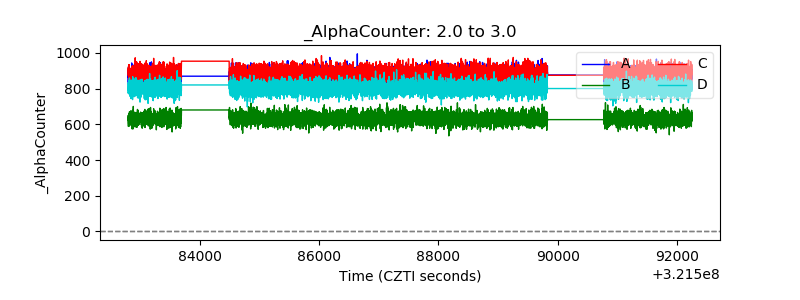 |
| _CPM_Rate | 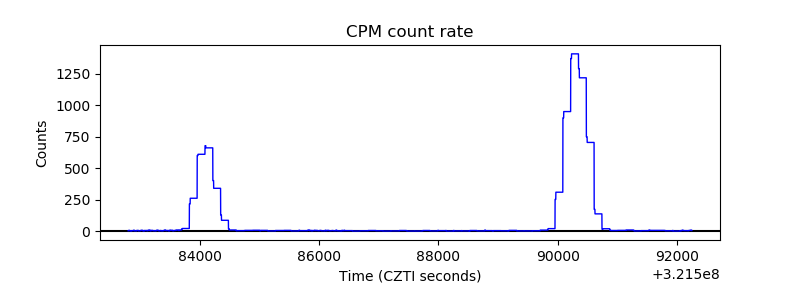 |
| CZT Counter | 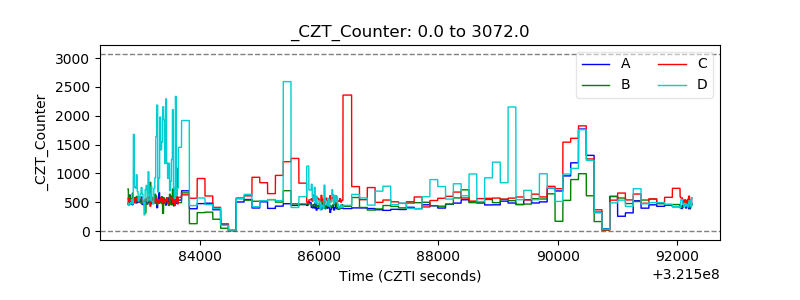 |
| +2.5 Volts monitor |  |
| +5 Volts monitor |  |
| _ROLL_ROT | 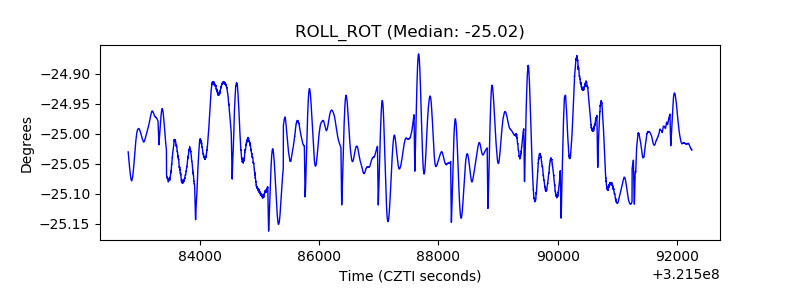 |
| _Roll_DEC | 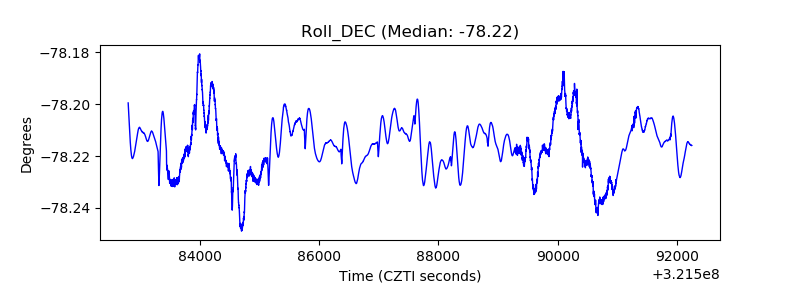 |
| _Roll_RA | 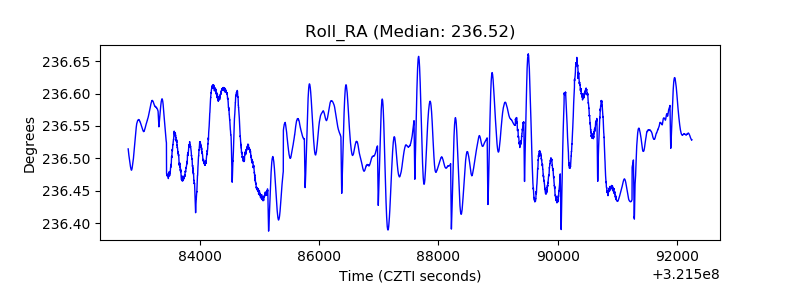 |
| Veto Counter | 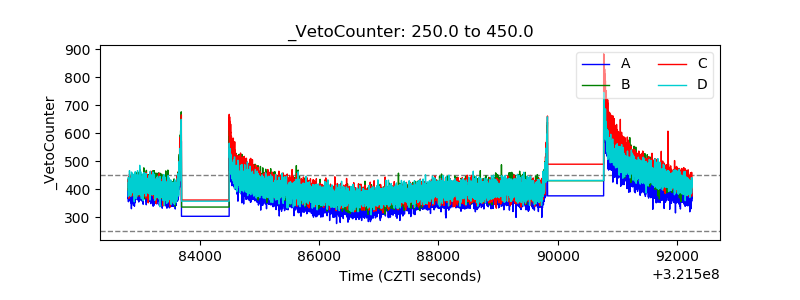 |