| Param | Original file | Final file |
|---|---|---|
| Filename | modeM0/AS1A07_165T01_9000003558_24069cztM0_level2.evt | modeM0/AS1A07_165T01_9000003558_24069cztM0_level2_quad_clean.evt |
| Size (bytes) | 546,986,880 | 138,962,880 |
| Size | 521.6 MB | 132.5 MB |
| Events in quadrant A | 3,245,529 | 951,960 |
| Events in quadrant B | 3,365,854 | 980,902 |
| Events in quadrant C | 4,905,347 | 922,624 |
| Events in quadrant D | 4,615,990 | 907,753 |
| Mode M9 | |||
|---|---|---|---|
| Quadrant | BADHDUFLAG | Total packets | Discarded packets |
| A | 0 | 12 | 0 |
| B | 0 | 12 | 0 |
| C | 0 | 12 | 0 |
| D | 0 | 12 | 0 |
| Mode M0 | |||
|---|---|---|---|
| Quadrant | BADHDUFLAG | Total packets | Discarded packets |
| A | 0 | 13626 | 3 |
| B | 0 | 14008 | 2 |
| C | 0 | 18865 | 2 |
| D | 0 | 18063 | 2 |
| Mode SS | |||
|---|---|---|---|
| Quadrant | BADHDUFLAG | Total packets | Discarded packets |
| A | 0 | 130 | 0 |
| B | 0 | 130 | 0 |
| C | 0 | 130 | 0 |
| D | 0 | 130 | 0 |
| Quadrant | Total seconds | Saturated seconds | Saturation percentage |
|---|---|---|---|
| A | 6390 | 12 | 0.187793% |
| B | 6390 | 28 | 0.438185% |
| C | 6390 | 385 | 6.025039% |
| D | 6390 | 90 | 1.408451% |
Noise dominated data is calculated using 1-second bins in cleaned event files. If a bin has >2000 counts, and if more than 50% of those come from <1% of pixels, then it is considered to be noise-dominated and hence unusable.
| Quadrant | # 1 sec bins | Bins with >0 counts | Bins with >2000 counts | High rate bins dominated by noise | Noise dominated (total time) | Noise dominated (detector-on time) | Marked lightcurve |
|---|---|---|---|---|---|---|---|
| A | 7590 | 6391 | 0 | 0 | 0.00% | 0.00% |  |
| B | 7590 | 6391 | 0 | 0 | 0.00% | 0.00% |  |
| C | 7590 | 6391 | 166 | 166 | 2.19% | 2.60% |  |
| D | 7590 | 6391 | 46 | 46 | 0.61% | 0.72% | 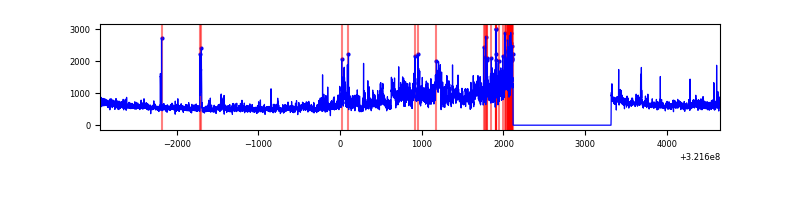 |
Top three noisy pixels from each quadrant. If the there are fewer than three noisy pixels in the level2.evt file, extra rows are filled as -1
| Pixel properties | Quadrant properties | ||||||
|---|---|---|---|---|---|---|---|
| Quadrant | DetID | PixID | Counts | Sigma | Mean | Median | Sigma |
| A | 2 | 250 | 15250 | 87.95 | 832 | 817 | 164.1 |
| A | 3 | 1 | 15170 | 87.46 | 832 | 817 | 164.1 |
| A | 13 | 254 | 9690 | 54.07 | 832 | 817 | 164.1 |
| B | 15 | 33 | 53352 | 341.83 | 833 | 814 | 153.7 |
| B | 12 | 111 | 17399 | 107.91 | 833 | 814 | 153.7 |
| B | 0 | 189 | 16626 | 102.88 | 833 | 814 | 153.7 |
| C | 10 | 9 | 839012 | 4501.65 | 807 | 814 | 186.2 |
| C | 7 | 247 | 502923 | 2696.64 | 807 | 814 | 186.2 |
| C | 0 | 239 | 288865 | 1547.02 | 807 | 814 | 186.2 |
| D | 8 | 195 | 1228941 | 6213.46 | 821 | 799 | 197.7 |
| D | 1 | 52 | 129226 | 649.74 | 821 | 799 | 197.7 |
| D | 11 | 176 | 105580 | 530.11 | 821 | 799 | 197.7 |
Histogram calculated using DETX and DETY for each event in the final _common_clean file
| Quadrant A |  |
 |
Quadrant B |
|---|---|---|---|
| Quadrant D |  |
 |
Quadrant C |
| Plot type | Count rate plots | Images |
|---|---|---|
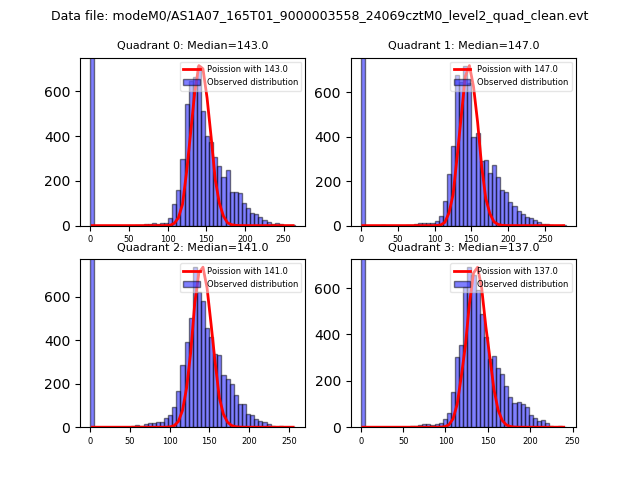
| Comparison with Poisson distribution Blue bars denote a histogram of data divided into 1 sec bins. Red curve is a Poisson curve with rate = median count rate of data. |
 |
 |
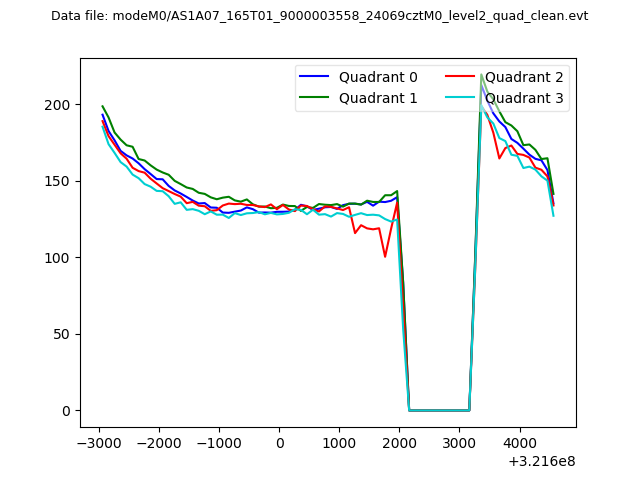
| Quadrant-wise count rates Data is divided into 100 sec bins |
 |
|
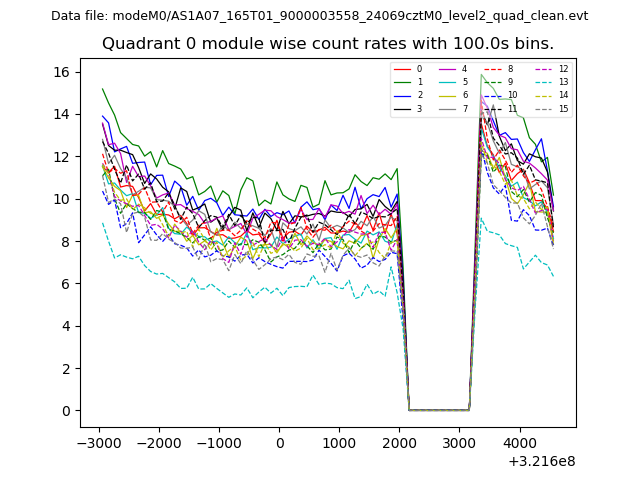
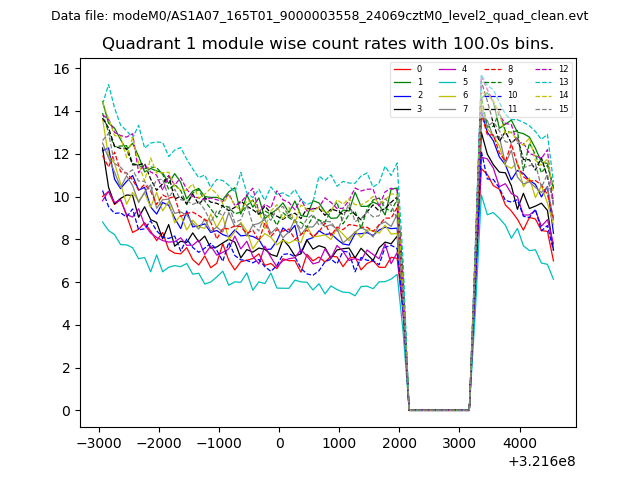
| Module-wise count rates for Quadrant A Data is divided into 100 sec bins |
 |
 |
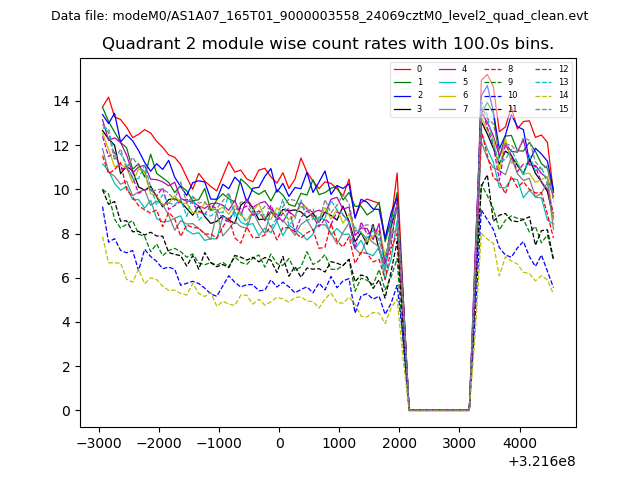
| Module-wise count rates for Quadrant B Data is divided into 100 sec bins |
 |
 |
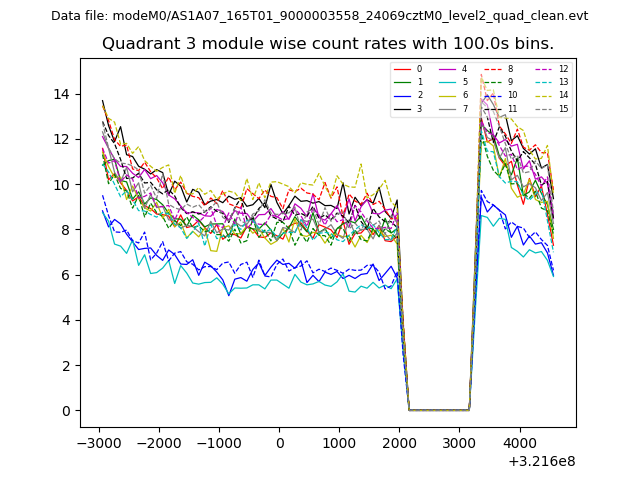
| Module-wise count rates for Quadrant C Data is divided into 100 sec bins |
 |
 |
| Module-wise count rates for Quadrant D Data is divided into 100 sec bins |
 |
 |
| Parameter | Plot |
|---|---|
| CZT HV Monitor | 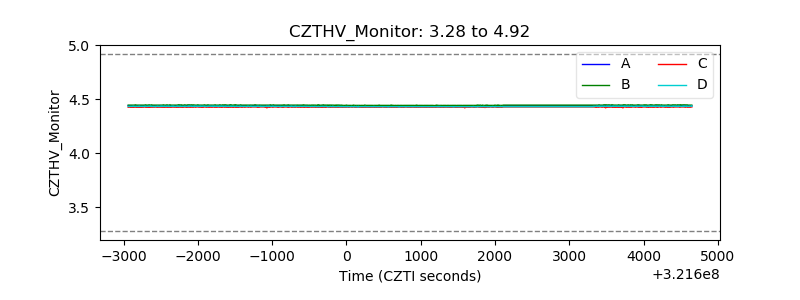 |
| D_VDD |  |
| Temperature 1 |  |
| Veto HV Monitor |  |
| Veto LLD |  |
| Alpha Counter | 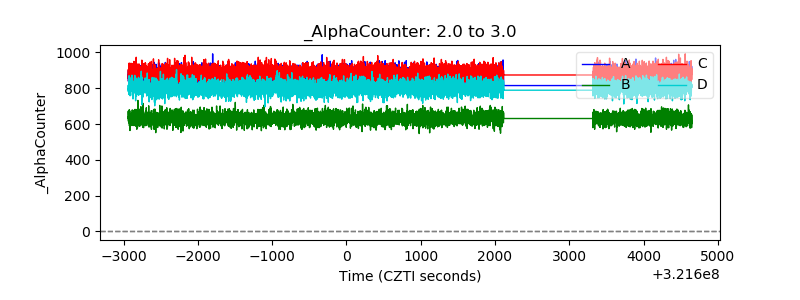 |
| _CPM_Rate | 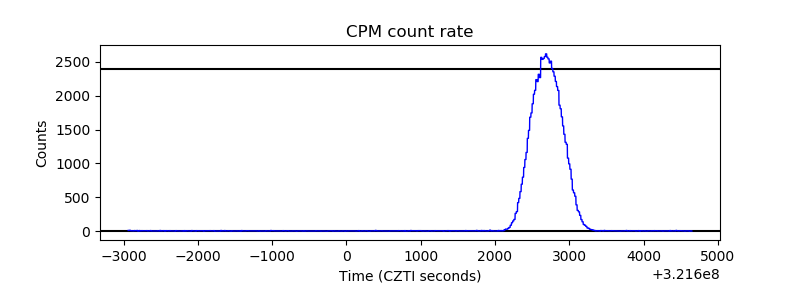 |
| CZT Counter |  |
| +2.5 Volts monitor |  |
| +5 Volts monitor |  |
| _ROLL_ROT | 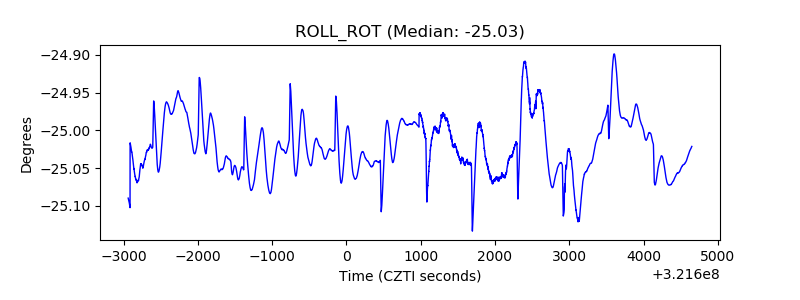 |
| _Roll_DEC |  |
| _Roll_RA |  |
| Veto Counter | 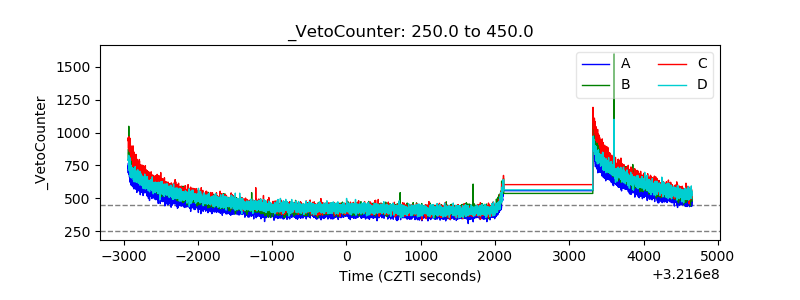 |