| Param | Original file | Final file |
|---|---|---|
| Filename | modeM0/AS1A07_165T01_9000003558_24073cztM0_level2.evt | modeM0/AS1A07_165T01_9000003558_24073cztM0_level2_quad_clean.evt |
| Size (bytes) | 465,108,480 | 124,430,400 |
| Size | 443.6 MB | 118.7 MB |
| Events in quadrant A | 2,938,533 | 860,265 |
| Events in quadrant B | 2,985,806 | 873,588 |
| Events in quadrant C | 4,230,719 | 792,674 |
| Events in quadrant D | 3,526,283 | 826,147 |
| Mode M9 | |||
|---|---|---|---|
| Quadrant | BADHDUFLAG | Total packets | Discarded packets |
| A | 0 | 12 | 0 |
| B | 0 | 12 | 0 |
| C | 0 | 12 | 0 |
| D | 0 | 12 | 0 |
| Mode M0 | |||
|---|---|---|---|
| Quadrant | BADHDUFLAG | Total packets | Discarded packets |
| A | 0 | 12296 | 1 |
| B | 0 | 12376 | 1 |
| C | 0 | 16166 | 1 |
| D | 0 | 14271 | 1 |
| Mode SS | |||
|---|---|---|---|
| Quadrant | BADHDUFLAG | Total packets | Discarded packets |
| A | 0 | 120 | 0 |
| B | 0 | 120 | 0 |
| C | 0 | 120 | 0 |
| D | 0 | 120 | 0 |
| Quadrant | Total seconds | Saturated seconds | Saturation percentage |
|---|---|---|---|
| A | 5957 | 74 | 1.242236% |
| B | 5958 | 68 | 1.141323% |
| C | 5958 | 661 | 11.094327% |
| D | 5957 | 57 | 0.956857% |
Noise dominated data is calculated using 1-second bins in cleaned event files. If a bin has >2000 counts, and if more than 50% of those come from <1% of pixels, then it is considered to be noise-dominated and hence unusable.
| Quadrant | # 1 sec bins | Bins with >0 counts | Bins with >2000 counts | High rate bins dominated by noise | Noise dominated (total time) | Noise dominated (detector-on time) | Marked lightcurve |
|---|---|---|---|---|---|---|---|
| A | 7112 | 5957 | 0 | 0 | 0.00% | 0.00% | 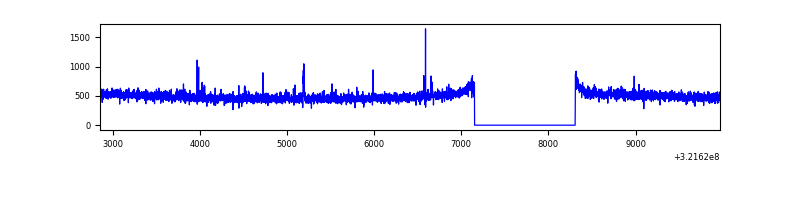 |
| B | 7113 | 5959 | 1 | 1 | 0.01% | 0.02% | 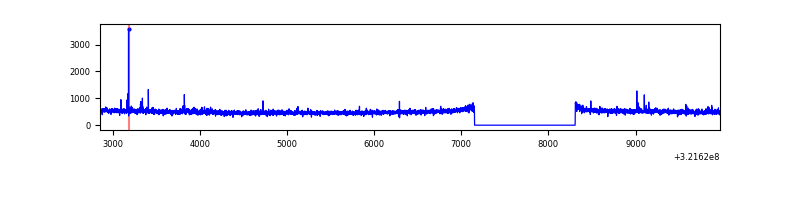 |
| C | 7113 | 5959 | 538 | 538 | 7.56% | 9.03% | 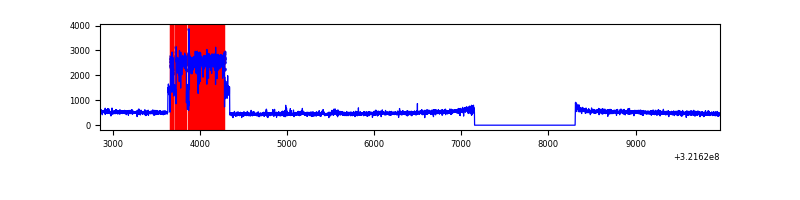 |
| D | 7112 | 5958 | 3 | 3 | 0.04% | 0.05% | 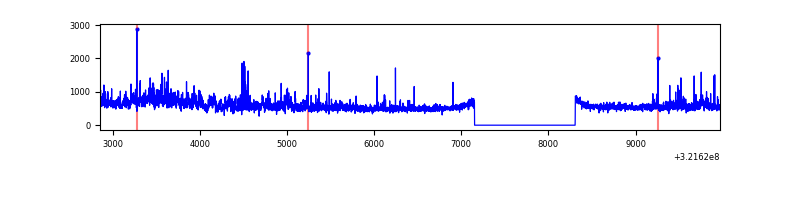 |
Top three noisy pixels from each quadrant. If the there are fewer than three noisy pixels in the level2.evt file, extra rows are filled as -1
| Pixel properties | Quadrant properties | ||||||
|---|---|---|---|---|---|---|---|
| Quadrant | DetID | PixID | Counts | Sigma | Mean | Median | Sigma |
| A | 3 | 1 | 20774 | 133.49 | 755 | 744 | 150.0 |
| A | 13 | 254 | 9654 | 59.38 | 755 | 744 | 150.0 |
| A | 0 | 226 | 6770 | 40.16 | 755 | 744 | 150.0 |
| B | 12 | 111 | 15873 | 109.31 | 747 | 730 | 138.5 |
| B | 0 | 228 | 14140 | 96.8 | 747 | 730 | 138.5 |
| B | 11 | 111 | 14096 | 96.49 | 747 | 730 | 138.5 |
| C | 10 | 9 | 1407801 | 8823.72 | 689 | 694 | 159.5 |
| C | 14 | 238 | 111459 | 694.59 | 689 | 694 | 159.5 |
| C | 0 | 239 | 16973 | 102.08 | 689 | 694 | 159.5 |
| D | 8 | 195 | 571349 | 3244.48 | 734 | 712 | 175.9 |
| D | 1 | 52 | 150229 | 850.11 | 734 | 712 | 175.9 |
| D | 2 | 234 | 28560 | 158.34 | 734 | 712 | 175.9 |
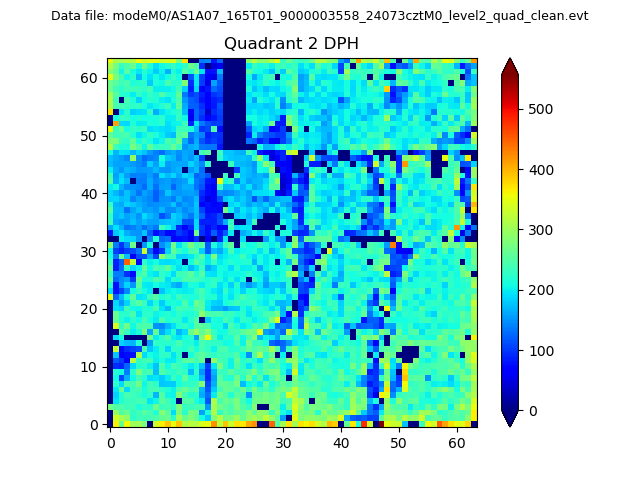
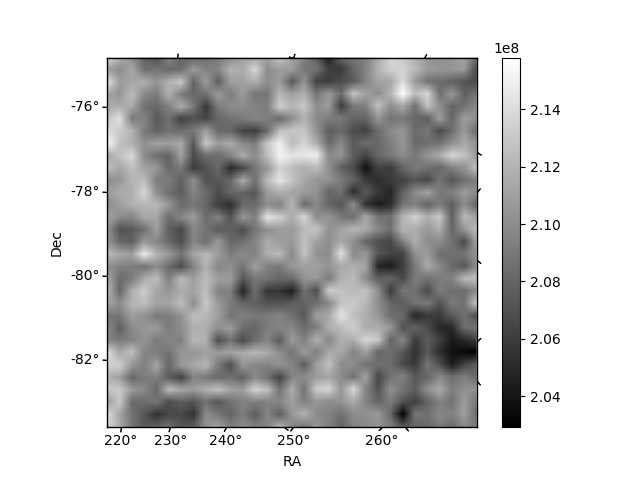
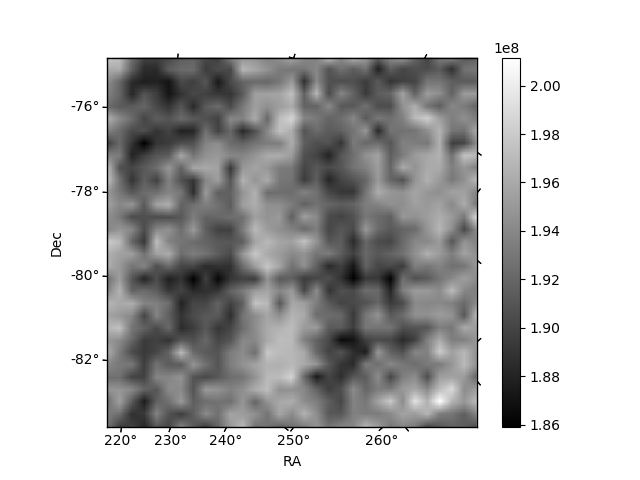
Histogram calculated using DETX and DETY for each event in the final _common_clean file
| Quadrant A | 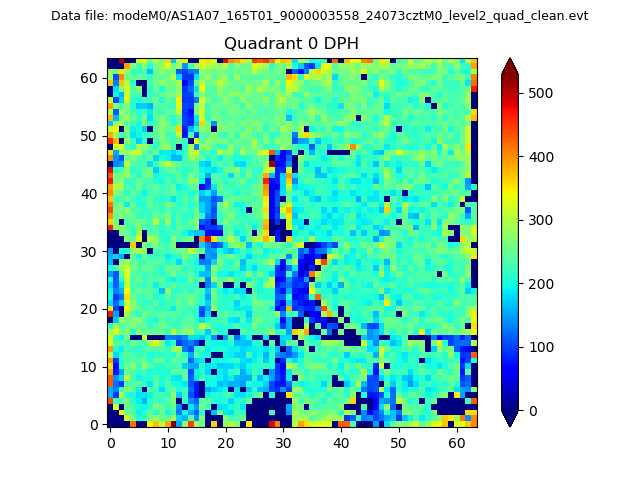 |
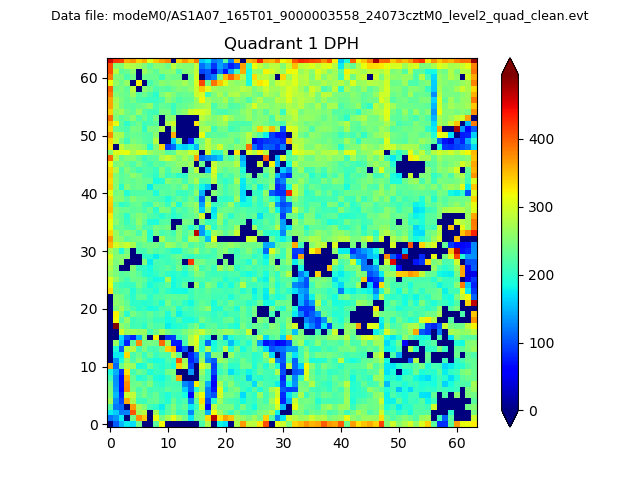 |
Quadrant B |
|---|---|---|---|
| Quadrant D | 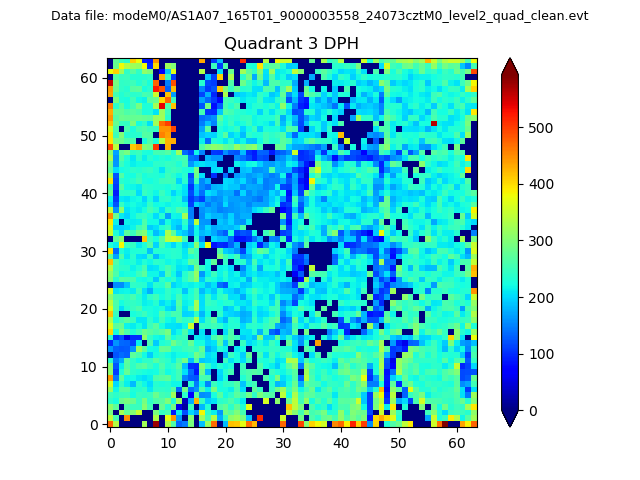 |
 |
Quadrant C |
| Plot type | Count rate plots | Images |
|---|---|---|
| Comparison with Poisson distribution Blue bars denote a histogram of data divided into 1 sec bins. Red curve is a Poisson curve with rate = median count rate of data. |
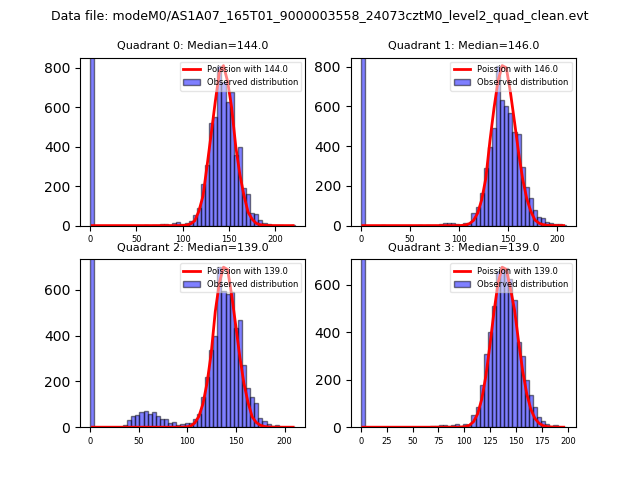 |
 |
| Quadrant-wise count rates Data is divided into 100 sec bins |
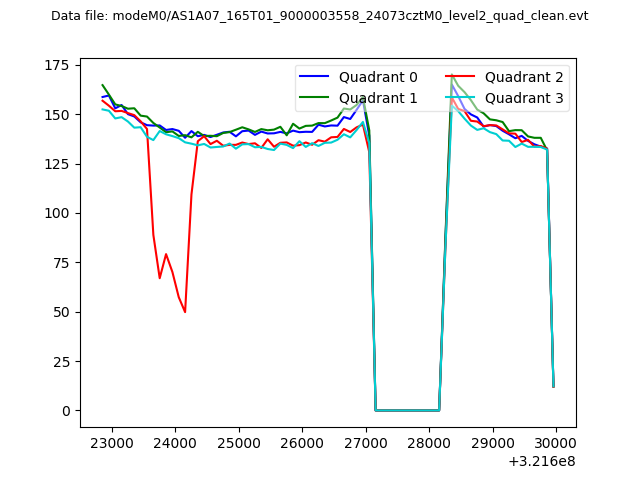 |
|
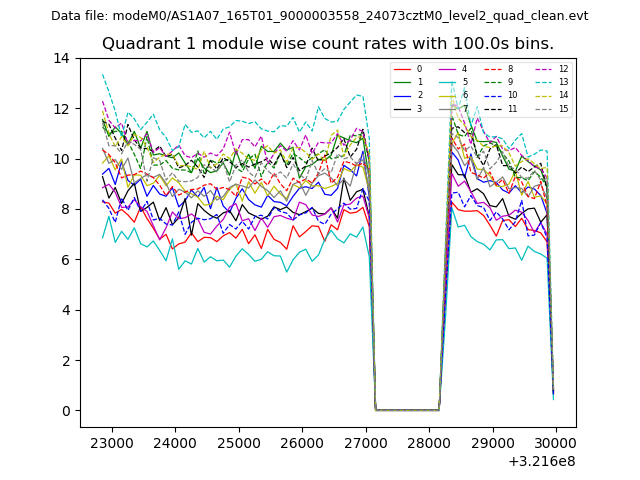
| Module-wise count rates for Quadrant A Data is divided into 100 sec bins |
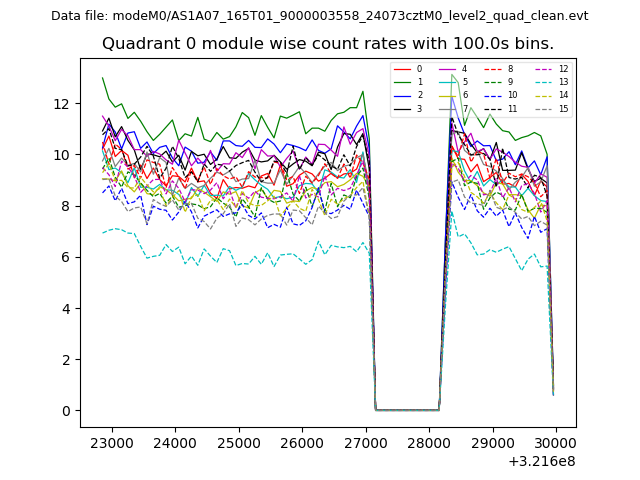 |
 |
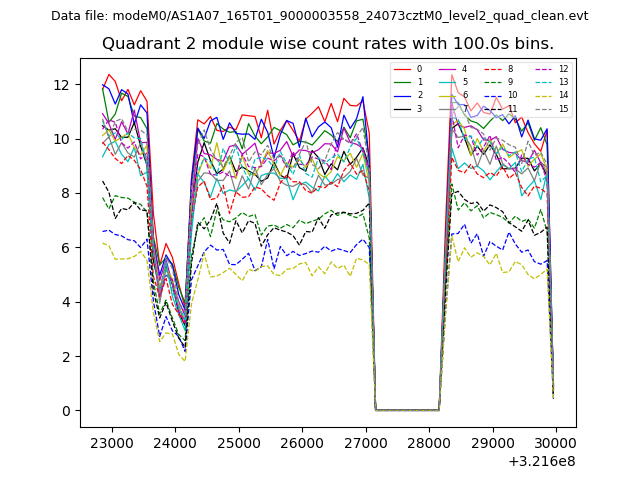
| Module-wise count rates for Quadrant B Data is divided into 100 sec bins |
 |
 |
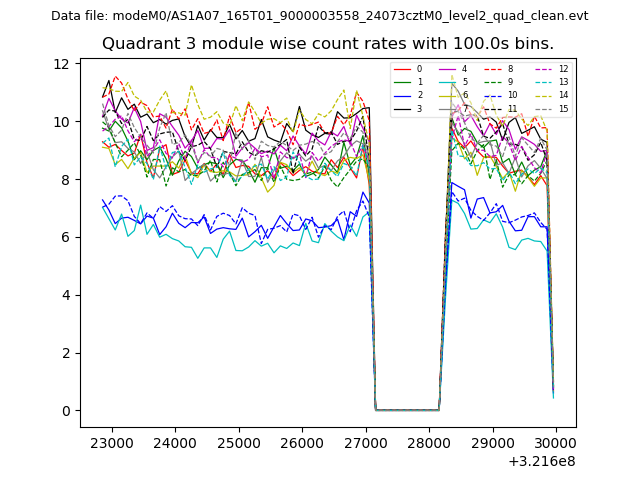
| Module-wise count rates for Quadrant C Data is divided into 100 sec bins |
 |
 |
| Module-wise count rates for Quadrant D Data is divided into 100 sec bins |
 |
 |
| Parameter | Plot |
|---|---|
| CZT HV Monitor | 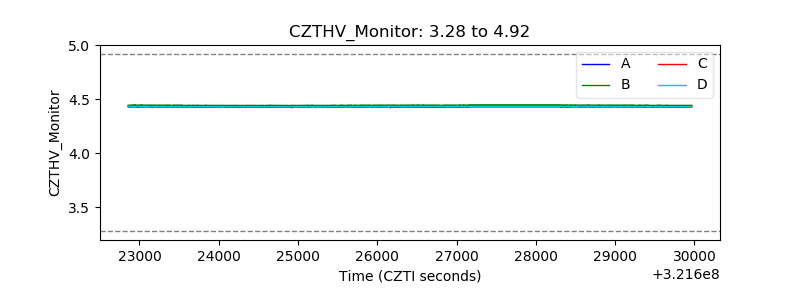 |
| D_VDD | 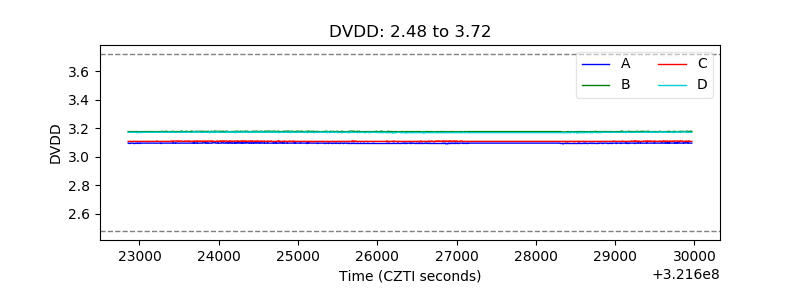 |
| Temperature 1 | 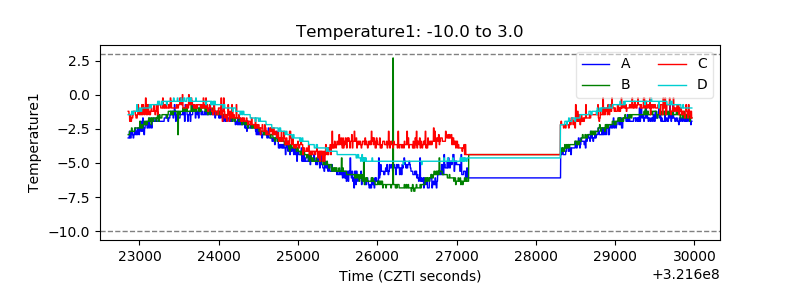 |
| Veto HV Monitor | 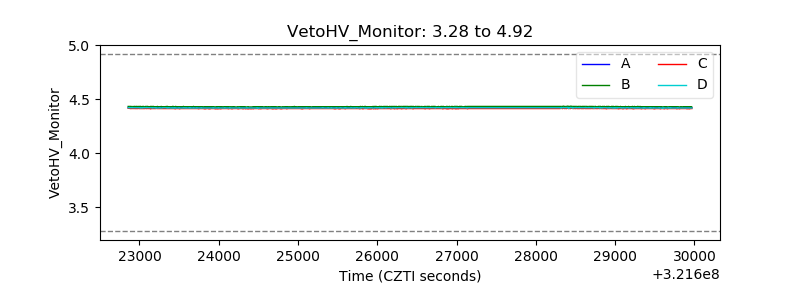 |
| Veto LLD | 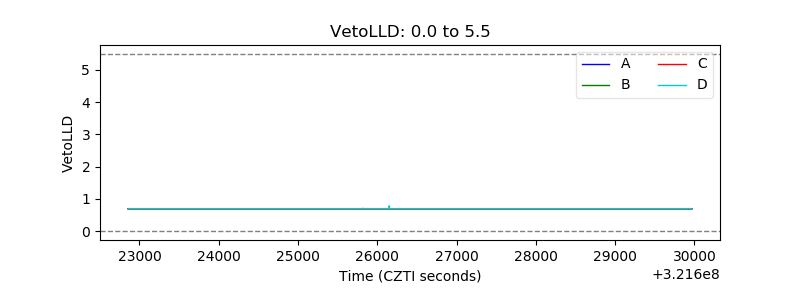 |
| Alpha Counter | 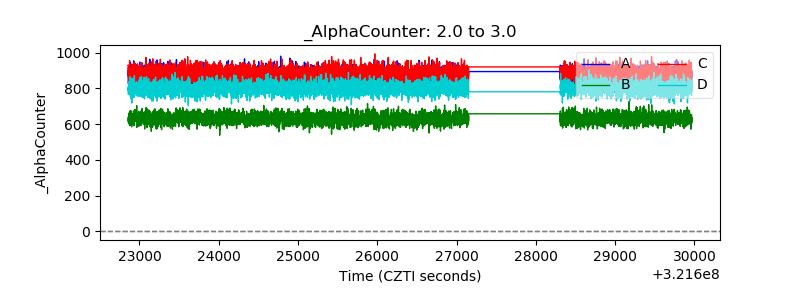 |
| _CPM_Rate | 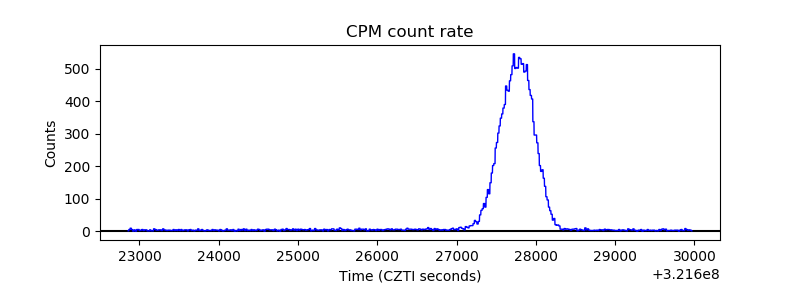 |
| CZT Counter | 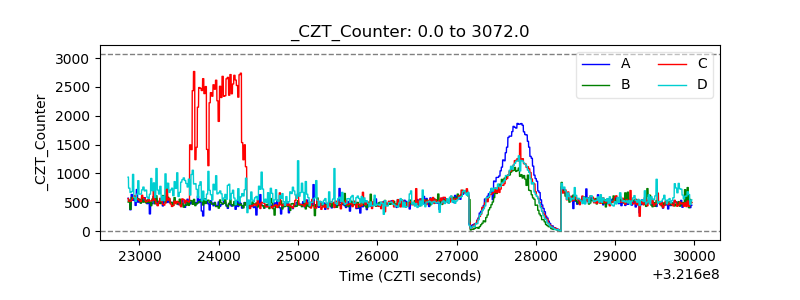 |
| +2.5 Volts monitor |  |
| +5 Volts monitor |  |
| _ROLL_ROT | 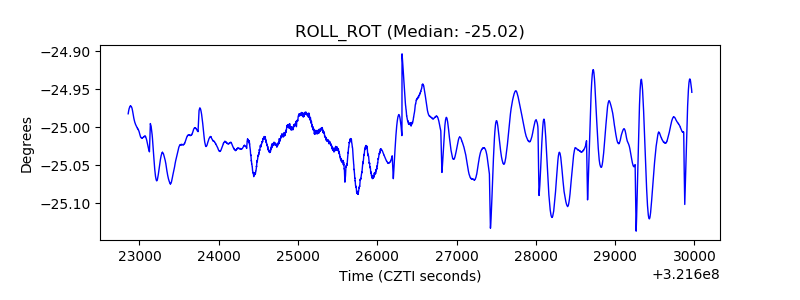 |
| _Roll_DEC | 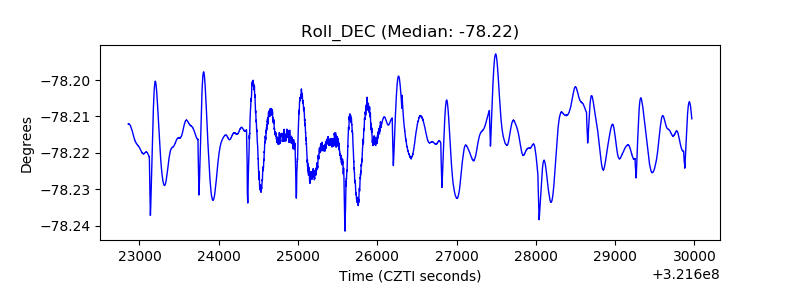 |
| _Roll_RA |  |
| Veto Counter | 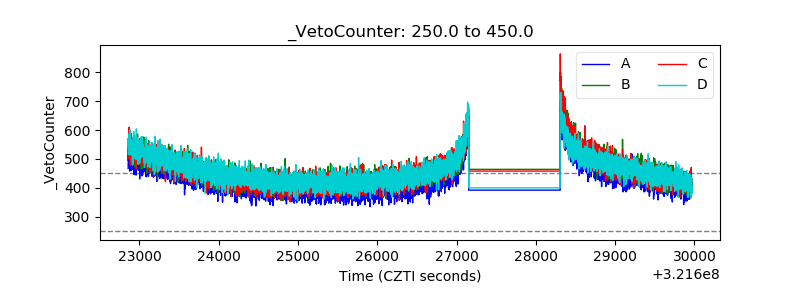 |