| Param | Original file | Final file |
|---|---|---|
| Filename | modeM0/AS1A07_165T01_9000003558_24075cztM0_level2.evt | modeM0/AS1A07_165T01_9000003558_24075cztM0_level2_quad_clean.evt |
| Size (bytes) | 499,017,600 | 131,581,440 |
| Size | 475.9 MB | 125.5 MB |
| Events in quadrant A | 3,170,142 | 891,546 |
| Events in quadrant B | 3,374,541 | 904,283 |
| Events in quadrant C | 3,272,338 | 868,919 |
| Events in quadrant D | 4,833,924 | 846,444 |
| Mode M9 | |||
|---|---|---|---|
| Quadrant | BADHDUFLAG | Total packets | Discarded packets |
| A | 0 | 4 | 0 |
| B | 0 | 4 | 0 |
| C | 0 | 4 | 0 |
| D | 0 | 4 | 0 |
| Mode M0 | |||
|---|---|---|---|
| Quadrant | BADHDUFLAG | Total packets | Discarded packets |
| A | 0 | 13920 | 1 |
| B | 0 | 14460 | 1 |
| C | 0 | 14093 | 1 |
| D | 0 | 18924 | 1 |
| Mode SS | |||
|---|---|---|---|
| Quadrant | BADHDUFLAG | Total packets | Discarded packets |
| A | 0 | 140 | 0 |
| B | 0 | 140 | 0 |
| C | 0 | 140 | 0 |
| D | 0 | 140 | 0 |
| Quadrant | Total seconds | Saturated seconds | Saturation percentage |
|---|---|---|---|
| A | 6798 | 72 | 1.059135% |
| B | 6798 | 91 | 1.338629% |
| C | 6798 | 115 | 1.691674% |
| D | 6798 | 171 | 2.515446% |
Noise dominated data is calculated using 1-second bins in cleaned event files. If a bin has >2000 counts, and if more than 50% of those come from <1% of pixels, then it is considered to be noise-dominated and hence unusable.
| Quadrant | # 1 sec bins | Bins with >0 counts | Bins with >2000 counts | High rate bins dominated by noise | Noise dominated (total time) | Noise dominated (detector-on time) | Marked lightcurve |
|---|---|---|---|---|---|---|---|
| A | 7253 | 6800 | 0 | 0 | 0.00% | 0.00% | 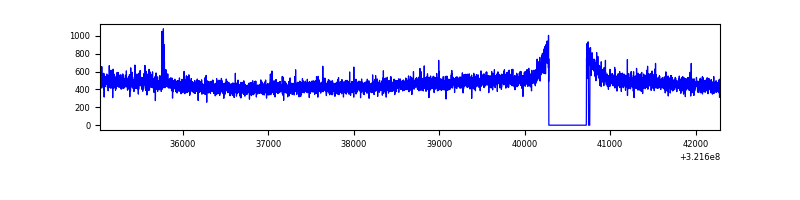 |
| B | 7253 | 6800 | 6 | 6 | 0.08% | 0.09% | 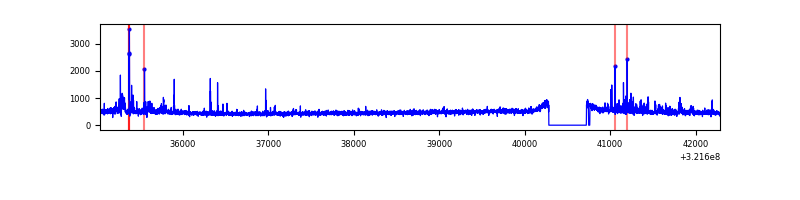 |
| C | 7253 | 6800 | 3 | 3 | 0.04% | 0.04% | 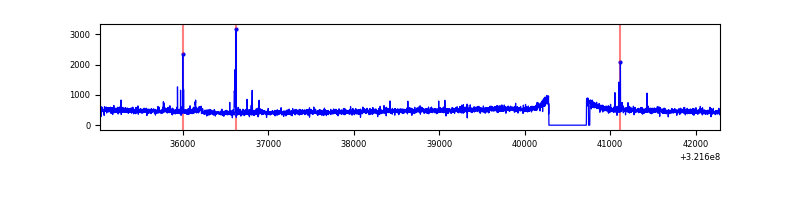 |
| D | 7253 | 6800 | 110 | 110 | 1.52% | 1.62% | 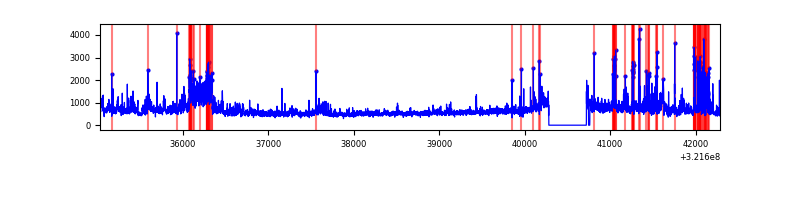 |
Top three noisy pixels from each quadrant. If the there are fewer than three noisy pixels in the level2.evt file, extra rows are filled as -1
| Pixel properties | Quadrant properties | ||||||
|---|---|---|---|---|---|---|---|
| Quadrant | DetID | PixID | Counts | Sigma | Mean | Median | Sigma |
| A | 13 | 254 | 11386 | 64.12 | 819 | 801 | 165.1 |
| A | 0 | 226 | 7125 | 38.31 | 819 | 801 | 165.1 |
| A | 3 | 137 | 7022 | 37.69 | 819 | 801 | 165.1 |
| B | 0 | 189 | 111362 | 724.13 | 814 | 794 | 152.7 |
| B | 0 | 229 | 33580 | 214.72 | 814 | 794 | 152.7 |
| B | 15 | 33 | 28867 | 183.86 | 814 | 794 | 152.7 |
| C | 14 | 238 | 124324 | 678.41 | 783 | 788 | 182.1 |
| C | 0 | 239 | 50584 | 273.46 | 783 | 788 | 182.1 |
| C | 7 | 247 | 29246 | 156.28 | 783 | 788 | 182.1 |
| D | 8 | 195 | 1167182 | 6146.34 | 789 | 764 | 189.8 |
| D | 1 | 52 | 471569 | 2480.87 | 789 | 764 | 189.8 |
| D | 12 | 233 | 139042 | 728.64 | 789 | 764 | 189.8 |
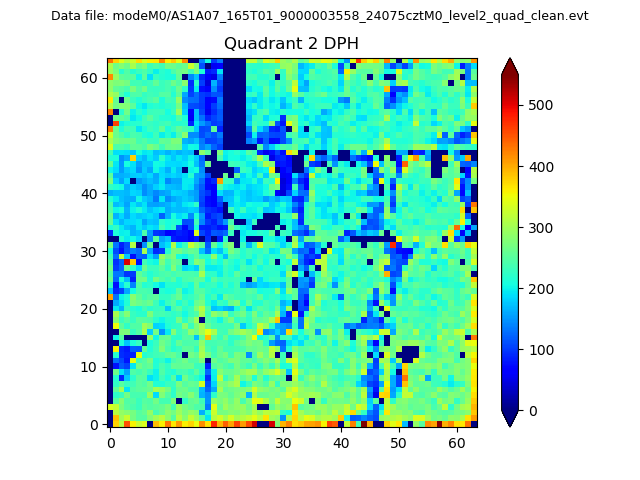
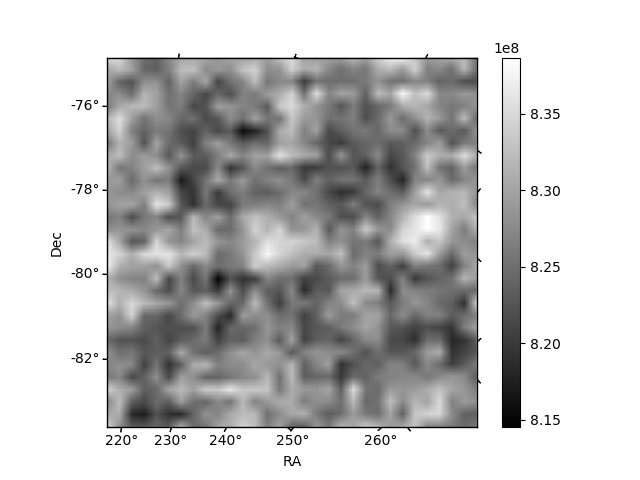
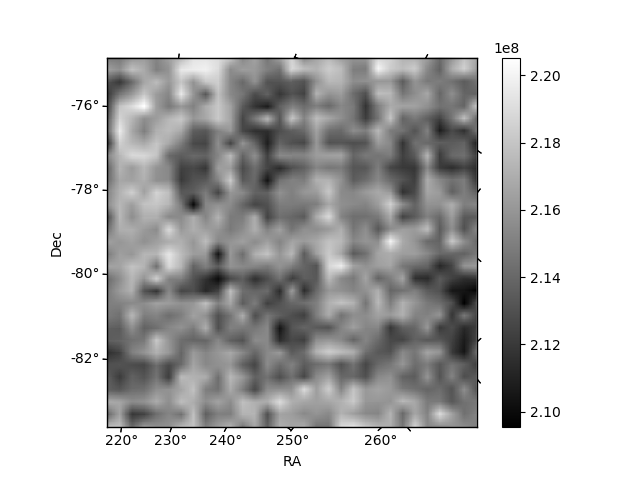
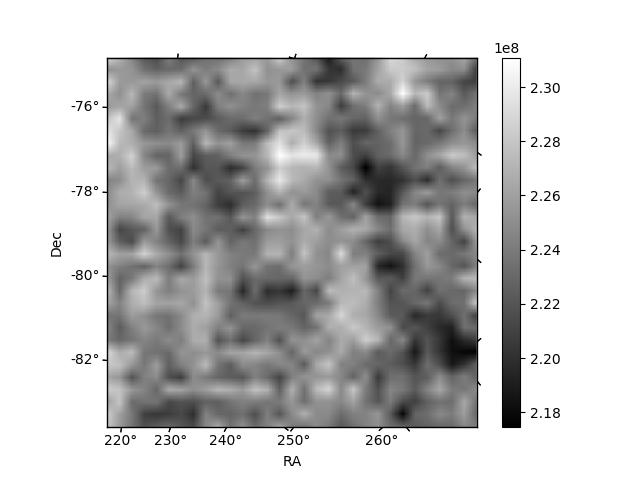
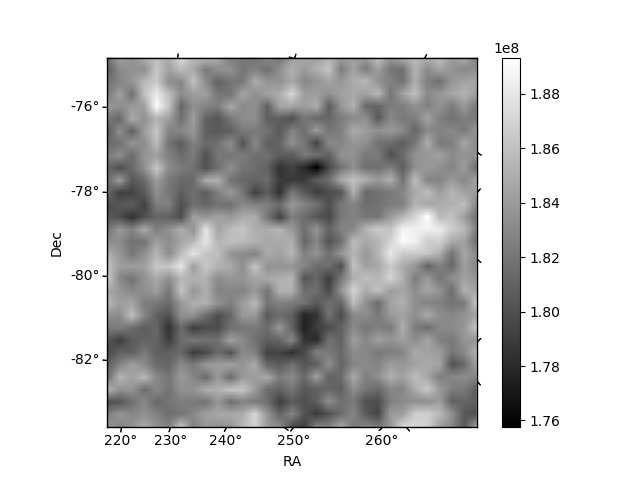
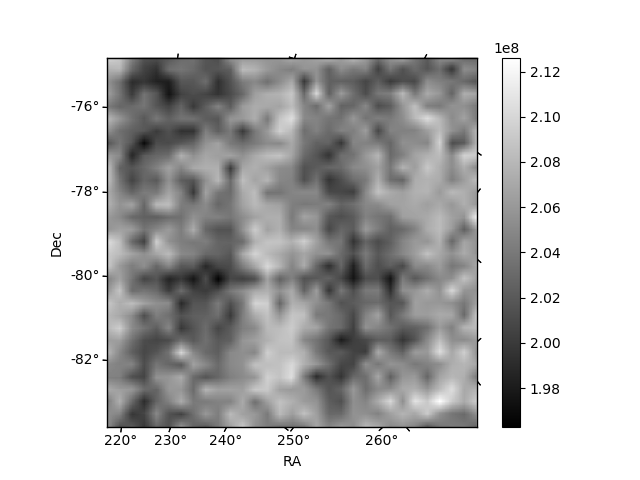
Histogram calculated using DETX and DETY for each event in the final _common_clean file
| Quadrant A | 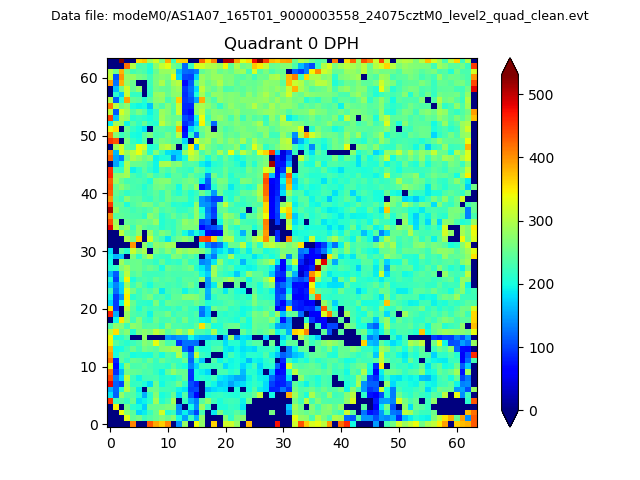 |
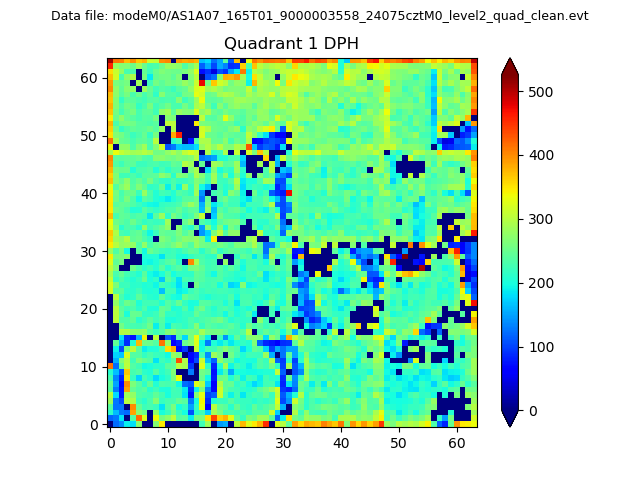 |
Quadrant B |
|---|---|---|---|
| Quadrant D | 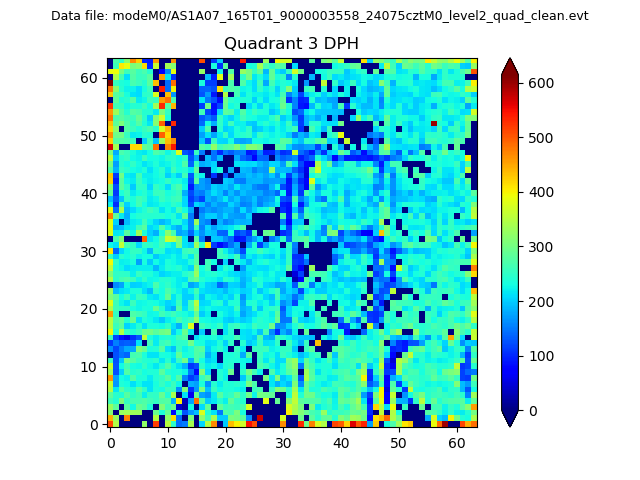 |
 |
Quadrant C |
| Plot type | Count rate plots | Images |
|---|---|---|
| Comparison with Poisson distribution Blue bars denote a histogram of data divided into 1 sec bins. Red curve is a Poisson curve with rate = median count rate of data. |
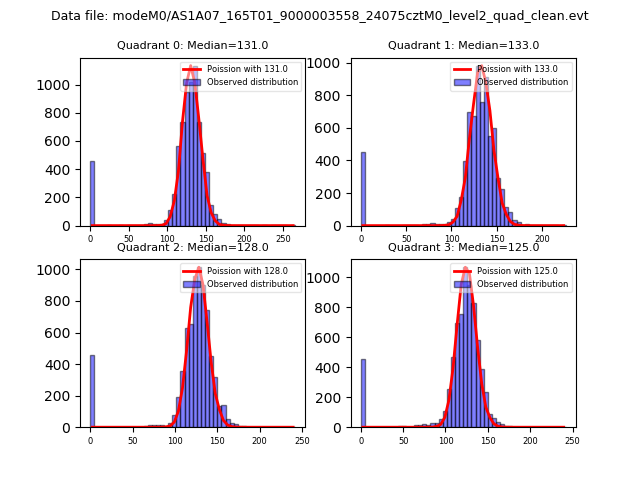 |
 |
| Quadrant-wise count rates Data is divided into 100 sec bins |
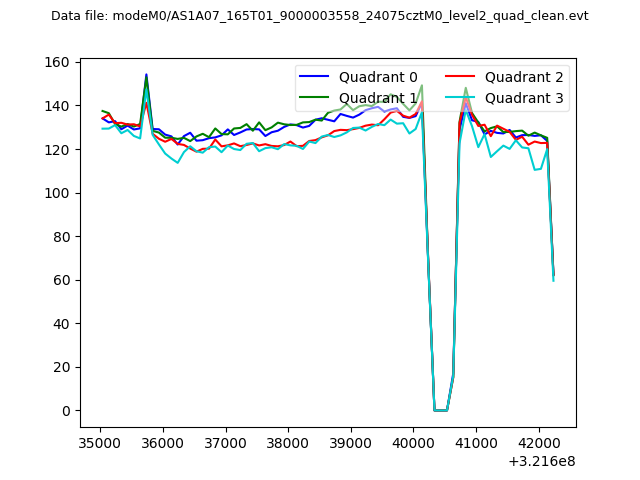 |
|
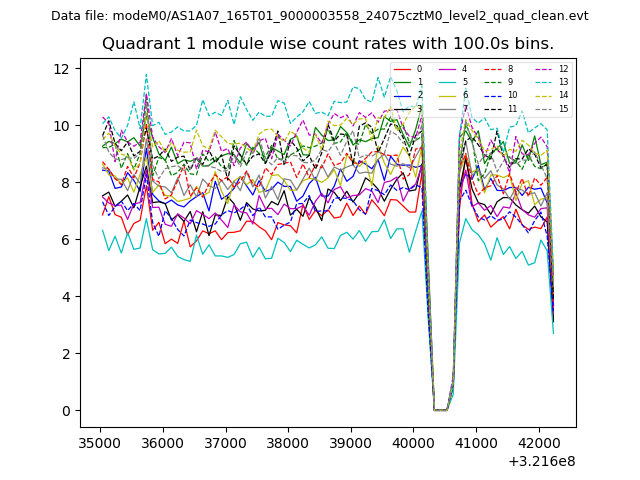
| Module-wise count rates for Quadrant A Data is divided into 100 sec bins |
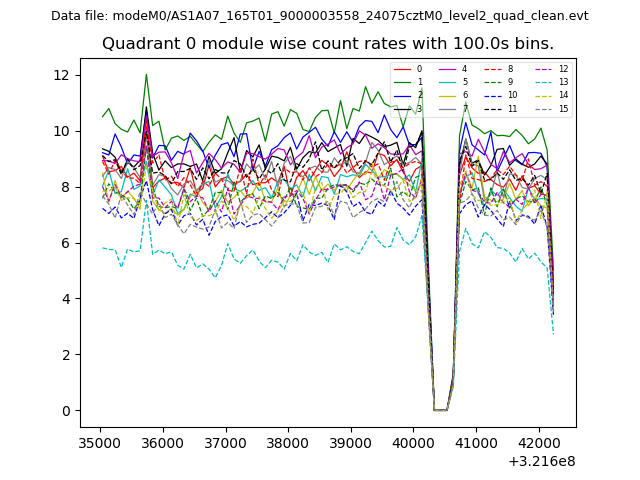 |
 |
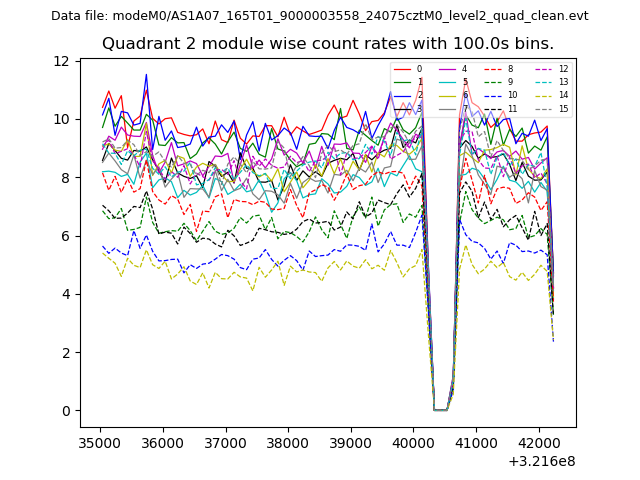
| Module-wise count rates for Quadrant B Data is divided into 100 sec bins |
 |
 |
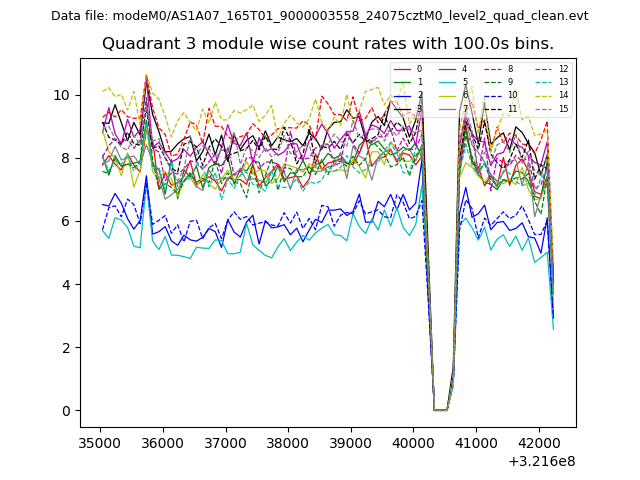
| Module-wise count rates for Quadrant C Data is divided into 100 sec bins |
 |
 |
| Module-wise count rates for Quadrant D Data is divided into 100 sec bins |
 |
 |
| Parameter | Plot |
|---|---|
| CZT HV Monitor | 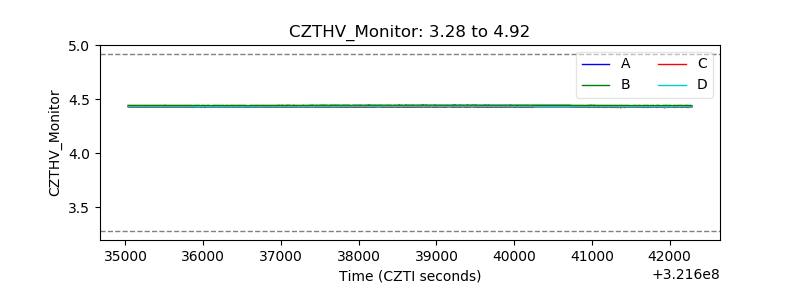 |
| D_VDD | 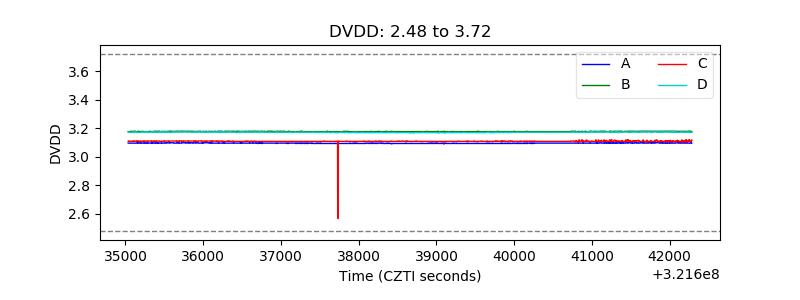 |
| Temperature 1 |  |
| Veto HV Monitor | 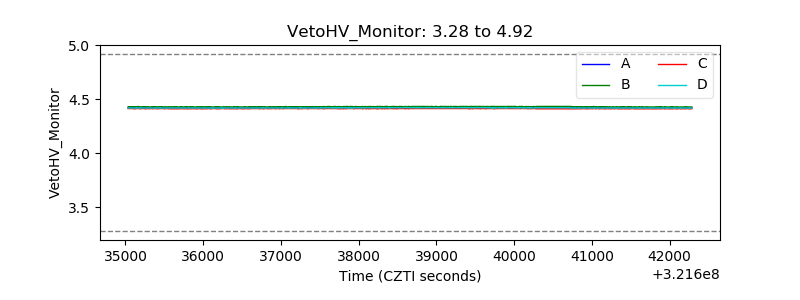 |
| Veto LLD | 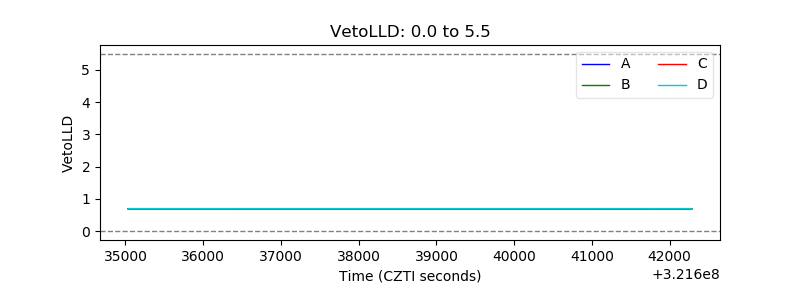 |
| Alpha Counter | 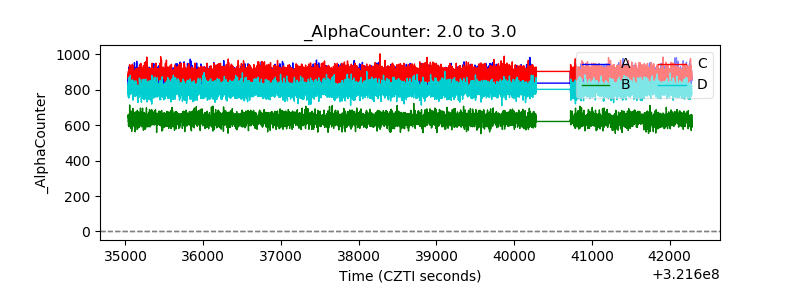 |
| _CPM_Rate | 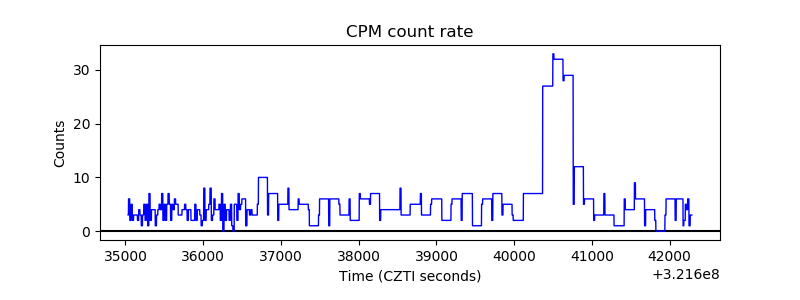 |
| CZT Counter | 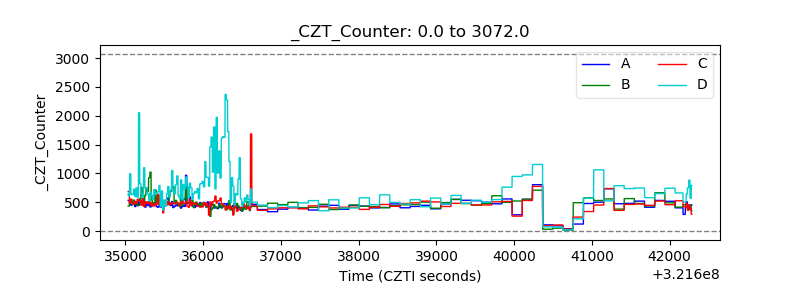 |
| +2.5 Volts monitor |  |
| +5 Volts monitor |  |
| _ROLL_ROT | 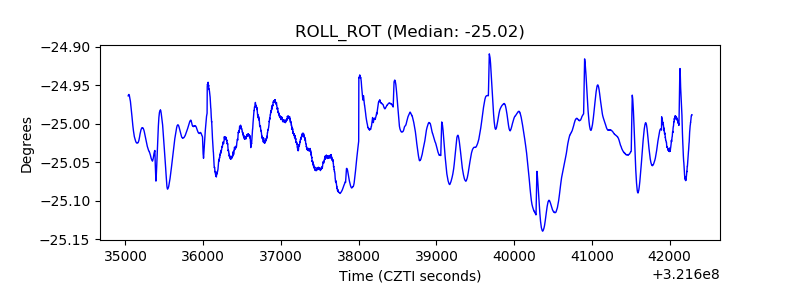 |
| _Roll_DEC | 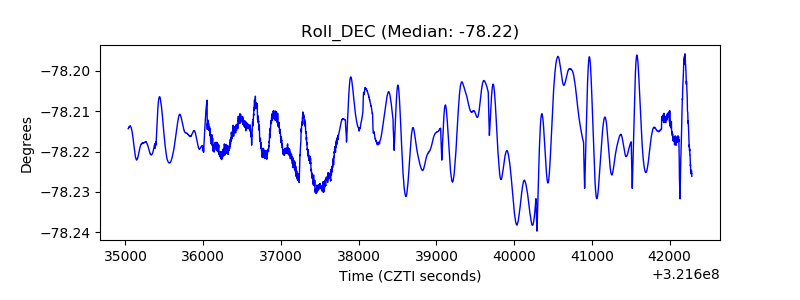 |
| _Roll_RA | 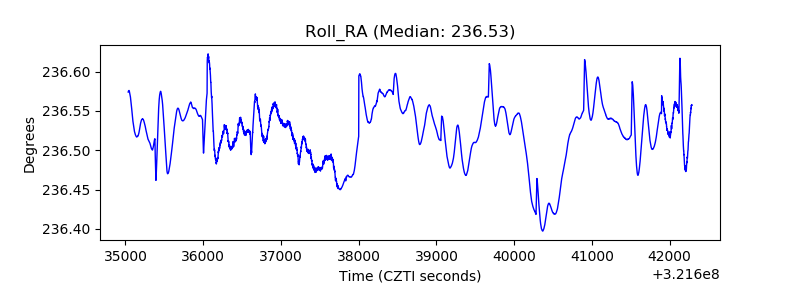 |
| Veto Counter | 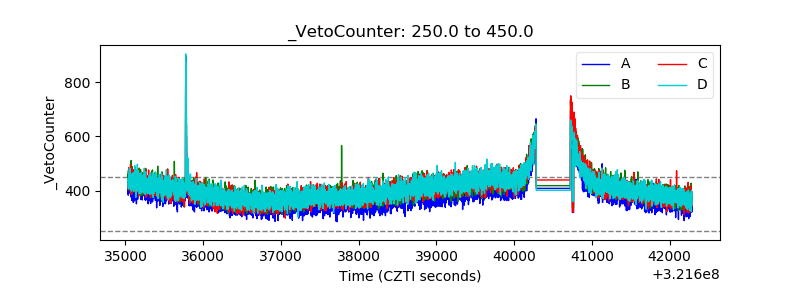 |