| Param | Original file | Final file |
|---|---|---|
| Filename | modeM0/AS1A07_165T01_9000003558_24077cztM0_level2.evt | modeM0/AS1A07_165T01_9000003558_24077cztM0_level2_quad_clean.evt |
| Size (bytes) | 549,316,800 | 140,590,080 |
| Size | 523.9 MB | 134.1 MB |
| Events in quadrant A | 3,444,939 | 953,061 |
| Events in quadrant B | 4,023,317 | 955,674 |
| Events in quadrant C | 3,766,889 | 926,717 |
| Events in quadrant D | 4,895,483 | 904,382 |
| Mode M9 | |||
|---|---|---|---|
| Quadrant | BADHDUFLAG | Total packets | Discarded packets |
| A | 0 | 5 | 0 |
| B | 0 | 6 | 0 |
| C | 0 | 6 | 0 |
| D | 0 | 6 | 0 |
| Mode M0 | |||
|---|---|---|---|
| Quadrant | BADHDUFLAG | Total packets | Discarded packets |
| A | 0 | 15246 | 2 |
| B | 0 | 16819 | 2 |
| C | 0 | 16076 | 2 |
| D | 0 | 19515 | 2 |
| Mode SS | |||
|---|---|---|---|
| Quadrant | BADHDUFLAG | Total packets | Discarded packets |
| A | 0 | 150 | 0 |
| B | 0 | 150 | 0 |
| C | 0 | 150 | 0 |
| D | 0 | 150 | 0 |
| Quadrant | Total seconds | Saturated seconds | Saturation percentage |
|---|---|---|---|
| A | 7453 | 71 | 0.952637% |
| B | 7453 | 250 | 3.354354% |
| C | 7453 | 125 | 1.677177% |
| D | 7453 | 134 | 1.797934% |
Noise dominated data is calculated using 1-second bins in cleaned event files. If a bin has >2000 counts, and if more than 50% of those come from <1% of pixels, then it is considered to be noise-dominated and hence unusable.
| Quadrant | # 1 sec bins | Bins with >0 counts | Bins with >2000 counts | High rate bins dominated by noise | Noise dominated (total time) | Noise dominated (detector-on time) | Marked lightcurve |
|---|---|---|---|---|---|---|---|
| A | 7848 | 7454 | 0 | 0 | 0.00% | 0.00% | 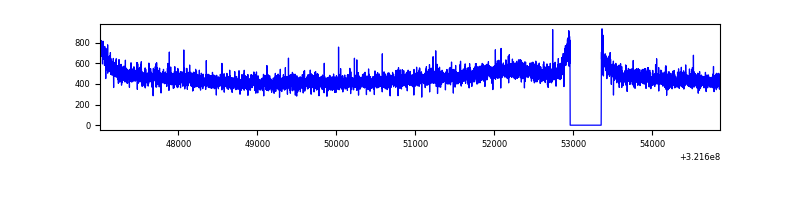 |
| B | 7848 | 7454 | 108 | 108 | 1.38% | 1.45% | 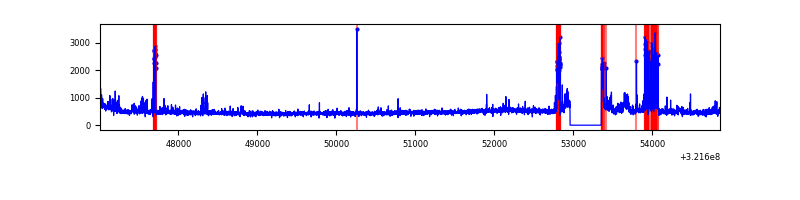 |
| C | 7848 | 7454 | 5 | 5 | 0.06% | 0.07% | 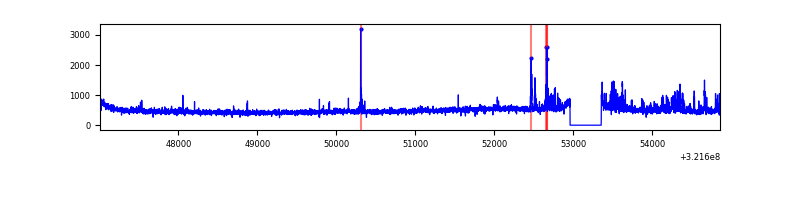 |
| D | 7848 | 7454 | 89 | 89 | 1.13% | 1.19% | 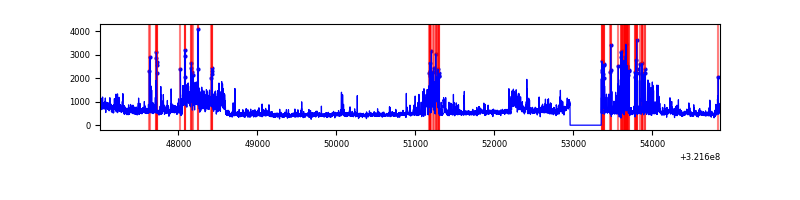 |
Top three noisy pixels from each quadrant. If the there are fewer than three noisy pixels in the level2.evt file, extra rows are filled as -1
| Pixel properties | Quadrant properties | ||||||
|---|---|---|---|---|---|---|---|
| Quadrant | DetID | PixID | Counts | Sigma | Mean | Median | Sigma |
| A | 13 | 254 | 13058 | 67.97 | 890 | 873 | 179.3 |
| A | 0 | 226 | 7736 | 38.28 | 890 | 873 | 179.3 |
| A | 3 | 137 | 7613 | 37.6 | 890 | 873 | 179.3 |
| B | 0 | 197 | 384618 | 2333.57 | 880 | 859 | 164.5 |
| B | 0 | 245 | 77616 | 466.75 | 880 | 859 | 164.5 |
| B | 0 | 189 | 62017 | 371.89 | 880 | 859 | 164.5 |
| C | 10 | 9 | 212146 | 1069.04 | 849 | 853 | 197.6 |
| C | 14 | 238 | 134079 | 674.06 | 849 | 853 | 197.6 |
| C | 7 | 247 | 87200 | 436.88 | 849 | 853 | 197.6 |
| D | 8 | 195 | 935983 | 4533.31 | 858 | 833 | 206.3 |
| D | 1 | 52 | 584488 | 2829.38 | 858 | 833 | 206.3 |
| D | 12 | 233 | 46790 | 222.79 | 858 | 833 | 206.3 |
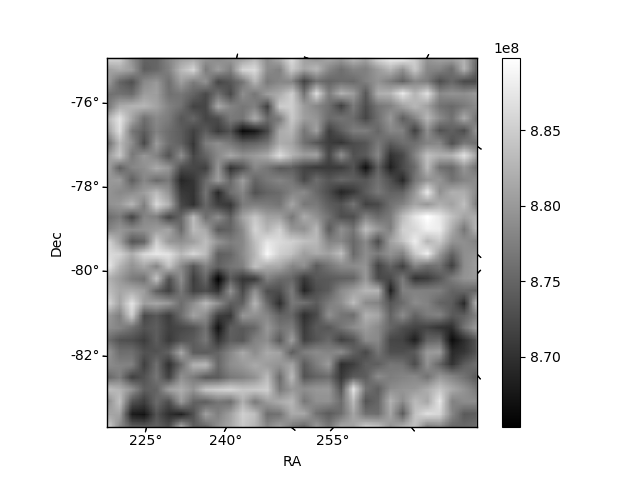
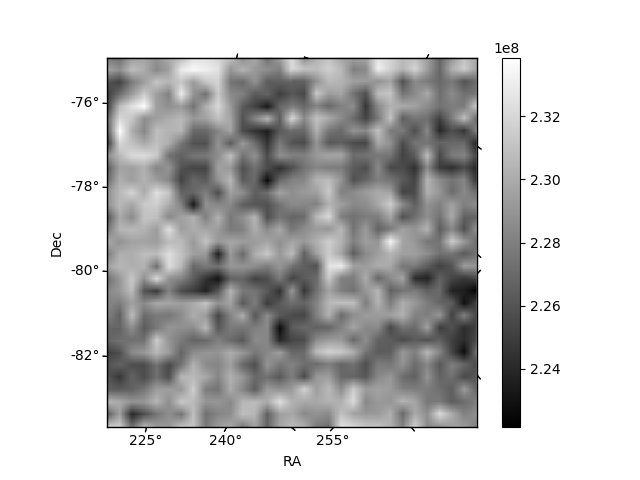
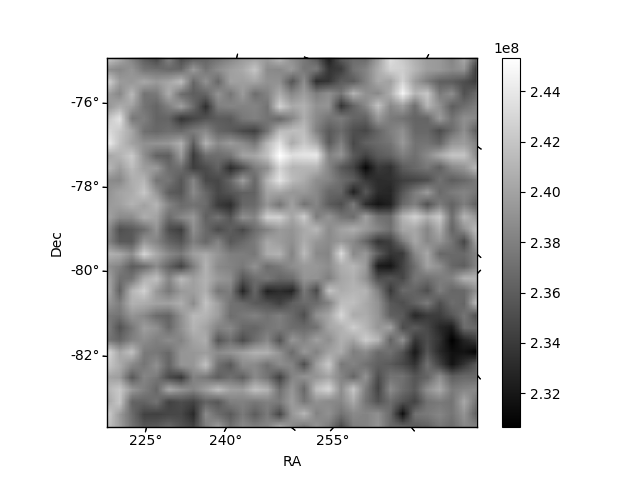
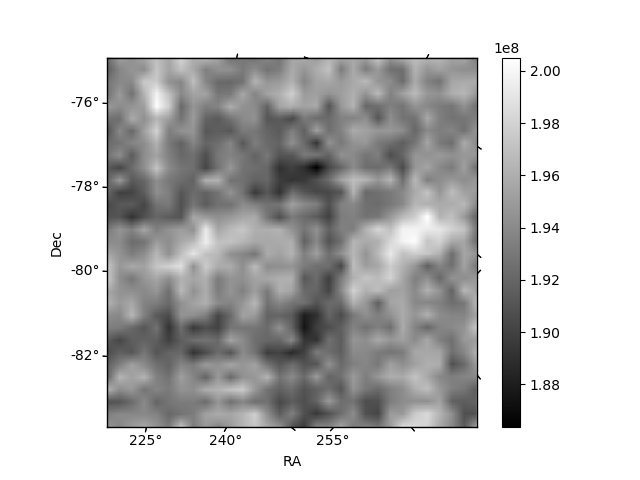
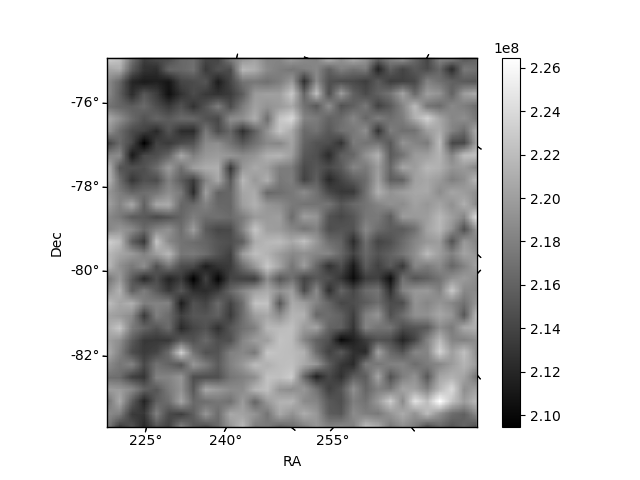
Histogram calculated using DETX and DETY for each event in the final _common_clean file
| Quadrant A | 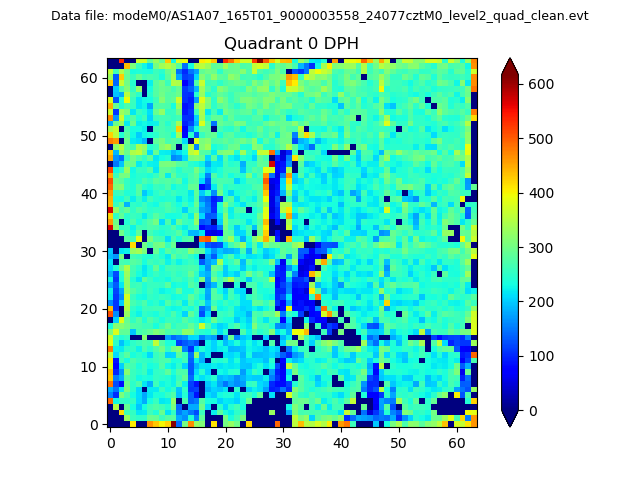 |
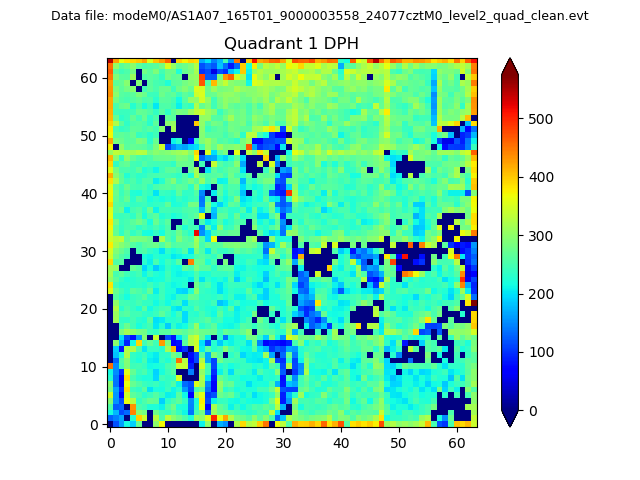 |
Quadrant B |
|---|---|---|---|
| Quadrant D |  |
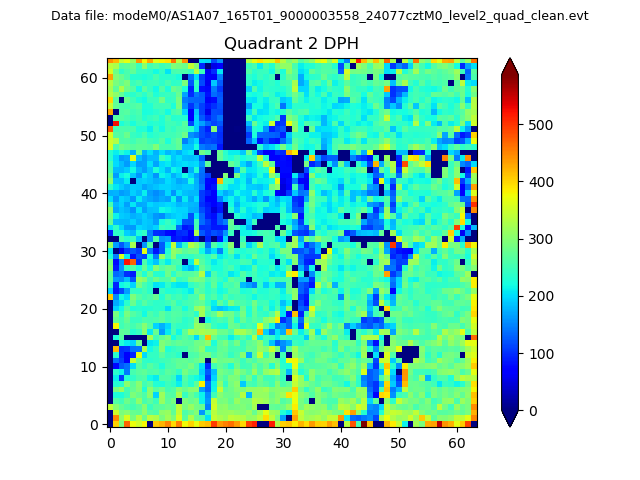 |
Quadrant C |
| Plot type | Count rate plots | Images |
|---|---|---|
| Comparison with Poisson distribution Blue bars denote a histogram of data divided into 1 sec bins. Red curve is a Poisson curve with rate = median count rate of data. |
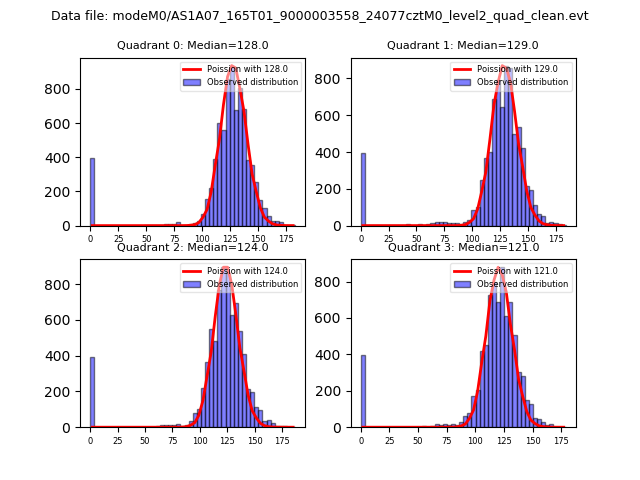 |
 |
| Quadrant-wise count rates Data is divided into 100 sec bins |
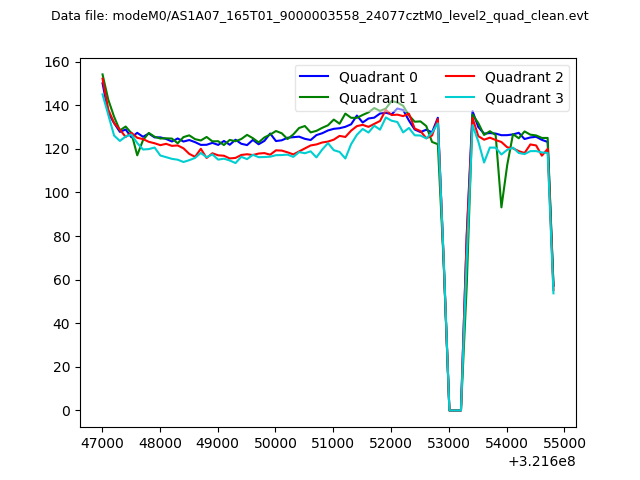 |
|
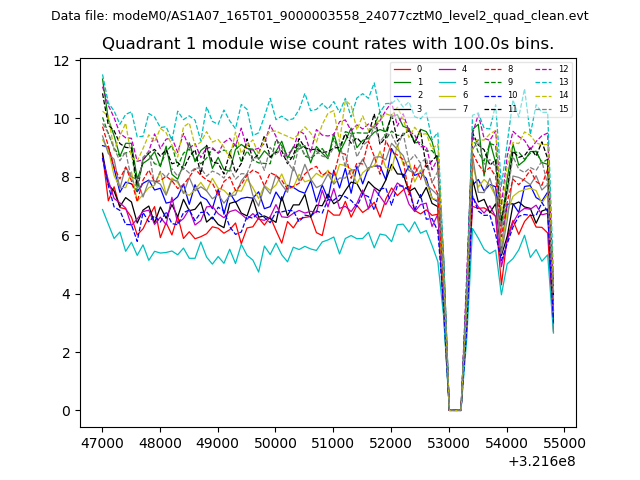
| Module-wise count rates for Quadrant A Data is divided into 100 sec bins |
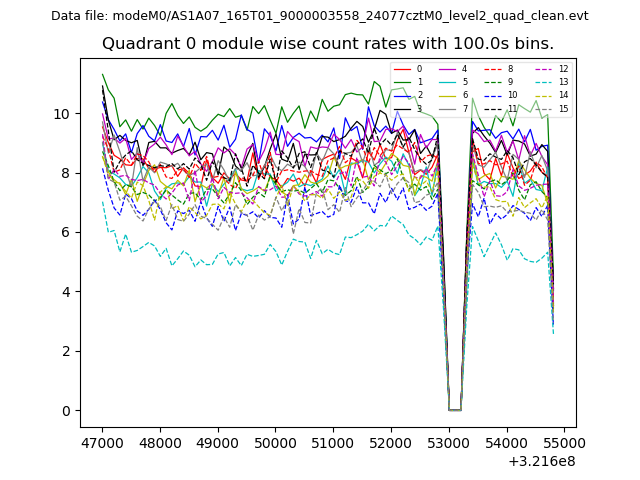 |
 |
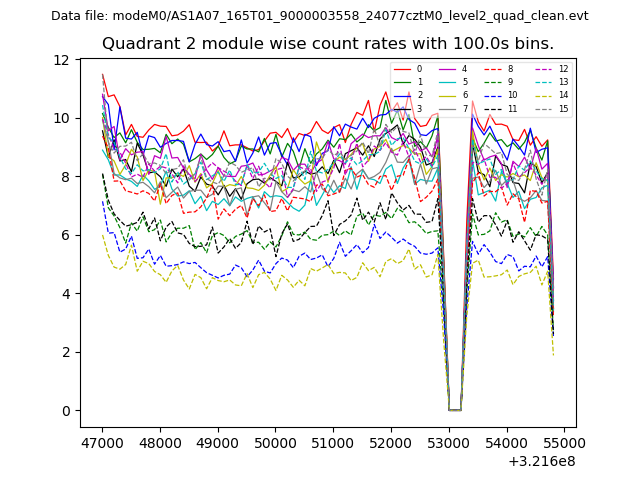
| Module-wise count rates for Quadrant B Data is divided into 100 sec bins |
 |
 |
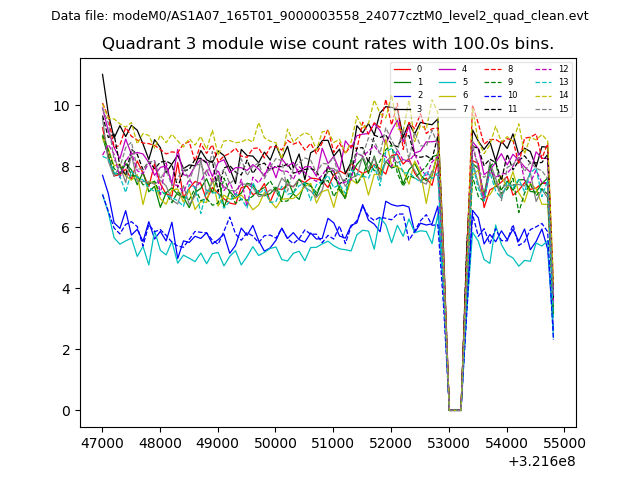
| Module-wise count rates for Quadrant C Data is divided into 100 sec bins |
 |
 |
| Module-wise count rates for Quadrant D Data is divided into 100 sec bins |
 |
 |
| Parameter | Plot |
|---|---|
| CZT HV Monitor |  |
| D_VDD | 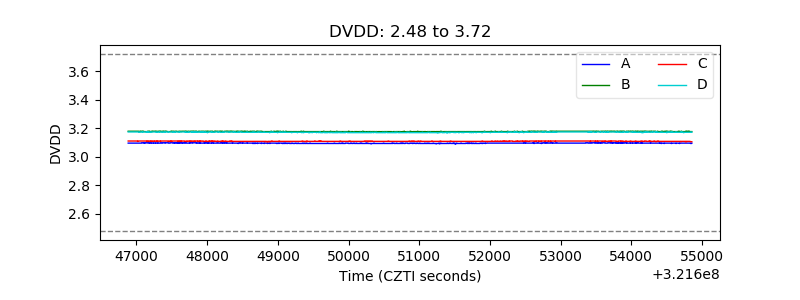 |
| Temperature 1 | 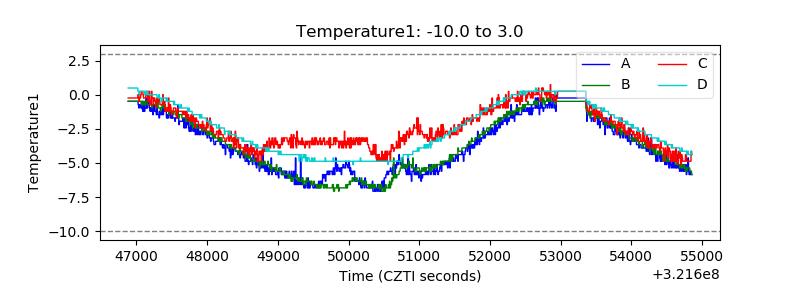 |
| Veto HV Monitor | 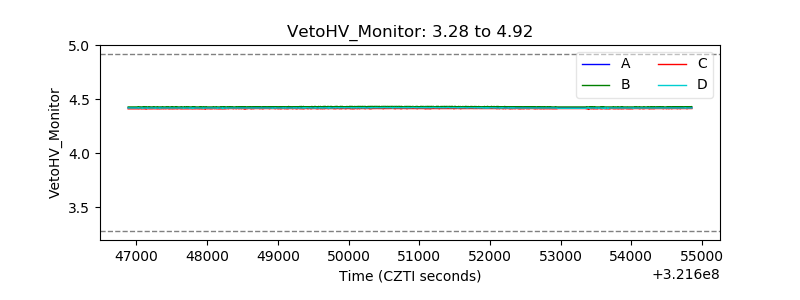 |
| Veto LLD | 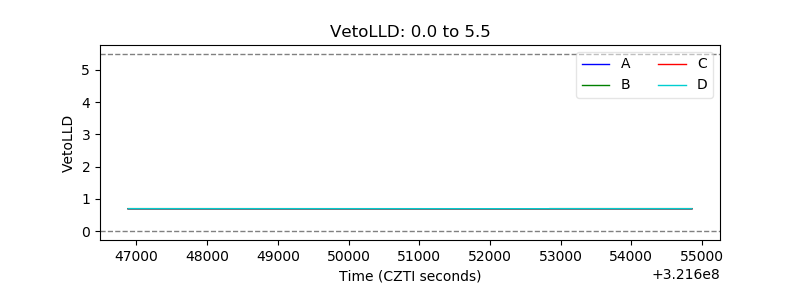 |
| Alpha Counter | 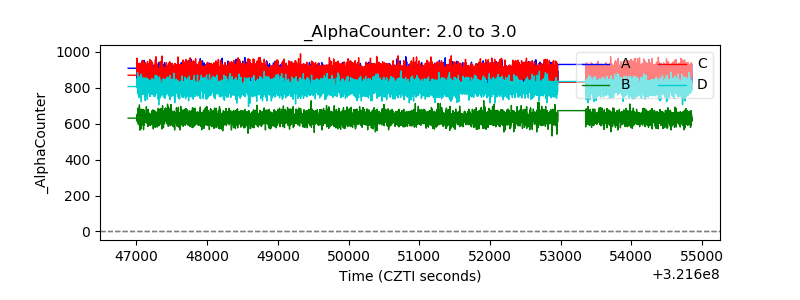 |
| _CPM_Rate | 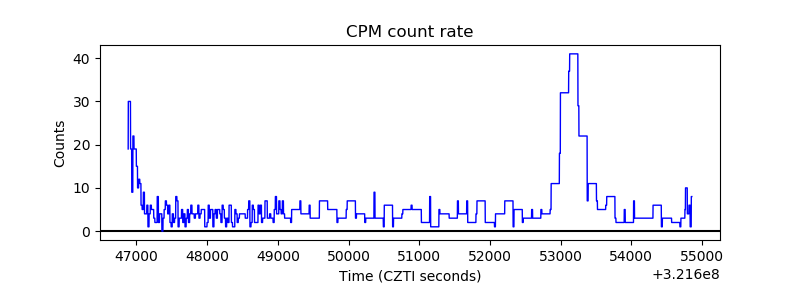 |
| CZT Counter | 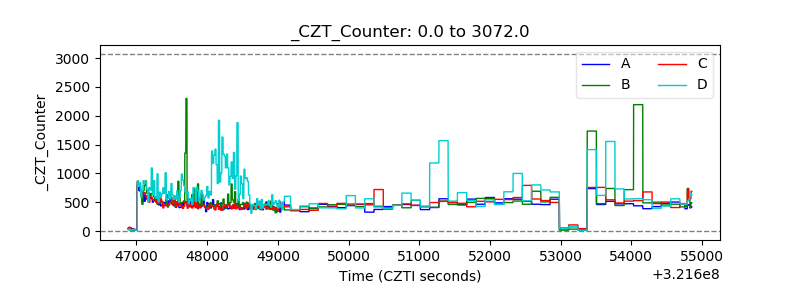 |
| +2.5 Volts monitor |  |
| +5 Volts monitor |  |
| _ROLL_ROT | 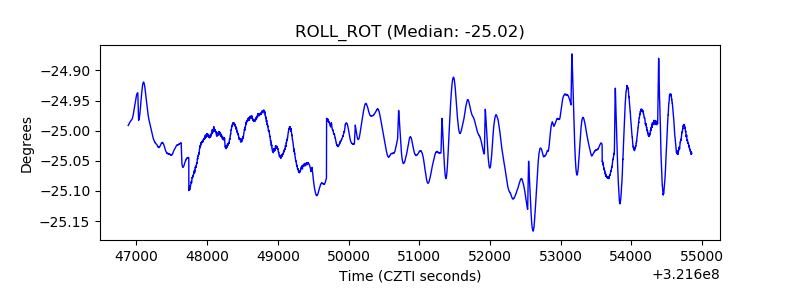 |
| _Roll_DEC | 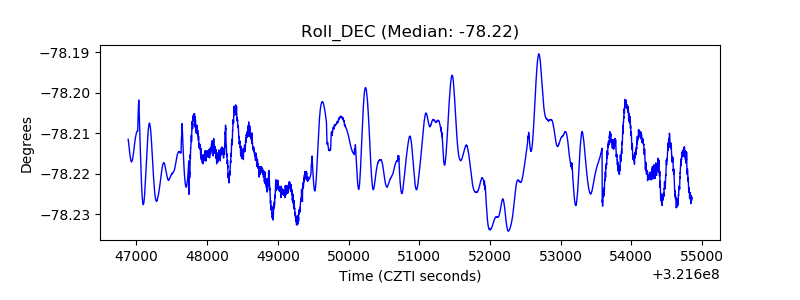 |
| _Roll_RA | 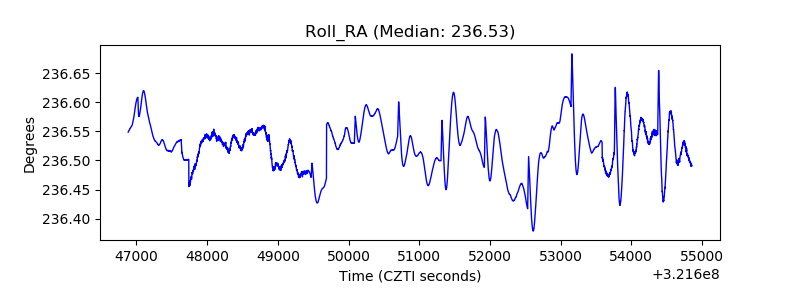 |
| Veto Counter | 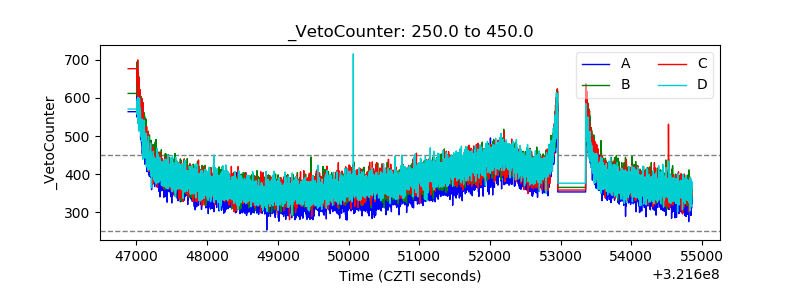 |