| Param | Original file | Final file |
|---|---|---|
| Filename | modeM0/AS1C05_002T08_9000003556cztM0_level2.fits | modeM0/AS1C05_002T08_9000003556cztM0_level2_quad_clean.evt |
| Size (bytes) | 60,854,400 | 31,037,760 |
| Size | 58.0 MB | 29.6 MB |
| Events in quadrant A | 410,218 | 168,643 |
| Events in quadrant B | 384,936 | 168,593 |
| Events in quadrant C | 390,866 | 159,841 |
| Events in quadrant D | 274,150 | 59,437 |
| Mode M0 | |||
|---|---|---|---|
| Quadrant | BADHDUFLAG | Total packets | Discarded packets |
| A | 0 | 12084 | 0 |
| B | 0 | 12609 | 0 |
| C | 0 | 12179 | 0 |
| D | 0 | 28993 | 0 |
| Mode M9 | |||
|---|---|---|---|
| Quadrant | BADHDUFLAG | Total packets | Discarded packets |
| A | 0 | 13 | 0 |
| B | 0 | 13 | 0 |
| C | 0 | 13 | 0 |
| D | 0 | 13 | 0 |
| Mode SS | |||
|---|---|---|---|
| Quadrant | BADHDUFLAG | Total packets | Discarded packets |
| A | 0 | 110 | 0 |
| B | 0 | 110 | 0 |
| C | 0 | 110 | 0 |
| D | 0 | 110 | 0 |
| Quadrant | Total seconds | Saturated seconds | Saturation percentage |
|---|---|---|---|
| A | 5463 | 60 | 1.098298% |
| B | 5463 | 109 | 1.995241% |
| C | 5463 | 93 | 1.702361% |
| D | 5463 | 2314 | 42.357679% |
Noise dominated data is calculated using 1-second bins in cleaned event files. If a bin has >2000 counts, and if more than 50% of those come from <1% of pixels, then it is considered to be noise-dominated and hence unusable.
| Quadrant | # 1 sec bins | Bins with >0 counts | Bins with >2000 counts | High rate bins dominated by noise | Noise dominated (total time) | Noise dominated (detector-on time) | Marked lightcurve |
|---|---|---|---|---|---|---|---|
| A | 6728 | 5463 | 0 | 0 | 0.00% | 0.00% |  |
| B | 6728 | 5463 | 0 | 0 | 0.00% | 0.00% |  |
| C | 6728 | 5463 | 0 | 0 | 0.00% | 0.00% |  |
| D | 6728 | 5435 | 0 | 0 | 0.00% | 0.00% |  |
Top three noisy pixels from each quadrant. If the there are fewer than three noisy pixels in the level2.evt file, extra rows are filled as -1
| Pixel properties | Quadrant properties | ||||||
|---|---|---|---|---|---|---|---|
| Quadrant | DetID | PixID | Counts | Sigma | Mean | Median | Sigma |
| A | 0 | 29 | 364 | 9.47 | 107 | 101 | 27.8 |
| A | 7 | 110 | 310 | 7.52 | 107 | 101 | 27.8 |
| A | 14 | 95 | 307 | 7.42 | 107 | 101 | 27.8 |
| B | 2 | 9 | 290 | 8.66 | 102 | 98 | 22.2 |
| B | 5 | 128 | 263 | 7.44 | 102 | 98 | 22.2 |
| B | 5 | 225 | 252 | 6.95 | 102 | 98 | 22.2 |
| C | 3 | 235 | 286 | 6.84 | 103 | 98 | 27.5 |
| C | 3 | 234 | 280 | 6.62 | 103 | 98 | 27.5 |
| C | 9 | 209 | 279 | 6.58 | 103 | 98 | 27.5 |
| D | 15 | 46 | 205 | 6.17 | 78 | 71 | 21.7 |
| D | 4 | 246 | 203 | 6.07 | 78 | 71 | 21.7 |
| D | 6 | 8 | 199 | 5.89 | 78 | 71 | 21.7 |
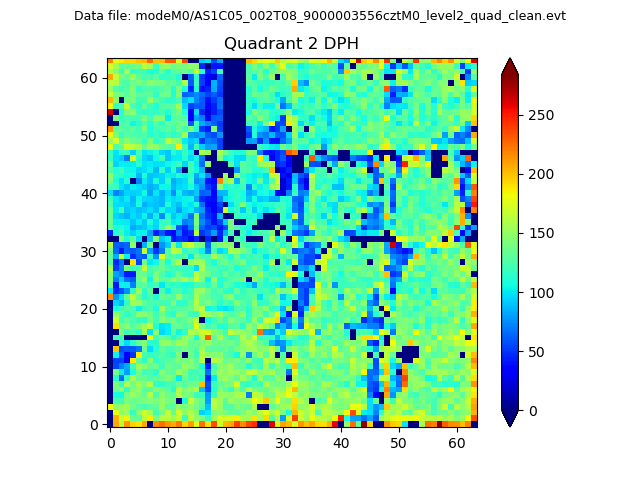
Histogram calculated using DETX and DETY for each event in the final _common_clean file
| Quadrant A |  |
 |
Quadrant B |
|---|---|---|---|
| Quadrant D |  |
 |
Quadrant C |
| Plot type | Count rate plots | Images |
|---|---|---|
| Comparison with Poisson distribution Blue bars denote a histogram of data divided into 1 sec bins. Red curve is a Poisson curve with rate = median count rate of data. |
 |
 |
| Quadrant-wise count rates Data is divided into 100 sec bins |
 |
|
| Module-wise count rates for Quadrant A Data is divided into 100 sec bins |
 |
 |
| Module-wise count rates for Quadrant B Data is divided into 100 sec bins |
 |
 |
| Module-wise count rates for Quadrant C Data is divided into 100 sec bins |
 |
 |
| Module-wise count rates for Quadrant D Data is divided into 100 sec bins |
 |
 |
| Parameter | Plot |
|---|---|
| CZT HV Monitor |  |
| D_VDD |  |
| Temperature 1 |  |
| Veto HV Monitor |  |
| Veto LLD |  |
| Alpha Counter |  |
| _CPM_Rate |  |
| CZT Counter |  |
| +2.5 Volts monitor |  |
| +5 Volts monitor |  |
| _ROLL_ROT |  |
| _Roll_DEC |  |
| _Roll_RA |  |
| Veto Counter | 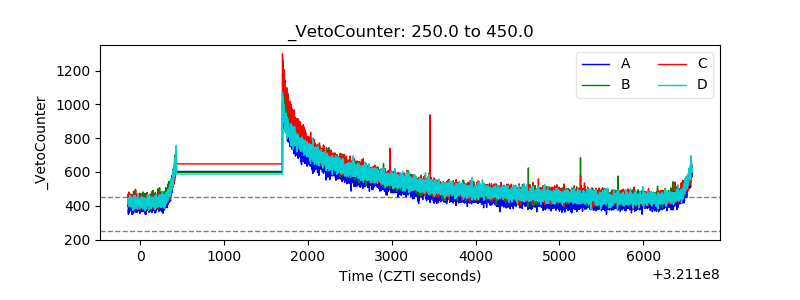 |