| Param | Original file | Final file |
|---|---|---|
| Filename | modeM0/AS1C05_002T08_9000003556_23983cztM0_level2.evt | modeM0/AS1C05_002T08_9000003556_23983cztM0_level2_quad_clean.evt |
| Size (bytes) | 224,340,480 | 16,865,280 |
| Size | 213.9 MB | 16.1 MB |
| Events in quadrant A | 1,266,821 | 91,055 |
| Events in quadrant B | 1,418,963 | 93,355 |
| Events in quadrant C | 1,317,614 | 87,868 |
| Events in quadrant D | 2,644,469 | 83,597 |
| Mode M0 | |||
|---|---|---|---|
| Quadrant | BADHDUFLAG | Total packets | Discarded packets |
| A | 0 | 5274 | 1 |
| B | 0 | 5684 | 1 |
| C | 0 | 5358 | 1 |
| D | 0 | 9319 | 1 |
| Mode M9 | |||
|---|---|---|---|
| Quadrant | BADHDUFLAG | Total packets | Discarded packets |
| A | 0 | 13 | 0 |
| B | 0 | 13 | 0 |
| C | 0 | 13 | 0 |
| D | 0 | 13 | 0 |
| Mode SS | |||
|---|---|---|---|
| Quadrant | BADHDUFLAG | Total packets | Discarded packets |
| A | 0 | 44 | 0 |
| B | 0 | 44 | 0 |
| C | 0 | 44 | 0 |
| D | 0 | 44 | 0 |
| Quadrant | Total seconds | Saturated seconds | Saturation percentage |
|---|---|---|---|
| A | 2130 | 51 | 2.394366% |
| B | 2130 | 96 | 4.507042% |
| C | 2130 | 74 | 3.474178% |
| D | 2130 | 584 | 27.417840% |
Noise dominated data is calculated using 1-second bins in cleaned event files. If a bin has >2000 counts, and if more than 50% of those come from <1% of pixels, then it is considered to be noise-dominated and hence unusable.
| Quadrant | # 1 sec bins | Bins with >0 counts | Bins with >2000 counts | High rate bins dominated by noise | Noise dominated (total time) | Noise dominated (detector-on time) | Marked lightcurve |
|---|---|---|---|---|---|---|---|
| A | 3395 | 2131 | 0 | 0 | 0.00% | 0.00% | 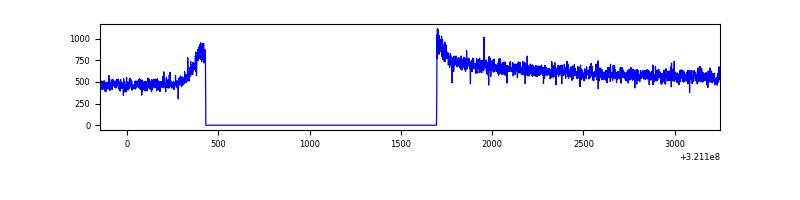 |
| B | 3395 | 2131 | 14 | 14 | 0.41% | 0.66% | 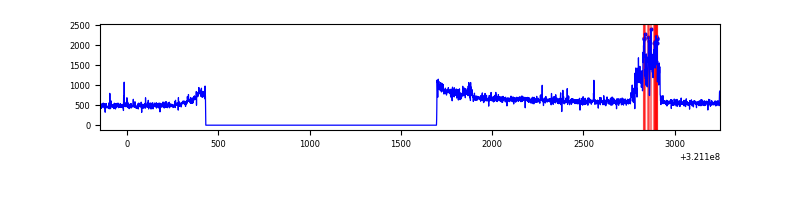 |
| C | 3395 | 2131 | 11 | 11 | 0.32% | 0.52% | 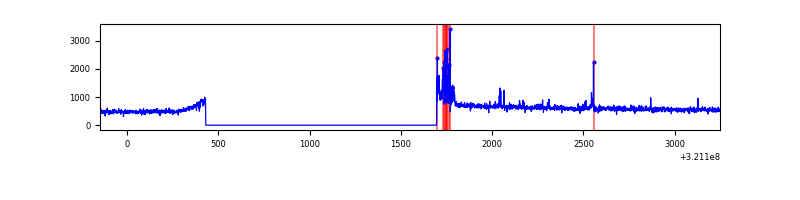 |
| D | 3395 | 2131 | 359 | 359 | 10.57% | 16.85% | 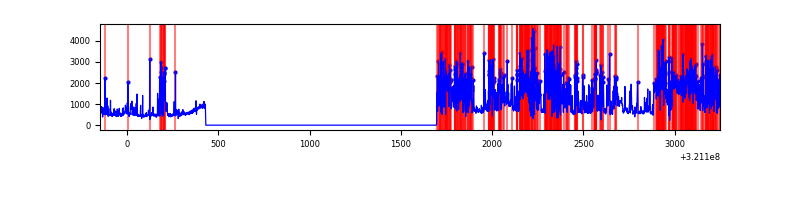 |
Top three noisy pixels from each quadrant. If the there are fewer than three noisy pixels in the level2.evt file, extra rows are filled as -1
| Pixel properties | Quadrant properties | ||||||
|---|---|---|---|---|---|---|---|
| Quadrant | DetID | PixID | Counts | Sigma | Mean | Median | Sigma |
| A | 13 | 254 | 3036 | 40.61 | 329 | 323 | 66.8 |
| A | 0 | 226 | 2779 | 36.76 | 329 | 323 | 66.8 |
| A | 3 | 137 | 2675 | 35.2 | 329 | 323 | 66.8 |
| B | 0 | 197 | 127840 | 2063.88 | 321 | 313 | 61.8 |
| B | 0 | 230 | 21700 | 346.12 | 321 | 313 | 61.8 |
| B | 0 | 190 | 9242 | 144.51 | 321 | 313 | 61.8 |
| C | 0 | 10 | 76169 | 1070.0 | 305 | 307 | 70.9 |
| C | 14 | 238 | 50124 | 702.64 | 305 | 307 | 70.9 |
| C | 13 | 61 | 2153 | 26.04 | 305 | 307 | 70.9 |
| D | 12 | 218 | 1174787 | 16758.93 | 283 | 274 | 70.1 |
| D | 1 | 52 | 140941 | 2007.15 | 283 | 274 | 70.1 |
| D | 12 | 233 | 94841 | 1349.36 | 283 | 274 | 70.1 |
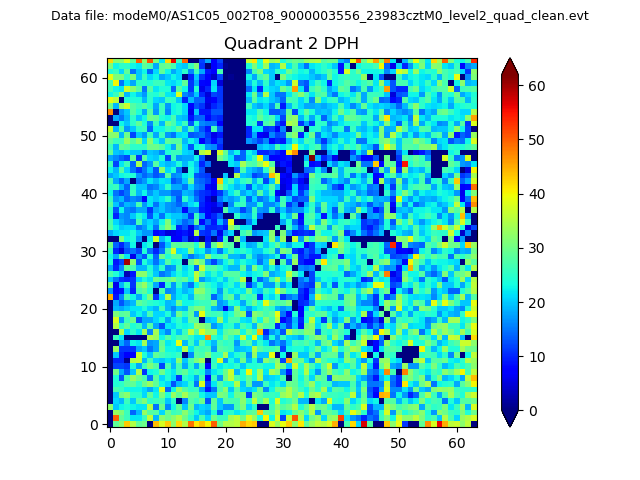
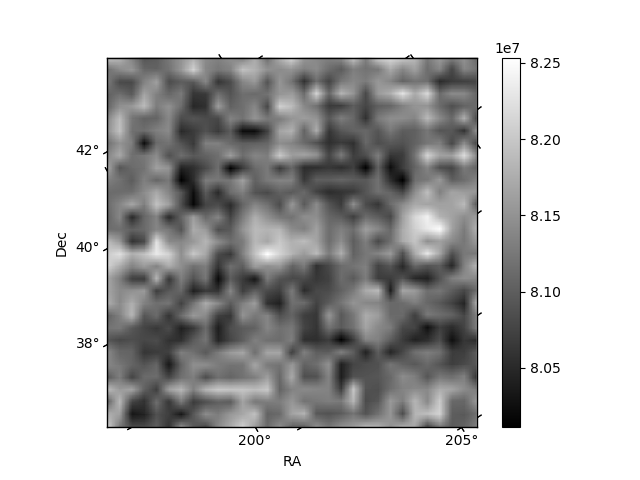
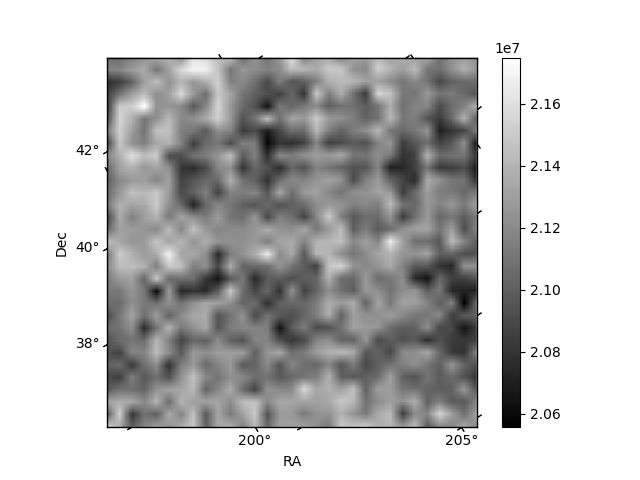
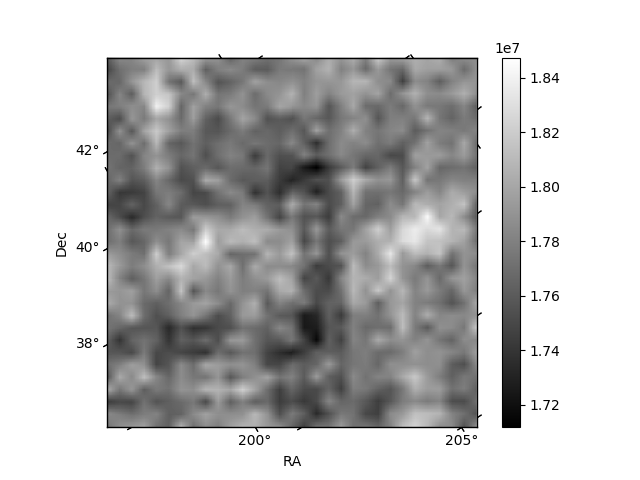
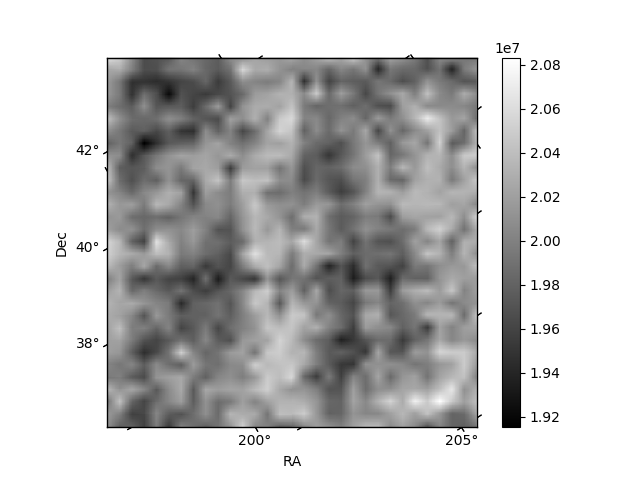
Histogram calculated using DETX and DETY for each event in the final _common_clean file
| Quadrant A | 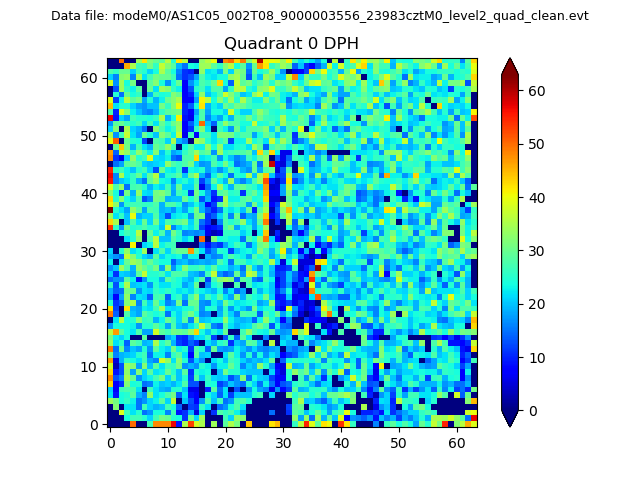 |
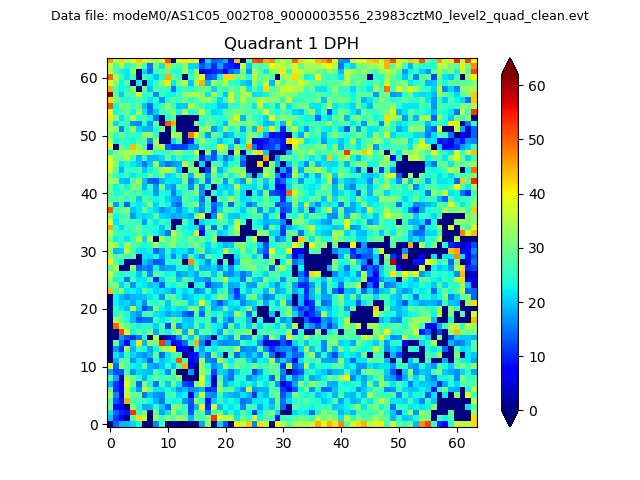 |
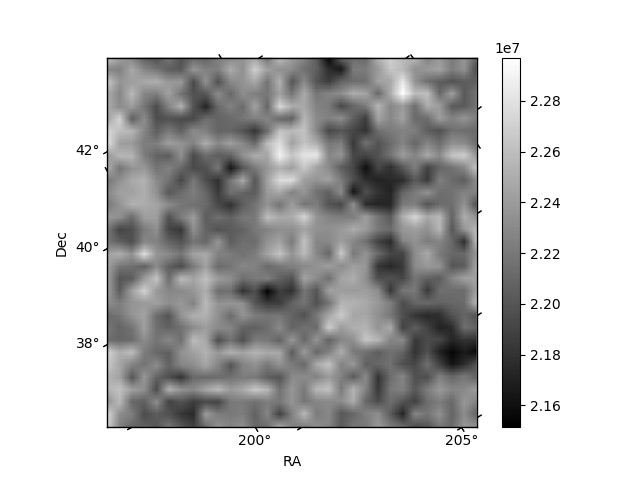
Quadrant B |
|---|---|---|---|
| Quadrant D | 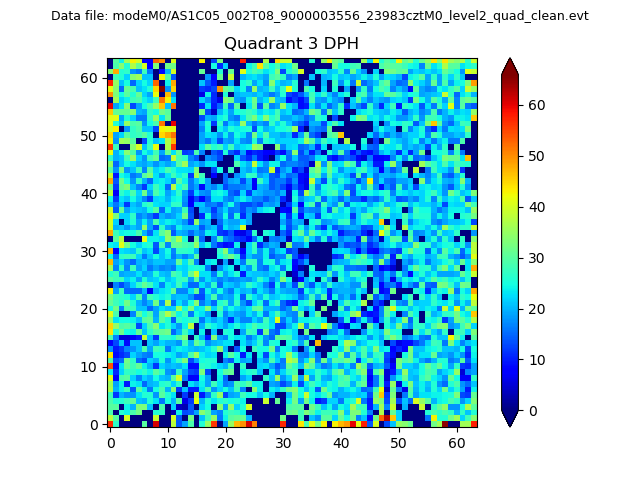 |
 |
Quadrant C |
| Plot type | Count rate plots | Images |
|---|---|---|
| Comparison with Poisson distribution Blue bars denote a histogram of data divided into 1 sec bins. Red curve is a Poisson curve with rate = median count rate of data. |
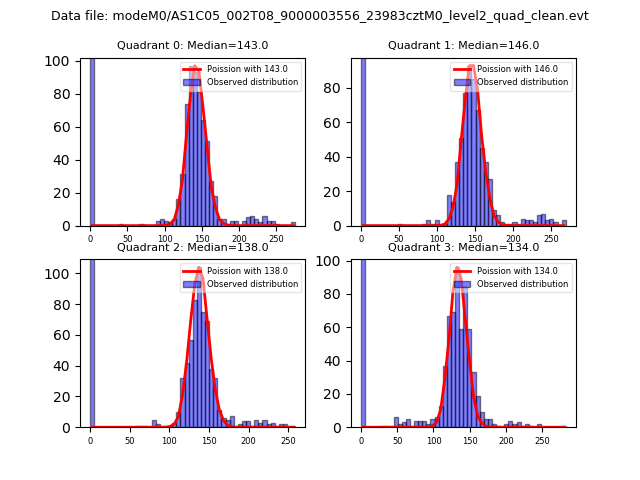 |
 |
| Quadrant-wise count rates Data is divided into 100 sec bins |
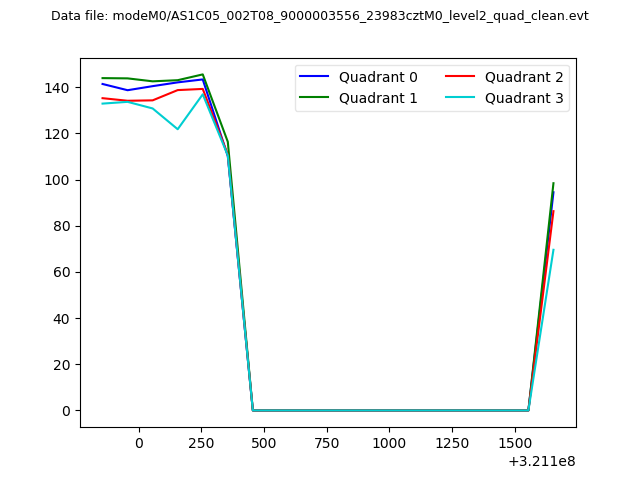 |
|
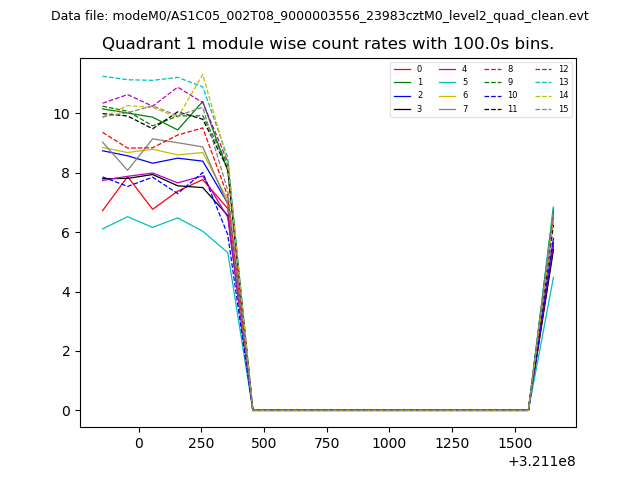
| Module-wise count rates for Quadrant A Data is divided into 100 sec bins |
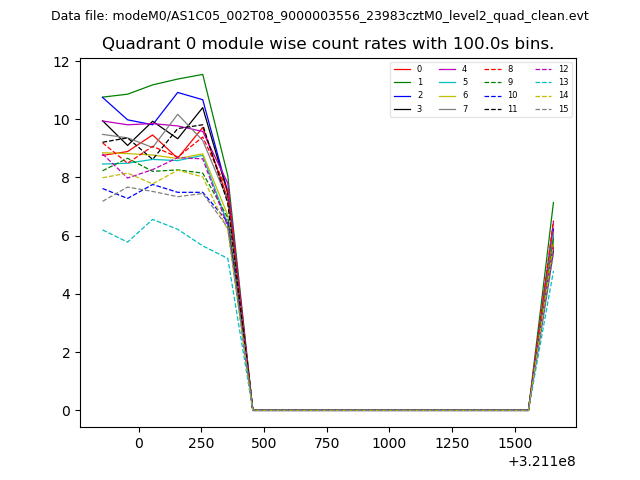 |
 |
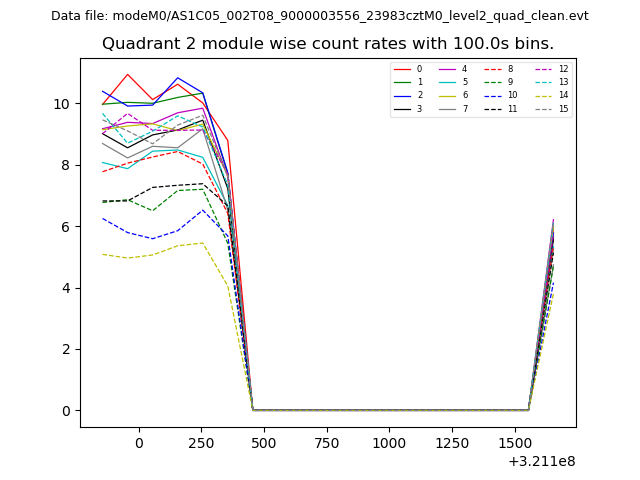
| Module-wise count rates for Quadrant B Data is divided into 100 sec bins |
 |
 |
| Module-wise count rates for Quadrant C Data is divided into 100 sec bins |
 |
 |
| Module-wise count rates for Quadrant D Data is divided into 100 sec bins |
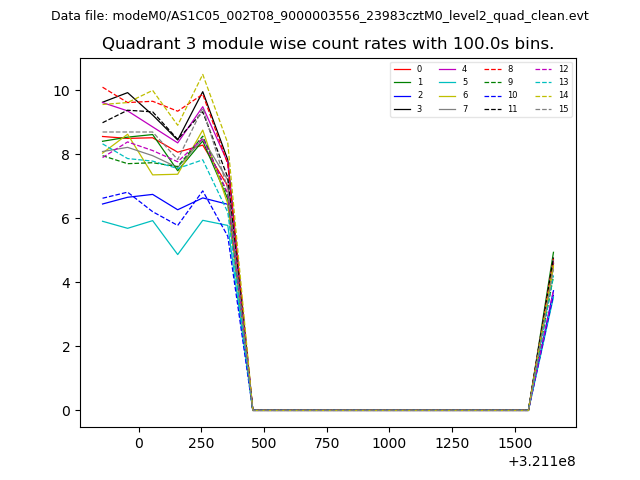 |
 |
| Parameter | Plot |
|---|---|
| CZT HV Monitor | 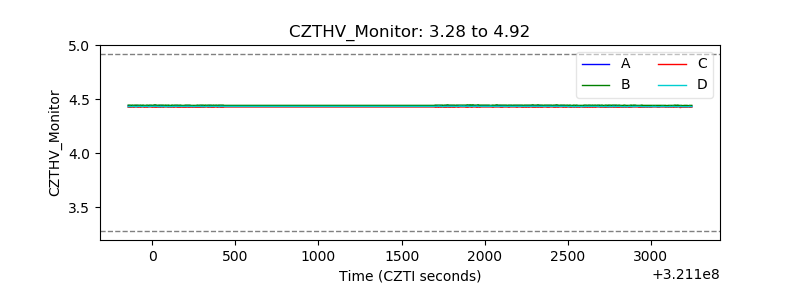 |
| D_VDD | 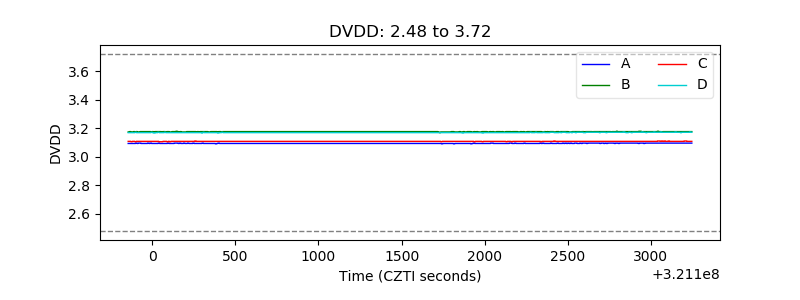 |
| Temperature 1 | 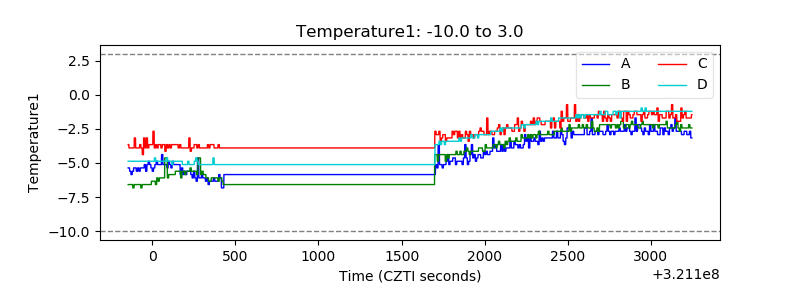 |
| Veto HV Monitor | 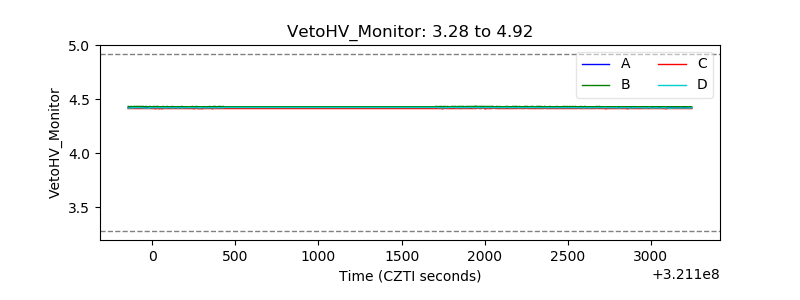 |
| Veto LLD | 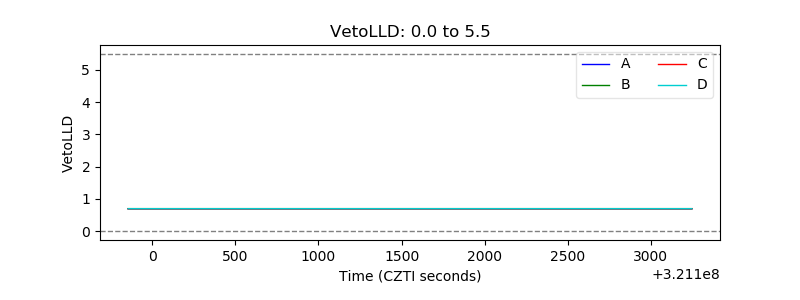 |
| Alpha Counter | 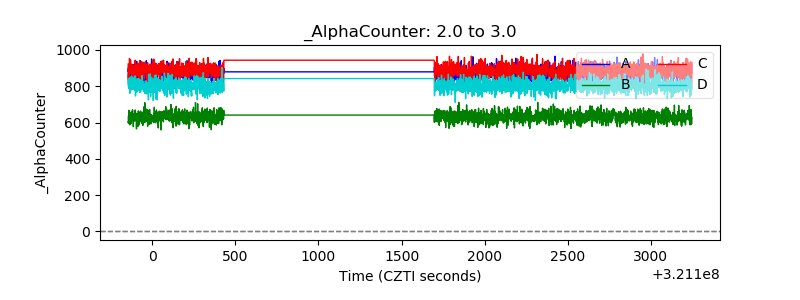 |
| _CPM_Rate | 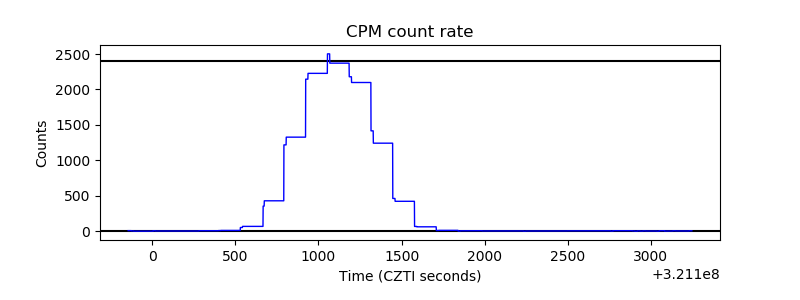 |
| CZT Counter | 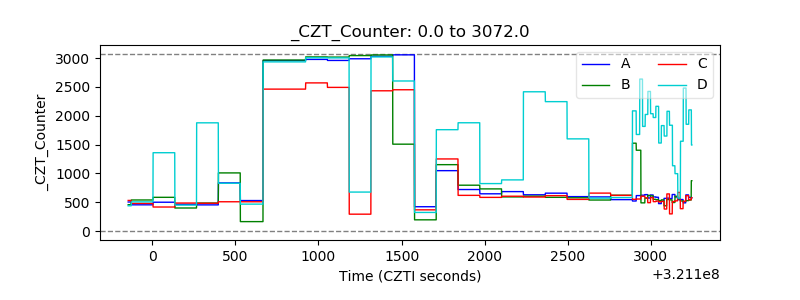 |
| +2.5 Volts monitor |  |
| +5 Volts monitor |  |
| _ROLL_ROT |  |
| _Roll_DEC | 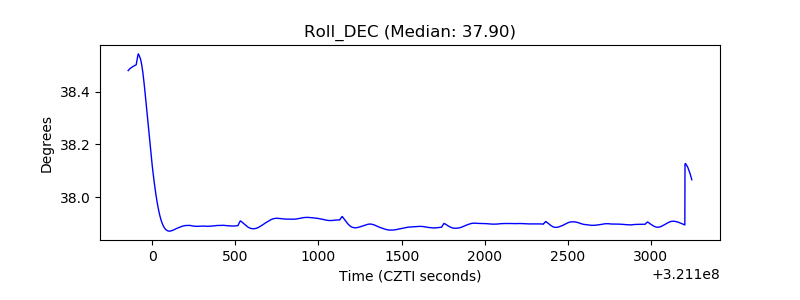 |
| _Roll_RA | 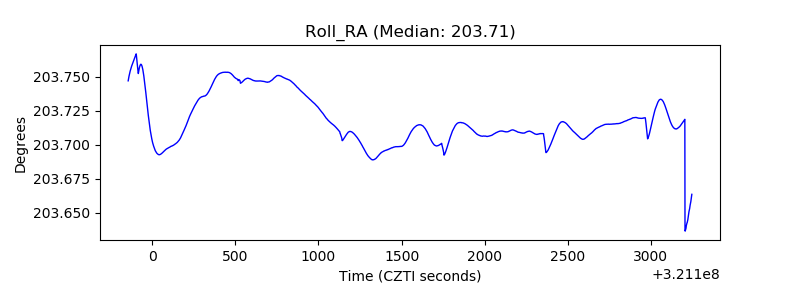 |
| Veto Counter | 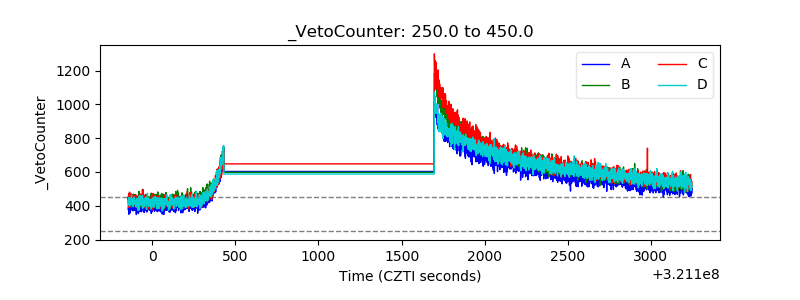 |